

Abstract
Magnetic Particle Imaging (MPI) is a new biomedical imaging modality that produces real-time, high-resolution tomographic images of superparamagnetic iron oxide (SPIO) nanoparticle tracer distributions. In this study, we synthesized monodisperse tracers for enhanced MPI performance and investigated both, their blood clearance time using a 25 kHz magnetic particle spectrometer (MPS), and biodistribution using a combination of quantitative T2-weighted MRI and tissue histology. In vitro and in vivo MPI performance of our magnetic nanoparticle tracers (MNTs), subject to biological constraints, were compared to commercially available SPIOs (Resovist). Monodisperse MNTs showed a 2-fold greater signal per unit mass, and 20% better spatial resolution. In vitro evaluation of tracers showed that MPI performance of our MNTs is preserved in blood, serum-rich cell culture medium and gel; thus independent of changes in hydrodynamic volume and fluid viscosity – a critical prerequisite for in vivo MPI. In a rodent model, our MNTs circulated for 15 minutes – 3× longer than Resovist – and supported our in vitro evaluation that MPI signal is preserved in the physiological environment. Furthermore, MRI and histology analysis showed that MNTs distribute in the reticuloendothelial system (RES) in a manner similar to clinically approved SPIO agents. MNTs demonstrating long-circulation times and optimized MPI performance show potential as angiography tracers and blood-pool agents for the emerging MPI imaging modality.
1. Introduction
Magnetic Particle Imaging (MPI) is an emerging real-time tomographic imaging modality, that quantitatively detects and images superparamagnetic iron oxide (SPIO) nanoparticles [1,2]. In addition to its intrinsic advantages in imaging, for its first clinical application MPI is being developed as a safe and competitive alternative to CT-angiography. Presently, CT-angiography scans use iodinated contrast media (ICM) for diagnosing cardiovascular disease. ICM subsequently undergo renal clearance and put patients with underlying renal dysfunction at high risk of contrast-induced nephropathy (CIN); ~25% of potential CT angiography patients also have chronic kidney disease (CKD) [3–6]. In contrast, MPI uses safe magnetic fields (no ionizing radiation) and SPIO magnetic nanoparticle tracers† (MNTs) that are generally well tolerated in CKD patients. However, for MPI to be clinically competitive, the in vivo performance of MNTs must be optimized. In our previous work we have modeled [7] and experimentally tailored [8,9] MNT size and size distribution to enhance MPI performance and demonstrated an 3-fold gain in sensitivity and 37% better spatial resolution than the best available commercial tracers (Resovist™) in phantom imaging [RM Ferguson et al, P Natl A Sci, submitted]. In clinical applications, however, MPI imaging performance depends fundamentally on the intrinsic properties and performance of MNTs in a complex biological environment, and thus the physical optimization of tracers is best carried out in concert with appropriate in vitro and in vivo models.
Current SPIO contrast agents developed for MRI, when used off-the-shelf, are grossly inadequate for MPI [1,3,9,10] – a mere 3% of nanoparticles in Resovist™ contribute to the MPI signal [1,2] – and simply do not translate very well for clinical applications. Fundamentally, MNTs are the only source of signal in MPI and as biological tissue is diamagnetic it leads to near-infinite image contrast. In practice for MPI the characteristic non-linear magnetization reversal of SPIO is excited in an AC-field to produce a time-varying inductive signal in the receive coil; further, signal localization is achieved by scanning a field-free point across the entire imaging volume. In order to optimize MPI signal, the magnetization reversal dynamics, which are governed by nanoparticle relaxation, must be tuned to the field frequency [7]. Since nanoparticle size and size distribution determine the relaxation mechanism and distribution of relaxation times [11], respectively, they must be tailored to the excitation frequency in order to optimize MPI performance. Furthermore, the optimized reversal dynamics, and thus MNT performance, must be preserved in biological environment for clinical relevance.
Here, we describe in detail the in vitro and clinically relevant in vivo MPI performance of our monodisperse MNTs. Specifically, we investigated the critical properties – blood circulation time, MPI signal per unit mass and biodistribution – that characterize MNTs suitable for in vivo applications in MPI-based angiography, and furthermore, differentiate them from commercial SPIO tracers (Resovist™). To evaluate MPI performance, we used magnetic particle spectrometry (MPS): a rapid and accurate method to assess the MPI-relevant imaging performance of MNTs, as pre-clinical and clinical scanners are still under development. In short, we demonstrate that these MNTs have appropriate physical and biological characteristics for immediate translational applications of MPI such as angiography.
To present a contextual framework for this work, in the following sections we provide a brief overview of the advantages of using MPI over traditional CT-angiography scans and summarize the physical ideas underpinning the novel method of MNT detection using MPI (comprehensive explanations can be found elsewhere [1,12]).
1.1. MPI and medical imaging
SPIOs have a history of regulatory approval and clinical use; first introduced to the clinical market in 1995, SPIO nanoparticles were used for detecting liver lesions using T2-weighted magnetic resonance imaging (MRI) [13]. In fact, Feraheme (ferumoxytol), a dextran-coated iron oxide nanoparticle formulation was approved in 2009 for treatment of iron deficiency anemia in CKD patients [14]. Due to their safe clinical history, SPIOs are also the materials of choice for development of MPI tracers. Unlike MRI, where the large magnetic moment of SPIO nanoparticles increases T2-relaxivity of nearby protons to enhance negative tissue contrast, MPI exploits the characteristic nonlinear magnetization of SPIO nanoparticles to construct high temporal (millisecond time-scales) and spatial resolution (sub-mm) images of nanoparticle distributions. Physical simulations and models [7,15,16] suggest the possibility of sub-mm resolution and nanomolar sensitivity in MPI, while experimental results [8,12] show that micromolar sensitivity and ~1 mm resolution are already attainable [1]. To approach the goal of sub-mm resolution and make MPI competitive with other tracer-based clinical imaging procedures such as x-ray CT, significant improvements in tracer design and optimization are required. Additionally, ICM agents are administered arterially using invasive/risky catheterization procedures and require high doses (3–10 ml of 320 mgI/ml iodixanol for imaging coronary arteries) to delineate narrow blood vessels from surrounding tissue. Since there is no obscuring tissue noise in MPI, the required dose of MNTs is significantly lower and MNTs with sufficient circulating times, as demonstrated here, can be safely administered intravenously.
1.2. SPIO nanoparticle detection in MPI
At room temperature and 100s measurement time, magnetite (Fe3O4) MNTs less than ~27 nm (dia.) are superparamagnetic, i.e. the net magnetic moment (m) of an ensemble of particles is thermally excited and responds nonlinearly (Figure 1a) to an external field (H) [17,18]. In MPS, a modulating (AC) excitation field, H(t), of a fixed drive frequency (typically 25 kHz) and sufficient field strength (typically μ0H ~ 40 mTp-p) to saturate MNTs is transmitted. The resulting time-varying magnetization response, m(H(t)), induces a voltage in the receive coil, which is proportional to the time derivative of magnetization, m′(H(t)) (Figure 1b) (The constants of proportionality relating m′ [Am2/s] to the measured voltage are the coil sensitivity, S [1/m], and μ0, 4π×10−7 [Vs/Am]). Figure 1c is a parametric plot of m′(H(t)) vs H(t); since this figure is unique to each tracer formulation, we call it the Particle Response Function (PRF). For a given excitation field frequency there is a single particle diameter associated with a resonant, or perfectly in-phase, magnetization response of maximum signal intensity. Thus, it is critical that the size distribution be monodisperse for the entire ensemble of nanoparticles to magnetize simultaneously. The PRF signal intensity is also linear with MNT concentration; a critical property for in vivo quantification of MNTs during real-time MPI scans.
Figure 1.
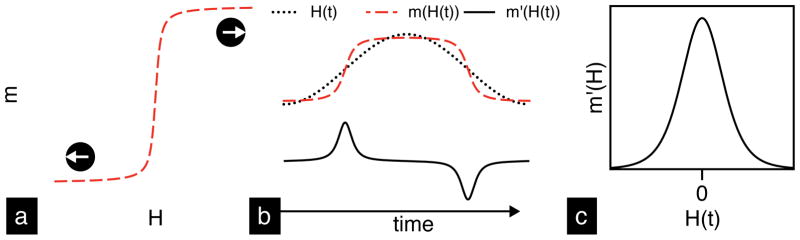
Schematic illustration of magnetic nanoparticle detection in MPS. (a) The characteristic nonlinear magnetization response of superparamagnetic nanoparticles to an applied field. (b) MPS uses an AC-field, H(t), to magnetize MNTs, m(H(t)), and induce a time-varying signal, m′(H(t)), in the receive coil. The resulting particle response function (PRF), shown in (c), is a fundamental property of MNTs.
In a 2-D or 3-D MPI scanner, a field gradient (~2–8 T/m) within the region of interest (ROI) creates a single point with zero-field called the field-free point (FFP) (see [1–3] for more details). Due to the field gradient, MNTs located in the ROI experience magnetic saturation everywhere except the FFP. Saturated MNTs do not respond to the AC-field, while MNTs within the FFP generate a time-varying signal, proportional to m′(H(t)), that reveals their location. The volume of the FFP determines the instrument’s viewing window within which MNTs are resolved in space; large field gradients result in small FFP. Together, the PRF and the field gradient strength determine the system Point Spread Function (PSF); critically, the PSF is a property of the tracer and hardware. The full width half maximum (FWHM) of the PSF is the system spatial resolution and the height is the signal intensity (in V/g Fe). To generate an image, the FFP is shifted in 3-dimensions using electromagnets and a spatial distribution of MNTs in the ROI is revealed. In the x-space approach [19], image reconstruction is achieved by a convolution of the tracer distribution and PSF; alternatively, in the fast System Matrix approach, image reconstruction is achieved through matrix inversion of system function measurements‡ [20]. In principle, MPS is a 0-dimensional MPI scanner (no field gradients) that measures the instrument-independent MNT performance, or the PRF, and enables tracer development independent of scanner development. Without an imaging scanner, tracer development for clinical applications of MPI is challenging. In this study, we adopted MPS to study the in vitro MPI performance of MNTs, and further evaluate their in vivo performance and bioavailability (circulation time) in a rodent model. Since all commercial scanners under development will operate at ~25 kHz, all our measurements were done in a 25 kHz MPS to align our optimization efforts for future clinical scanners.
2. Materials and Methods
2.1. Synthesis of magnetite (Fe3O4) MNTs
Magnetite (Fe3O4) nanoparticles were synthesized according to published methods [21,22]. The synthesis is based on pyrolysis of the Fe3+-oleate precursor with excess oleic acid surfactant in 1-octadecene. Synthesis of 17 nm nanoparticles, for instance, was achieved by thermal decomposition of 0.1 mmol Fe3+-oleate and 1.5 mmol oleic acid surfactant at a reflux temperature of 320°C for 24 hours. After synthesis, oleic acid coated MNTs were transferred from organic to aqueous phase using a PEG-ylated amphiphilic polymer [poly(maleic anhydride-alt-1 octadecene)-poly(ethylene glycol); PEG Mw ~ 5,000 Da]. Detailed synthesis, phase transfer methods and characterization results, including in vitro cytotoxicity, are discussed in previous work [23]. Resovist™, a commercial MRI-contrast agent, was acquired from Bayer Schering Pharma AG§. In addition to physical size analysis by TEM, we used the Chantrell method [24] to determine the median magnetic core diameter (DC) of the particles and its standard deviation (σ). The latter method assumes a lognormal distribution of sizes and fits the Langevin function to the room temperature magnetization curve as measured in a vibrating sample magnetometer [VSM, Lakeshore]. Hydrodynamic size was measured, both in water and in RPMI+10% FBS medium, using dynamic light scattering (DLS). Finally, the PRF of MNTs was characterized in our home-built 25 kHz magnetic particle spectrometer (MPS) using a field amplitude of 36 mTp-p (details on the design and construction of the spectrometer can be found elsewhere [8]).
For injections in mice, excess polymer and trace organic solvents were removed using sephacryl S-200 HR gel columns [GE Healthcare]. Before injecting mice, MNTs were filtered with sterile 0.2-μm syringe filters and dispersed in USP-grade 1X phosphate buffered saline (PBS) at 2 gFe/L. As-received Resovist MRI-contrast agent (~27.9 gFe/L) was also diluted to 2 gFe/L using USP-grade 1X PBS.
2.2. In vitro and in vivo studies
Female CD-1 mice [Charles River Laboratories], 25–30 grams, were used for all animal studies. Sixty-five mice were used in total, forty-five for the circulation study and twenty for biodistribution. The University of Washington’s Institutional Animal Care and Use Committee approved all animal protocols.
2.2.1. In vitro evaluation
The PRF of tracers was measured using our 25 kHz magnetic particle spectrometer in biological environments, including whole blood, RPMI+10% FBS cell culture medium and a 1-wt% agar gel, which physically immobilized MNTs.
2.2.2. In vivo circulation study
Mice were injected with 100 μl 2.0 gFe/L MNTs dispersed in 1X PBS through the tail-vein. From each mouse, approximately 100 μl of blood was drawn retro-orbitally at two time points, after which mice were euthanized. Similar data sets were obtained for the control and Resovist groups, which were injected with 100 μl 1X PBS and 2.0 gFe/L Resovist solution, respectively. Blood samples were characterized in our 25 kHz MPS (36 mTp-p), while parallel characterization in VSM was performed to compare the static (VSM) and dynamic (MPS) measurements. For MNT quantification, a series of dilutions prepared using Inductively Coupled Plasma-Optical Emission Spectrophotometer [ICP-OES, Perkin Elmer] were used to calibrate the MPS and VSM signals as a function of concentration. Whole blood samples (100 μl), extracted at various time points after tail-vein injections, were transferred in 0.5 ml Eppendorf tubes and measured directly in the MPS; no processing steps were necessary. The same samples were then transferred to polycarbonate capsules for measurements in the VSM.
2.2.3. Biodistribution
Mice were injected with either 0.5 or 2.0 gFe/L MNTs through the tail-vein. Control mice were injected with 100 μl 1X PBS. Mice were anesthetized using 5% isoflurane and maintained at 1–2% during the imaging period in the 14-tesla MRI [Bruker Biospin]. Respiration rate was monitored and maintained between 100–150 breaths/min. To acquire reference scans, all mice were imaged before injection. After injection, mice were imaged at 0.5-hour, 1-hour and 24-hour time points. T2-relaxivities (R2) of liver, spleen and kidneys were analyzed to quantify nanoparticle uptake. Following the 24-hour time point, mice were euthanized and their organs were harvested, fixed in 10% formalin and embedded in paraffin for histological analysis. Liver, spleen, kidneys, heart, lungs and brain were collected. Tissue sections were stained for iron using Prussian blue.
2.3. Imaging parameters
A 14-tesla (600 MHz) vertical bore Bruker Magnetic Resonance Spectrometer was used for imaging. To acquire a T2-map, we used Bruker’s MSME-T2 protocol: 12 echo times; TR/TE = 4,000/6.28…12 × 6.28. For iron oxide quantification, the T2-relaxivity as a function of concentration (r2 mMFe−1 s−1) was measured in 1 wt.% agar gel (Figure 2), which is often used as a tissue equivalent phantom material for measuring contrast agent relaxivity [25]. Five concentrations were used for r2 acquisition: 9.0, 17.9, 44.8, 89.5 and 179.0 μM Fe, including a 1 wt.% agarose control. For animal imaging, 25 slices, each 1-mm thick, were imaged using the sequence described above, and analyzed using ImageJ software. T2-relaxation times were calculated using the following equation:
| [1] |
where, I(t) is the MRI signal as a function of time, I0 is the initial signal and T2 (units: s) is the relaxation time required to reach 37% of the original signal (I0). The T2-relaxivity, R2 (units: s−1), is the inverse of T2 and is used to estimate MNT concentration in liver, spleen and kidneys according to the following equation:
| [2] |
where, R2MNT is the T2-relaxivity after MNT injection, R20 is T2-relaxivity before MNT injection, r2 is the T2-relaxivity as a function of concentration (units: mMFe−1 s−1) and C is MNT concentration (units: mMFe). Thus, from equation 2, MNT concentration C is given by ΔR2/r2, where ΔR2 = R2MNT – R20.
Figure 2.
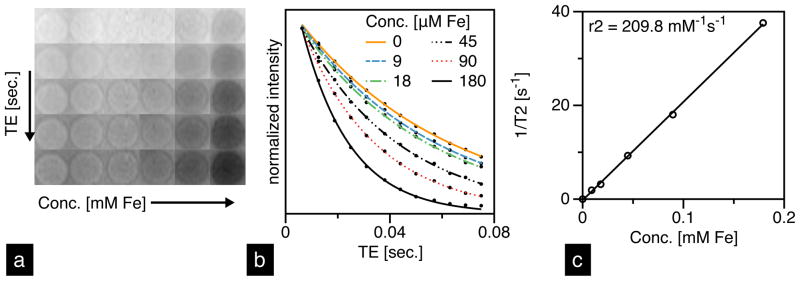
(a) T2-weighted images of UW-17 MNTs prepared at 5 concentrations in 1-wt% agar gel and (b) their corresponding intensity-decay profiles fit to equation [1]. (c) Linear fit to T2-relaxivity (1/T2) as a function of MNT concentration; slope of fit is r2 [mM−1 s−1].
The relative tissue contrast before and after injections was also used for a qualitative analysis of MNT uptake in liver, spleen and kidneys. For each organ, gray scale intensities from five randomly selected regions of interest (ROI) were measured and averaged. After 24 hours, mice were euthanized, their tissues harvested, and stained for iron using Prussian blue.
3. Results and Discussion
3.1. Characterization of MNTs
Characterization data of the two tracers is summarized in Table 1. TEM analysis of UW MNTs (labeled as UW-17; Figure 3a) yielded a median diameter (DC) of 19 nm (σ = 0.15), while Chantrell fitting of the same sample yielded core size of 17 nm (σ = 0.20); approximately 10% smaller. Magnetization measurements typically return smaller diameters than the observed TEM size, presumably due to a magnetically “dead” surface layer. Resovist, on the other hand, showed a significant discrepancy (~65%) in the core size measurements. Extensive characterization of Resovist suggests that it is composed of two size fractions: 5 nm and 24 nm particles [26]. The larger size is a result of aggregated nanoparticles that are frequently observed in TEM images of Resovist [8]. The overall size distribution of Resovist is thus bimodal and considerably broader than UW-17. Hydrodynamic size measurements in water show that the median diameter of UW-17 is 86 nm, while Resovist is 72 nm (Figure 3b).
Table 1.
Characterization data of UW-17 and Resovist MNTs.
|
DC [nm] (σ)*
|
DH [nm] | Ms [kA m−1] | MPS
|
|||
|---|---|---|---|---|---|---|
| VSM | TEM | Signal [V mgFe−1] | WFWHM | |||
| UW-17 | 17 (0.20) | 19 (0.15) | 86 | 416 (± 27) | 0.102 | 9.9 |
| Resovist | 14 (0.47) | 5 (0.37)a | 72 | 300 (± 34) | 0.048 | 12.4 |
σ is the standard deviation of the lognormal distribution
TEM characterization data from [26], which provides extensive characterization of Resovist
Figure 3.

(a) TEM image of UW-17 and its corresponding histogram (inset) with a lognormal fit. Characterization of UW-17 (solid) and Resovist (dashed) MNTs in DI water: (b) hydrodynamic size measured using DLS; (c) static magnetization response measured in VSM; (d) intensity (top) and mass (bottom) normalized PRFs measured in our 25 kHz MPS.
In addition to the tailored size and uniform size distribution, UW-17 MNTs exhibit superior magnetic properties compared to Resovist (Figure 3c); saturation magnetization (Ms) of UW-17 is nearly 88% of the bulk saturation value for magnetite (~470 kA m−1) [27], whereas Resovist is significantly lower at only 64%. Particularly, the MPI performance of UW-17, as deduced from MPS measurements, is substantially better than Resovist (Figure 3d). The PRF peak width (WFWHM) of UW-17, which determines the instrument-independent imaging resolution and depends entirely on the tracer properties, is ~20% narrower and the signal per unit mass [V mgFe−1], a critical property from a clinical dose perspective, is 2× higher than Resovist.
In our previous results [RM Ferguson et al, P Natl A Sci, submitted], we have shown that ~25 nm represents the optimum core diameter for a 25 kHz excitation frequency. In this study, however, we chose 17 nm MNTs, with a hydrodynamic diameter of 86 nm, to achieve a balance between MPI performance and pharmacokinetics. Due to strong inter-particle magnetic interactions and potential clustering of nanoparticles, hydrodynamic size of our 20 nm (and larger) MNTs is >100 nm, whereas optimal size range for improving circulation time is typically between 15 and 100 nm [28–30]. The lower and upper limits on hydrodynamic size are a result of physiological constraints; the lower limit set by the size of kidney fenestrae (~15 nm), and the upper limit by the size of sinusoidal capillaries in the liver and spleen (~50–180 nm) [31], which comprise the reticuloendothelial system (RES). Thus, particles smaller than 15 nm, and most molecular contrast agents such as ICM and Gadolinium-chelates are swiftly cleared through the kidneys, while particles larger than ~100 nm are rapidly sequestered in the RES. For effective MPI blood-pool imaging that uses a low tracer dose and does not require invasive catheterization, tracers that demonstrate both, optimal MPI performance and blood circulation characteristics are required. In the current study, UW-17 MNTs demonstrate significant improvements in MPI performance over Resovist while also exhibiting a comparable hydrodynamic size (Table 1). We are currently optimizing our phase transfer process to minimize nanoparticle clustering; these improvements will enable use of ~25 nm core and ~30–50 nm hydrodynamic diameter MNTs, which demonstrate both, excellent MPI performance and long circulation times.
3.2. In vitro tracer evaluation
In vitro evaluation of MPS performance proved critical to understanding MNT relaxation behavior in biological environments, and thus predicting their in vivo MPI performance. Blood and cell-culture medium are rich in serum proteins and simulate the angiography environment, while agar gel simulates nanoparticle immobilization in tissues. We observed clear differences in the PRF of UW-17 and Resovist MNTs (Figure 4) relative to their corresponding PRFs in DI water. UW-17 MNTs showed no loss in MPS signal when dispersed in either blood or RPMI+10%FBS cell-culture medium, while in 1-wt% agar gel, the signal decreased marginally (~8%). Resovist, on the other hand, showed an 8% signal loss in blood, and significant loss in cell-culture medium (53%), and 1-wt% agar gel (74%).
Figure 4.

In vitro MPS characterization of UW-17 MNTs (left) showed nearly no change in PRF in various biological media unlike Resovist (right).
The differences in magnetization reversal, and thus MPS performance, of UW-17 and Resovist are governed in general by two relaxation mechanisms: Néel and Brownian relaxation; each defined by a time constant τN and τB, respectively. Néel relaxation occurs by rotation of the magnetization vector inside the particle; thus it is independent of changes in the surrounding environment. The time constant τN is expressed by the Arrhenius equation:
| [3] |
where τ0 is the attempt time typically in the range of 10−11–10−9 seconds [32]; kB [1.38 × 10⁻²³ J K−1] is Boltzmann’s constant; T [K] is the absolute temperature and ΔE [ J], expressed as KVC(1−h)2, is the energy barrier to achieve magnetization reversal – it depends on the anisotropy constant K [Jm−3], a material property of either magnetocrystalline or shape origin; the core volume VC [m3]; and the reduced field h = H/HK, where HK is the internal anisotropy field. Thus, Néel relaxation depends primarily on the MNT core properties and the field amplitude. Brownian relaxation, on the other hand, involves physical rotation of the entire particle; thus it is sensitive to changes in hydrodynamic size and fluid viscosity that add resistance to rotation. The time constant τB is given by:
| [4] |
where η [Pa.s] is the carrier fluid’s viscosity and VH [m3] is the hydrodynamic volume. During circulation, nanoparticles often undergo opsonization – protein absorption to surface – that slows Brownian relaxation due to increase in VH. Furthermore, uptake in tissues can immobilize nanoparticles and physically impede Brownian relaxation. Thus, to prevent signal loss, Brownian contribution to magnetization reversal must be minimized. Our results indicate that magnetization reversal in UW-17 MNTs is independent of changes in surrounding media, and thus predominantly Néel, whereas Resovist has a significant contribution from Brownian relaxation.
3.3. In vivo circulation study
To test the in vivo MPI performance of tracers, we injected CD-1 mice with 100 μl-2.0 gFe/L of either UW-17 or Resovist via the tail-vein, and measured the MPS signal from blood samples collected at various time intervals. Calibration curves (Figure 5) showed that the signal was linear with concentration in both MPS and VSM measurements. Thus, they were used to quantify the raw MNT signal (Figure 6), which was normalized to mouse body weight (in kg) and plotted as a function of time (Figure 7). Our results highlight key features that distinguish the in vivo performance of MPI-tailored MNTs (UW-17) from traditional SPIO contrast agents (Resovist). First, as UW-17 MNTs are cleared from circulation, the MPS signal, defined by the PRF peak-height (Figure 6b), decreases with time; it takes ~5 minutes for the signal to reach half its initial detected value, and nearly 15 minutes to reach the noise floor (Figure 7a). On the other hand, MPS signal from Resovist nanoparticles is considerably low and nearly absent past 5 minutes of circulation (Figure 7b). The increase in signal detected at 5 minutes suggests that the injected bolus takes 0–5 minutes for uniform distribution, and is subsequently cleared from circulation. Second, unlike Resovist, UW-17 shows notable agreement between MPS (f = 25 kHz) and VSM (f ≈ 1.6 × 10⁻⁶ kHz) measurements. The latter leads us to conclude that the circulating UW-17 MNTs are superparamagnetic, as confirmed in the static VSM measurement, but more importantly are also MPI-capable. Resovist MNTs are detected in VSM, but not at the same scale in MPS, which suggests that though nanoparticles circulate, only a fraction of Resovist MNTs are MPI-capable; indeed, the inventors of MPI hypothesized that only 3% of Resovist contributes to MPI [1].
Figure 5.

The (a) MPS and (c) VSM signals of UW-17 MNTs are linear as a function of concentration, (b) and (d) respectively.
Figure 6.

VSM and MPS measurements of blood drawn retro-orbitally, collected at different time points, from mice injected with UW-17 (a & b) and Resovist (c & d) MNTs
Figure 7.

(a) UW-17 and (b) Resovist concentration in mouse blood (average of three runs) as a function of time.
There are several factors that affect circulation time of nanoparticles, including hydrodynamic size, surface coating and charge, and opsonization dynamics [28]. While it is important that the properties affecting circulation time of MNTs are optimized, it is also critical that the physical properties optimizing MPI response are preserved. Our in vitro study shows that the MPI response of UW-17 is predominantly governed by Néel relaxation; thus independent of changes in the environment and preserved in vivo. We anticipate further improvement in circulation time will entail simultaneous optimization of the surface coating and the core. For instance, decreasing hydrodynamic size to 30–50 nm, while maintaining colloidal stability in biological media, will prolong circulation time and enable use of 20 nm (or larger) MNTs that show excellent MPI performance.
3.4. Biodistribution
MNTs designed for MPI are tailored precisely by controlling size to respond optimally to an applied frequency. As a result, we utilized the well-established [21,22] high temperature pyrolysis of Fe(III)-oleate in organic solvents approach; it offers exceptional control over nanoparticle size and size distribution. The resulting MNTs are hydrophobic, and subsequently transferred to water phase using a PEG-based amphiphilic polymer. Since there is no clinical history of iron oxide nanoparticles synthesized in organic solvents, we performed a preliminary study to determine the biodistribution of UW-17 MNTs using a rodent model.
For qualitative biodistribution analysis, we compared the relative MRI contrast from axial slices across the abdomen (Figure 8a–c), and the rate of MRI-signal decay (T2-relaxivity) was used for quantitative analysis (Figure 8d & e). It should be noted that the MRI signal from mice dosed at 2.0 gFe/L UW-17 was quenched (Figure 8e), suggesting a high degree of MNT uptake in the liver. Since the quenched signal is difficult to quantify, we included an additional group of mice that was administered a 75% lower dose (0.5 gFe/L). At 0.5 hours post-injection, both groups (0.5 gFe/L: Figure 8b, and 2.0 gFe/L: Figure 8c) showed an increase in relative contrast in the liver and spleen, while contrast in kidneys was similar to pre-injection state. At the 24-hour end-point, we observed a substantial signal recovery to pre-injection levels in the 0.5 gFe/L group (Figure 8b) – suggesting MNT digestion through metabolic pathways in the liver and spleen – while the 2.0gFe/L group showed only marginal recovery (Figure 8c). Quantitative analysis of the 0.5 gFe/L-group supported the qualitative assessment (Table 2): from 0.5 to 24 hours, ΔR2 decreases 58.6% (42.3 s−1 to 17.5 s−1) in the liver and 54.8% (10.4 s−1 to 4.7 s−1) in the spleen. Kidney ΔR2, in comparison, decreases by a significant 84.8% (6.6 s−1 to 1.0 s−1) from 0.5 hours to 24 hours. After 0.5 hours post-injection, there was a 21.9% increase (ΔR2 = 6.6 s−1 ) ins kidney R2 value, which indicates MNTs are still circulating. However, the difference in R2 values (ΔR2 = 1.0 s−1) s between pre-injection and 24 hours post-injection is less than the 5% variability in signal measurement, thus negligible. Quantitative analysis of the 2.0 gFe/L group is summarized in Table 3; liver signal in the 2.0 gFe/L group was quenched and thus not quantifiable. However, signal in the spleen was quantified and showed an increase in ΔR2 from 0.5 hours to 24 hours post-injection, suggesting continued nanoparticle uptake till the 24-hour endpoint. Histological analysis (Figure 9) of tissue sections stained with Prussian blue further confirms MRI analysis – MNTs accumulate primarily in the liver and spleen. In summary, preliminary safety assessment of our tracers is promising, since biodistribution and clearance routes are analogous to clinically approved SPIO contrast agents (Feridex and Resovist) that are cleared via the RES [33] with no long-term renal involvement.
Figure 8.

Image analysis of mice injected with (a) 1X PBS, (b) 0.5 gFe/L and (c) 2.0 gFe/L UW-17 MNTs; relative contrast in T2-weighted images (TE = 6.28 ms) is the ratio of gray intensity value in ROI relative to the vertebrae in the same slice. (d & e) T2-plots for measuring change in relaxivity (ΔR2) were used to quantitatively determine MNT uptake in liver, spleen and kidney.
Table 2.
Relaxivities of liver, spleen and kidney before and after injection with 100-μl 0.5 gFe/L UW-17 MNTs. Equation 2 was used to estimate MNT concentration
|
R20 [s−1] pre-MNT |
R2MNT [s−1]
|
ΔR2 = R2MNT-R20 [s−1]
|
C [uMFe]
|
||||
|---|---|---|---|---|---|---|---|
| t=0.5h | t=24h | t=0.5h | t=24h | t=0.5h | t=24h | ||
| Liver | 65.9 | 108.2 | 83.4 | 42.3 | 17.5 | 201.6 | 83.4 |
| Kidney | 30.1 | 36.7 | 31.1 | 6.6 | 1 | 31.5 | 4.8 |
| Spleen | 40.4 | 50.8 | 45.1 | 10.4 | 4.7 | 49.6 | 22.4 |
Table 3.
Relaxivities of liver, spleen and kidney before and after injection with 100-μl 2.0 gFe/L UW-17 MNTs.
|
R20 [s−1] pre-MNT |
R2MNT[s−1]
|
ΔR2 = R2MNT-R20 [s−1]
|
C [uMFe]
|
||||
|---|---|---|---|---|---|---|---|
| t=0.5h | t=24h | t=0.5h | t=24h | t=0.5h | t=24h | ||
| Liver | 76.2 | -a | -a | -a | -a | -a | -a |
| Kidney | 33.8 | 31.2 | 32.3 | −2.6 | −1.5 | -b | -b |
| Spleen | 52.4 | 53.8 | 67.1 | 1.4 | 14.7 | 6.7 | 69.6 |
T2-fit not possible due to quenched signal (see plot for liver in Figure 8e)
ΔR2 values negative
Figure 9.
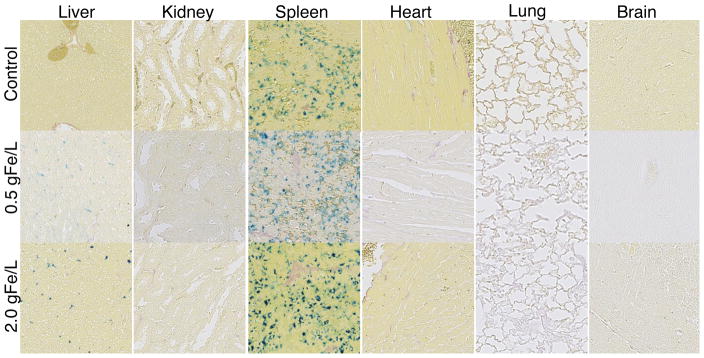
Tissue sections collected 24 hours post-injection and stained with Prussian blue (20× magnification). Control group was injected with 1x PBS. Note the naturally high concentration of ferric iron in the spleen control makes qualitative comparison between control and MNT group difficult.
4. Conclusion
MPI is a new imaging modality that is the first to truly exploit nanoscale magnetic properties of SPIOs. However, existing commercial SPIO tracers perform sub-optimally and hinder its clinical translation. Our monodisperse MNTs (UW-17) – synthesized in non-aqueous solvents and subsequently transferred to aqueous phase using a PEG-based amphiphilic polymer – showed 2-fold greater signal per unit mass and 20% better spatial resolution than a commercial SPIO agent (Resovist) in a 25 kHz MPS. In vitro tracer evaluation showed that the MPI response of UW-17 MNTs, unlike Resovist, was independent of changes in hydrodynamic size and the carrier fluid’s viscosity – a critical feature that ensures the MPI performance will be preserved in the physiological environment. Furthermore, in vivo circulation time of UW-17 in mice, as measured in our MPS (f = 25 kHz), was 3× longer than Resovist and showed excellent agreement with the corresponding static (VSM: f ≈ 1.6 × 10⁻⁶ kHz) measurement. The latter confirmed that the circulating UW-17 MNTs are MPI-capable in vivo, while Resovist MNTs though circulating, are unsuitable for MPI. The biodistribution of UW-17 MNTs in mice was similar to clinically approved SPIO agents, primarily distributing in the liver and spleen. Further improvements in phase transfer and surface coatings will facilitate the synthesis of larger core MNTs (>20 nm dia.) with hydrodynamic diameter below 100 nm, which will enable synthesis of long-circulating MNTs that are truly optimized for MPI. Such long circulating optimized nanoparticles show promise as angiography tracers and blood-pool agents for the emerging MPI imaging modality.
Acknowledgments
This work was supported by NIH grants 1R01EB013689-01/NIBIB and 1R41EB013520-01, NSF grant IIP-1215556, a UW/CGF commercialization grant and a Commercialization Fellowship (RMF). Part of this work was conducted at the University of Washington NanoTech User Facility, a member of the NSF National Nanotechnology Infrastructure Network (NNIN).
Footnotes
Since MPI is truly a tracer-imaging technology, we refer to SPIO nanoparticles associated with MPI as magnetic nanoparticle tracers (MNTs) rather than contrast agents.
The system function measurement maps the particle response to the frequency in the field of view. The data is stored in frequency-space, which is then inverted in real-space for image reconstruction.
Production of Resovist was discontinued in 2009.
Publisher's Disclaimer: This is a PDF file of an unedited manuscript that has been accepted for publication. As a service to our customers we are providing this early version of the manuscript. The manuscript will undergo copyediting, typesetting, and review of the resulting proof before it is published in its final citable form. Please note that during the production process errors may be discovered which could affect the content, and all legal disclaimers that apply to the journal pertain.
References
- 1.Gleich B, Weizenecker J. Tomographic imaging using the nonlinear response of magnetic particles. Nature. 2005;435(7046):1214–7. doi: 10.1038/nature03808. [DOI] [PubMed] [Google Scholar]
- 2.Weizenecker J, Gleich B, Rahmer J, Dahnke H, Borgert J. Three-dimensional real-time in vivo magnetic particle imaging. Phys Med Biol. 2009;54(5):L1–L10. doi: 10.1088/0031-9155/54/5/L01. [DOI] [PubMed] [Google Scholar]
- 3.Goodwill PW, Saritas EU, Croft LR, Kim TN, Krishnan KM, Schaffer DV, et al. X-space MPI: magnetic nanoparticles for safe medical imaging. Adv Mater. 2012;24(28):3870–7. doi: 10.1002/adma.201200221. [DOI] [PubMed] [Google Scholar]
- 4.Katzberg RW, Haller C. Contrast-induced nephrotoxicity: clinical landscape. Kidney Int. 2006;69:S3–S7. doi: 10.1038/sj.ki.5000366. [DOI] [PubMed] [Google Scholar]
- 5.Ix JH, Mercado N, Shlipak MG, Lemos PA, Boersma E, Lindeboom W, et al. Association of chronic kidney disease with clinical outcomes after coronary revascularization: the arterial revascularization therapies study (ARTS) Am Heart J. 2005;149(3):512–9. doi: 10.1016/j.ahj.2004.10.010. [DOI] [PubMed] [Google Scholar]
- 6.Bettmann MA. Frequently asked questions: iodinated contrast agents. Radiographics. 2004;24(suppl_1):S3–S10. doi: 10.1148/rg.24si045519. [DOI] [PubMed] [Google Scholar]
- 7.Ferguson RM, Minard KR, Krishnan KM. Optimization of nanoparticle core size for magnetic particle imaging. J Magn Magn Mater. 2009;321(10):1548–51. doi: 10.1016/j.jmmm.2009.02.083. [DOI] [PMC free article] [PubMed] [Google Scholar]
- 8.Ferguson RM, Khandhar AP, Krishnan KM. Tracer design for magnetic particle imaging (invited) J Appl Phys. 2012;111(7):07B318. doi: 10.1063/1.3676053. [DOI] [PMC free article] [PubMed] [Google Scholar]
- 9.Ferguson RM, Minard KR, Khandhar AP, Krishnan KM. Optimizing magnetite nanoparticles for mass sensitivity in magnetic particle imaging. Med Phys. 2011;38(3):1619–26. doi: 10.1118/1.3554646. [DOI] [PMC free article] [PubMed] [Google Scholar]
- 10.Krishnan KM. Biomedical nanomagnetics: a spin through possibilities in imaging, diagnostics, and therapy. IEEE T Magn. 2010;46(7):2523–58. doi: 10.1109/TMAG.2010.2046907. [DOI] [PMC free article] [PubMed] [Google Scholar]
- 11.Fannin PC. Investigating magnetic fluids by means of complex susceptibility measurements. J Magn Magn Mater. 2003;258–259:446–51. [Google Scholar]
- 12.Goodwill PW, Tamrazian A, Croft LR, Lu CD, Johnson EM, Pidaparthi R, et al. Ferrohydrodynamic relaxometry for magnetic particle imaging. Appl Phys Lett. 2011;98(26):262502. [Google Scholar]
- 13.Mitchell DG. MR imaging contrast agents - what’s in a name? J Magn Reson Im. 1997;7(1):1–4. doi: 10.1002/jmri.1880070102. [DOI] [PubMed] [Google Scholar]
- 14.Lu M, Cohen MH, Rieves D, Pazdur R. FDA report: Ferumoxytol for intravenous iron therapy in adult patients with chronic kidney disease. Am J Hematol. 2010;85:315–9. doi: 10.1002/ajh.21656. [DOI] [PubMed] [Google Scholar]
- 15.Weizenecker J, Borgert J, Gleich B. A simulation study on the resolution and sensitivity of magnetic particle imaging. Phys Med Biol. 2007;52(21):6363–74. doi: 10.1088/0031-9155/52/21/001. [DOI] [PubMed] [Google Scholar]
- 16.Knopp T, Biederer S, Sattel TF, Erbe M, Buzug TM. Prediction of the spatial resolution of magnetic particle imaging using the modulation transfer function of the imaging process. IEEE T Med Imaging. 2011;30(6):1284–92. doi: 10.1109/TMI.2011.2113188. [DOI] [PubMed] [Google Scholar]
- 17.Krishnan KM, Pakhomov AB, Bao Y, Blomqvist P, Chun Y, Gonzales M, et al. Nanomagnetism and spin electronics: materials, microstructure and novel properties. J Mater Sci. 2006;41(3):793–815. [Google Scholar]
- 18.Bedanta S, Kleemann W. Supermagnetism. J Phys D: Appl Phys. 2009;42(1):013001. [Google Scholar]
- 19.Rahmer J, Weizenecker J, Gleich B, Borgert J. Signal encoding in magnetic particle imaging: properties of the system function. BMC Med Imaging. 2009;9(1):4. doi: 10.1186/1471-2342-9-4. [DOI] [PMC free article] [PubMed] [Google Scholar]
- 20.Goodwill PW, Conolly SM. The x-space formulation of the magnetic particle imaging process: 1-d signal, resolution, bandwidth, SNR, SAR, and magnetostimulation. IEEE T Med Imaging. 2010;29(11):1851–9. doi: 10.1109/TMI.2010.2052284. [DOI] [PubMed] [Google Scholar]
- 21.Jana NR, Chen Y, Peng X. Size- and shape-controlled magnetic (Cr, Mn, Fe, Co, Ni) oxide nanocrystals via a simple and general approach. Chem Mater. 2004;16(20):3931–5. [Google Scholar]
- 22.Kalele S, Narain R, Krishnan KM. Probing temperature-sensitive behavior of pNIPAAm-coated iron oxide nanoparticles using frequency-dependent magnetic measurements. J Magn Magn Mater. 2009;321(10):1377–80. [Google Scholar]
- 23.Khandhar AP, Ferguson RM, Simon JA, Krishnan KM. Tailored magnetic nanoparticles for optimizing magnetic fluid hyperthermia. J Biomed Mater Res. 2011;100A(3):728–37. doi: 10.1002/jbm.a.34011. [DOI] [PMC free article] [PubMed] [Google Scholar]
- 24.Chantrell RW, Popplewell J, Charles SW. Measurements of particle size distribution parameters in ferrofluids. IEEE T Magn. 1978;14(5):975–7. [Google Scholar]
- 25.Mitchell MD, Kundel HL, Axel L, Joseph PM. Agarose as a tissue equivalent phantom material for NMR imaging. Magn Reson Imaging. 1986;4(3):263–6. doi: 10.1016/0730-725x(86)91068-4. [DOI] [PubMed] [Google Scholar]
- 26.Eberbeck D, Wiekhorst F, Wagner S, Trahms L. How the size distribution of magnetic nanoparticles determines their magnetic particle imaging performance. Appl Phys Lett. 2011;98(18):182502. [Google Scholar]
- 27.Cornell RM, Schwertmann U. The iron oxides: structure, properties, reactions, occurrences and uses. Weinheim, Germany: VCS Verlagsgesellschaft; 1996. [Google Scholar]
- 28.Almeida JPM, Chen AL, Foster A, Drezek R. In vivo biodistribution of nanoparticles. Nanomedicine. 2011;6(5):815–35. doi: 10.2217/nnm.11.79. [DOI] [PubMed] [Google Scholar]
- 29.Albanese A, Tang PS, Chan WCW. The effect of nanoparticle size, shape, and surface chemistry on biological systems. Annu Rev Biomed Eng. 2012;14(1):1–16. doi: 10.1146/annurev-bioeng-071811-150124. [DOI] [PubMed] [Google Scholar]
- 30.Alexis F, Pridgen E, Molnar LK, Farokhzad OC. Factors affecting the clearance and biodistribution of polymeric nanoparticles. Mol Pharm. 2008;5(4):505–15. doi: 10.1021/mp800051m. [DOI] [PMC free article] [PubMed] [Google Scholar]
- 31.Sarin H. Physiologic upper limits of pore size of different blood capillary types and another perspective on the dual pore theory of microvascular permeability. J Angiogenes Res. 2010;2:14. doi: 10.1186/2040-2384-2-14. [DOI] [PMC free article] [PubMed] [Google Scholar]
- 32.Brown W. Thermal fluctuations of a single-domain particle. Phys Rev. 1963;130(5):1677–86. [Google Scholar]
- 33.Reimer P, Balzer T. Ferucarbotran (Resovist): a new clinically approved RES-specific contrast agent for contrast-enhanced MRI of the liver: properties, clinical development and applications. Eur Radiol. 2003;13:1266–76. doi: 10.1007/s00330-002-1721-7. [DOI] [PubMed] [Google Scholar]