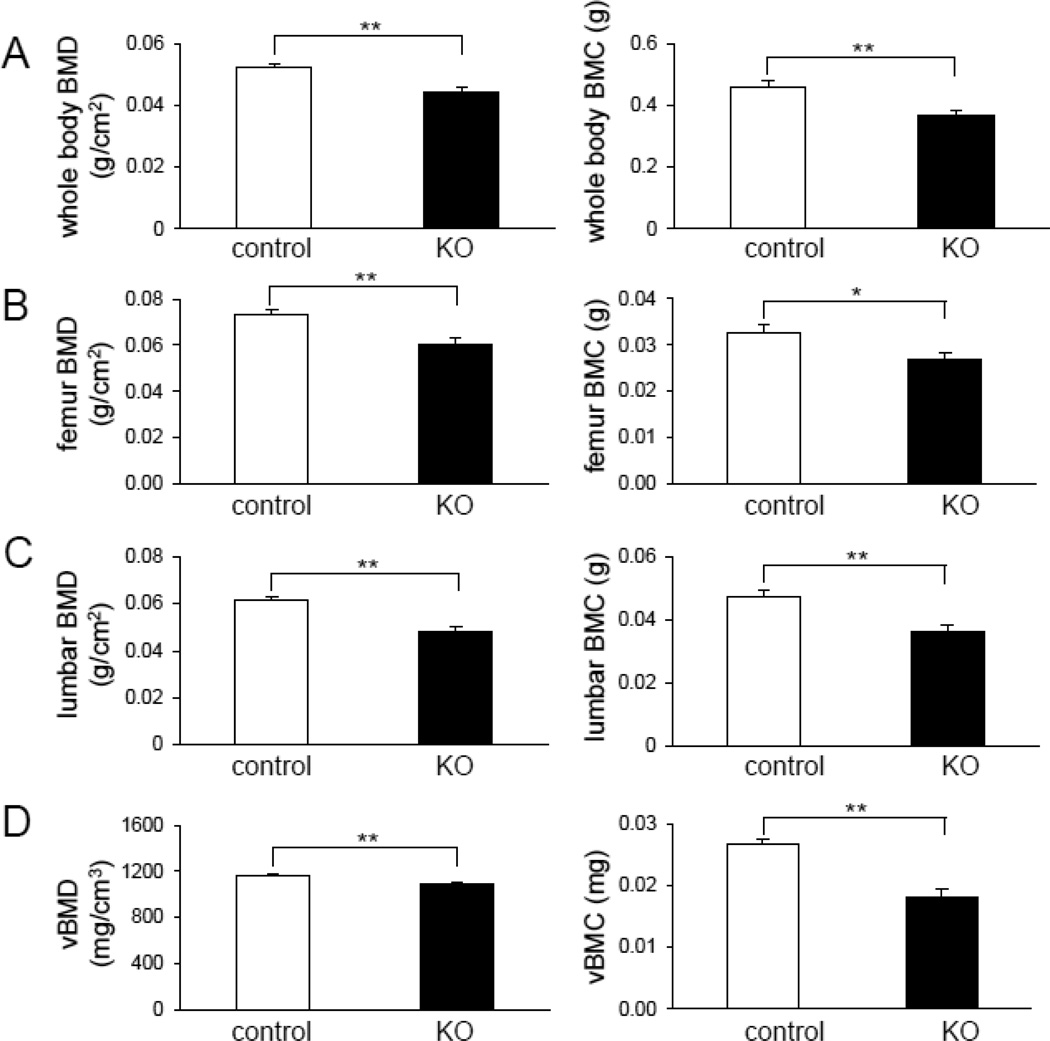
Fig. 4.
Effect of Lrp5 deficiency in osteocytes on bone mass. (A) Graphs depicting whole-body BMD (left) and BMC (right) in 16-week-old mice homozygous for floxed Lrp5 allelles, in the absence or presence of the Dmp1-Cre transgene (Lrp5f/f and Lrp5−/−, respectively). (B) Graphs depicting right femoral BMD (left) and BMC (right) in 16-week-old mice homozygous for floxed Lrp5 allelles, in the absence or presence of the Dmp1-Cre transgene (Lrp5f/f and Lrp5−/−, respectively). (C) Graphs depicting lumbar BMD (left) and BMC (right) in 16-week-old mice homozygous for floxed Lrp5 allelles, in the absence or presence of the Dmp1-Cre transgene (Lrp5f/f and Lrp5−/−, respectively). (D) Graphs depicting volumetric BMD (left) and BMC (right) of the femoral middle shaft in 16-week-old mice homozygous for floxed Lrp5 allelles, in the absence or presence of the Dmp1-Cre transgene (Lrp5f/f and Lrp5−/−, respectively). n=9 for control and n=5 for KO mice. The error bars show means ± s.e.m. The single, *, and double asterisks, **, indicate p < 0.05 and p < 0.01, respectively.

