Control for confounding is crucial in causal observational studies. However, the modelling of continuous confounders has not received much attention. This is probably because in causal research the focus is on a single factor (i.e., the exposure of interest), and confounders are merely considered as nuisance. In contrast, diagnostic or prognostic prediction research focuses on the combined effect of multiple predictors, each of which is modelled as accurately as possible.1–4 The lack of attention for modelling confounders in causal research is reflected in the limited, if any, reporting on the adjustment model in observational studies on causality.5,6
However, modelling of continuous confounders is not always straightforward, and incorrect adjustment for confounders can result in considerable residual confounding.7–10 For example, when body temperature is a confounder of a certain association, and the association between body temperature and the outcome is not linear, but, for example, U- or J-shaped, the assumption of a linear relation between the confounder and outcome can result in substantial residual confounding.11,12 Or even worse, one can simply adjust for confounding by stratification on dichotomized body temperature (e.g., fever yes/no). Although this makes the adjustment for confounding easier, it likely results in inadequate control of confounding (i.e., residual confounding).1,13
In this paper, we review the current practice in the reporting of adjustment for continuous confounders and show the impact on residual confounding of different methods to control for continuous confounders. We use data from 2 empirical datasets on the effect of influenza vaccination on death and the effect of smoking on cardiovascular death.
Systematic review of the reporting of confounding adjustment
To assess current practice in the reporting of confounding adjustment, we reviewed publications on original research published October through December 2011 in high-impact general medical journals (The New England Journal of Medicine, The Lancet, The Journal of the American Medical Association, Annals of Internal Medicine, PLOS Medicine, BMJ and CMAJ). We included all original nonrandomized studies and excluded reviews, studies on cost-effectiveness and studies evaluating the effects of genetic mutations. We focused on adjustment for the continuous confounder age.
We identified 53 papers. Adjustment for confounding was performed in all studies, and in 49 (92%) studies the results were adjusted for the confounder age. In most of these (40/49, 82%), age was included as a covariate in a regression model (e.g., Cox or logistic model). For 4 of these models, the authors explicitly described that age was included in the model as a linear or quadratic term, whereas in 7 studies age was included in the adjustment model as a categorized variable. In 2 studies, fractional polynomials were applied to model the age–outcome relation. In the other 27 studies (27/40, 68%) that applied a regression model, it was unclear how the relation between age and the outcome was modelled. Other methods used to control for confounding by age were matching, standardization and including age as the time-axis in a Cox model.
Controlling for continuous confounders
We illustrate methods to control for continuous confounders using empirical data of 2 cohorts on (1) the effects of influenza vaccination on death and (2) the effects of different cardiovascular risk factors on cardiovascular death. The continuous confounders that were considered in these studies were use of health care and age, which showed an approximate linear and quadratic relation with the outcome, respectively.
Clinical examples
The first observational cohort was set up to study the effects of influenza vaccination on risk of death among elderly people living in the community.14 We selected 20 000 participants aged 65–90 years. An important confounder (among others) of the association between influenza vaccination and death was use of health care, which is related to an increased risk of death as well as an increased probability of receiving a vaccination. Use of health care was defined as the number of contacts with general practitioners in the 12 months before influenza vaccination and can be considered as a proxy measure for health status. In this case, use of health care was a continuous variable.
The second cohort comprised patients enrolled in the Second Manifestations of Arterial disease (SMART) study, which is an ongoing prospective cohort study of patients with manifest vascular disease of vascular risk factors.15 From 1996 onwards, patients aged 18–80 years who were newly referred to the University Medical Center Utrecht, in the Netherlands, were followed up. We selected 1500 records to study the relation between active smoking status at cohort entry and cardiovascular death. In this study, age (among others) is an important confounder of this relation, because age is a risk factor for cardiovascular death and the prevalence of smoking changes with age.
Analyses
For all analyses, we used R for Windows, version 2.13.1.16 In the cohort studies described above, the outcome was binary, and we used logistic regression to analyze the association between exposure and outcome. We estimated a crude (unadjusted) association between exposure and outcome. We adjusted for confounding by including the confounder age in the regression model in the following ways. First, we dichotomized age at the median value of the continuous confounder and included age as a dichotomous variable in the adjustment model. Second, we categorized age in 5 categories (based on quintiles of the continuous confounder) and included it in the regression model as a categorical variable.17 Third, we included age as a continuous covariate in the regression model. Fourth, we applied fractional polynomials and restricted cubic splines, which are both methods that more flexibly model the relation between continuous variables and an outcome. In both methods, a smooth nonlinear relation between the continuous confounder and outcome is modelled by including not only the linear form of the continuous confounder, but also other powers (e.g., square root or quadratic terms).3,11,12 In the case of fractional polynomials, the relation between the continuous confounder and the outcome is modelled for the whole range of values of the confounder.11,12 When applying restricted cubic splines, the range of the confounder values is first split up in parts, based on the number of so-called knots (typically 5).3 Then, for each part, the relation between the confounder and the outcome is modelled using the linear form of the continuous confounder as well as other powers. We used the functions mfp() and fp() from the library mfp18 to fit the fractional polynomials and the function rcspline.eval() from the library Hmisc19 to fit restricted cubic splines. To visually evaluate the functional form of the relation between age and the outcomes, we used the function rcspline.plot() from the library Hmisc.19 This graphically shows the relation between the continuous confounder and the log(odds) of the outcome.
Results
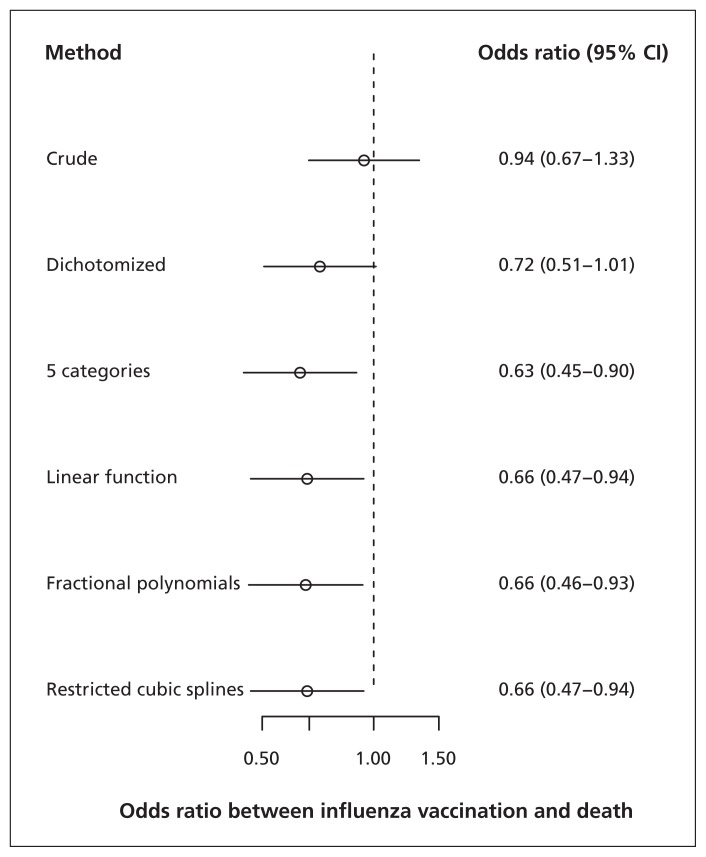
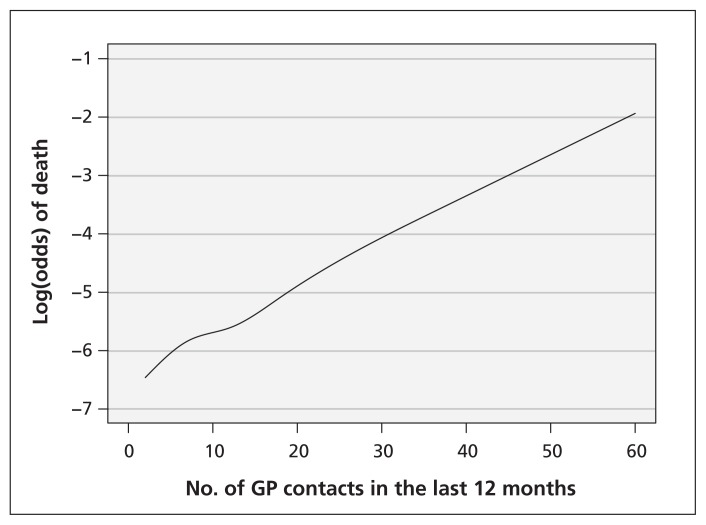
In the study of influenza vaccination on risk of death, adjustment for the continuous confounder use of health care by including it as a continuous covariate in the model yielded substantial change in the odds ratio (OR) of influenza vaccination (crude OR 0.94 v. adjusted OR 0.66). Use of fractional polynomials yielded similar results as use of restricted cubic splines or modelling a linear relation between confounder and outcome (Figure 1). The reason for this was that the functional relation between the continuous confounder use of health care and death was indeed close to linear, as suggested by the graphical presentation of the relation (Figure 2). Adjustment for use of health care after dichotomization yielded an effect estimate (OR 0.72, 95% confidence interval [CI] 0.51–1.01) that was closer to the crude than the estimates obtained by the other methods, suggesting the presence of residual confounding when the continuous confounder was included as a dichotomous variable in the adjustment model.
Figure 1:
Comparison of methods to model the relation between a continuous confounder (use of health care) and outcome (death) in a study of influenza vaccination. Use of health care was defined as the number of contacts with general practitioners in the 12 months before the influenza vaccination. Use of health care was dichotomized at the median (i.e., 12 contacts in the 12 months before the vaccination). Use of health care was divided into 5 categories based on quintiles; cut-values were 5, 9, 14 and 22 contacts in the 12 months before the vaccination. CI = confidence interval.
Figure 2:
Functional relation between the continuous confounder use of health care and death in a study of influenza vaccination. GP = general practitioner.
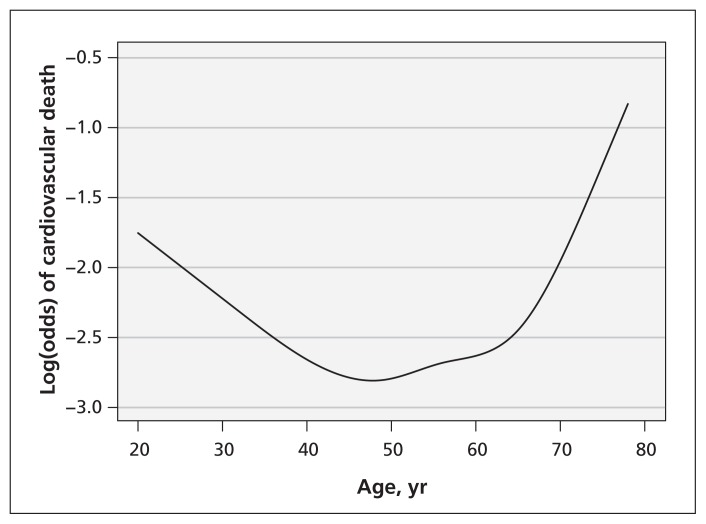
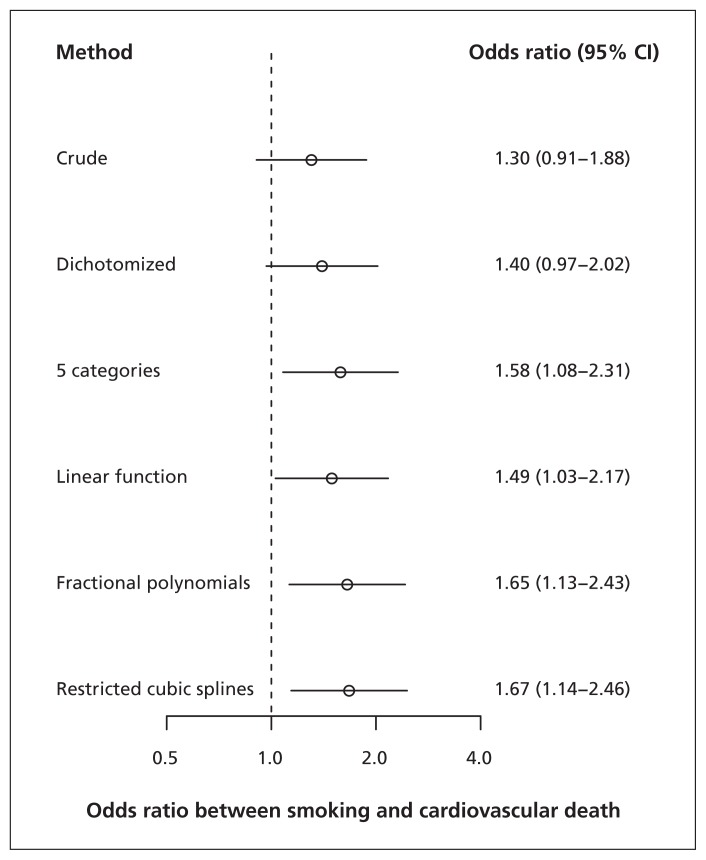
In the study of the effect of smoking on cardiovascular death, the relation between the continuous confounder age and cardiovascular death was not linear, but appeared quadratic (Figure 3). Consequently, the estimated effect of smoking on cardiovascular death differed considerably between the different methods to adjust for the continuous confounder. For example, when adjusting for the dichotomized confounder, the estimated OR was 1.40 (95% CI 0.97–2.02). When including the continuous confounder as a linear term in the adjustment model, this value increased to OR 1.49 (95% CI 1.03–2.17) and even to 1.67 (95% CI 1.14–2.46) when applying restricted cubic splines (Figure 4).
Figure 3:
Functional relation between the continuous confounder age and cardiovascular death in a study of cardiovascular risk factors.
Figure 4:
Comparison of methods to model the relation between a continuous confounder (age) and outcome (cardiovascular death) in a study of cardiovascular risk factors (notably smoking). Age was dichotomized at the median (i.e., 56 yr). Age was divided into 5 categories based on quintiles; cut-values were 45, 53, 60 and 68 years. CI = confidence interval.
In both examples, controlling for confounding by first categorizing the continuous confounder in 5 categories and subsequently stratifying on those categories yielded similar (first example) or almost similar (second example) estimates as the technically more demanding methods fractional polynomials and restricted cubic splines. In both examples, however, including the continuous confounder as a dichotomous variable in the adjustment model lead to estimates that were close to the results from the crude (unadjusted) analysis.
Discussion
The studies presented here illustrate that dichotomizing a continuous confounder can result in considerable residual confounding. Also, when the relation between a continuous confounder and the outcome is not linear, but, for example, quadratic (as in the example of the effect of smoking on cardiovascular death), assuming a linear relation between the confounder and outcome can lead to important residual confounding. Control for confounding by continuous variables can probably be achieved by stratification in 5 strata, fractional polynomials and restricted cubic splines, which yielded similar results in our clinical examples.
Confounding can be controlled for in the design or analysis of an observational study.20 When confounding is controlled for in the analysis, this is typically done by including confounders as covariates in, for example, a multivariable regression model. One key problem is confounders that are unobserved, which makes adjustment impossible. A much more subtle problem is confounders that are actually observed, but that are incorrectly adjusted for. Choosing the incorrect transformation to model continuous confounders may then inadequately control for confounding by those variables and hence result in residual confounding.7–13 The impact of incorrect modelling of a continuous confounder depends on (among others) the strength of the association between the confounder and both the exposure and the outcome, the distribution of the continuous confounder and which other confounders are also adjusted for. Furthermore, the impact of incorrectly assuming a linear relation between confounder and outcome depends on the extent of departure from linearity. In the study of the effect of smoking on cardiovascular death, the relation between confounder and outcome appeared quadratic rather than linear, and modelling a linear relation indeed resulted in considerably different estimates compared with the results based on fractional polynomials and restricted cubic splines. A potential downside of the latter 2 methods is that it is less straightforward to interpret the regression coefficients of the associations between continuous confounders and outcome. However, in causal research, the interest lies in the effects of the casual factor under study, and not in the associations between confounders and the outcome.
It should be noted that controlling for continuous confounders does not necessarily require technically sophisticated methods such as fractional polynomials or splines. Stratification by categories (e.g., 5 categories) of the confounder may adequately control for the confounding by continuous confounders as well,17 although in extreme settings this may not hold.21 In our clinical examples, control for continuous confounders was indeed similar when stratifying using 5 strata or when using fractional polynomials or restricted cubic splines. It should be noted that the results from these methods differed compared with adjustment by stratifying on the dichotomized continuous confounder. The latter is clearly ill-advised.1,13 In general, we recommend not to use cut-points or, if deemed necessary, to use cut-points that are commonly used (e.g., age 65 yr) to allow for comparison between different studies.
Nonlinear relations between continuous confounders and outcomes are not always anticipated. For example, the nonlinear relation between age and cardiovascular death, which was observed in the study of smoking, might come as a surprise. The nonlinear relation is probably due to the fact that the cohort consisted of patients with manifest vascular disease. In this cohort, young adults (e.g., < 30 yr) with manifest vascular disease may have a more severe form of cardiovascular disease than, for example, adults about 50 years of age.
There are several limitations to our analysis. We did not include studies using simulated data. First, an abundant range of scenarios can be considered, including scenarios that inherently favour either restricted cubic splines or fractional polynomials. This was beyond the scope of this paper. Second, generalizing findings from simulation studies to empirical studies is not straightforward. However, it is relevant to see that in the empirical examples the use of restricted cubic splines and fractional polynomials yielded similar results. The data were used for illustration purposes only, and not to answer the causality question of the empirical example data.
In reports on observational studies, modelling the proper transformation of the confounding variables typically does not receive much attention.5,6 For example, which variables are considered as confounders and adjusted for is often not routinely reported,5,6 let alone how continuous confounders were included in the adjustment model. This was also observed in our concise review of the current practice in the reporting of methods to adjust for confounding. It is difficult to assess the validity of results from observational studies if any assessment or modelling of possible nonlinear confounder–outcome associations is not reported. Given that incorrect modelling of continuous confounders can result in important residual confounding, researchers should be aware of possible nonlinear relations between continuous confounders and outcome, and we therefore recommend that such relations are always explored in the data. We suggest that authors clearly report how they adjusted for continuous confounders. Apart from the reporting on confounding adjustment, the functional form of the relation between continuous confounders and outcome should receive ample attention, because ignoring nonlinear relations can lead to important residual confounding.
Key points
Adjustment for confounding is crucial in observational studies on etiology or on preventive or therapeutic treatment effects.
A review of current practice in the reporting of adjustment for continuous confounders in observational epidemiologic studies showed that the functional relation between continuous confounders and outcome is hardly ever reported.
Incorrect modelling of a continuous confounder can result in important residual confounding, as shown by clinical examples.
In these clinical examples, adjustment for continuous confounding by means of stratification of the confounder in 5 strata, and use of fractional polynomials or restricted cubic splines yielded similar results.
Footnotes
Competing interests: Olaf Klungel’s institution has received unrestricted research funding from Top Institute Pharma, GlaxoSmithKline and Pfizer. Karel Moons’ institution has received unrestricted research grants from GlaxoSmithKline, Bayer and Boehringer Ingelheim. No other competing interests were declared.
This article has been peer reviewed.
Contributors: All of the authors contributed to the conception and design of the study. Rolf Groenwold performed the data analysis and interpretation of the data. Rolf Groenwold, Olaf Klungel and Karel Moons drafted the article, which all of the authors critically reviewed for important intellectual content. All of the authors approved the final version submitted for publication.
Funding: The research leading to this analysis was conducted as part of the PROTECT (Pharmacoepidemiological Research on Outcomes of Therapeutics by a European Consortium, www.imi-protect.eu) project, which is a public–private partnership coordinated by the European Medicines Agency. The PROTECT project has received support from the Innovative Medicine Initiative (www.imi.europa.eu) under grant agreement no. 115004, supported by the European Union’s Seventh Framework Programme (FP7/2007–2013) and in-kind contributions from members of the European Federation of Pharmaceutical Industries and Associations. In the context of the Innovative Medicine Initiative, the Division of Pharmacoepidemiology and Clinical Pharmacology, Utrecht University, received a direct financial contribution from Pfizer. The views expressed are those of the authors only and not of their respective affiliation.
Members of PROTECT WP2 (Pharmacoepidemiological Research on Outcomes of Therapeutics by a European Consortium, Work Programme 2 [Framework for pharmacoepidemiology studies]): Yolanda Alvarez, Jim Slattery, Xavier Kurz (European Medicines Agency); Marietta Rottenkolber, Jorg Hasford, Alexandra Sassenfeld (Ludwig–Maximilians–Universität München); Francisco J. de Abajo Iglesias, Miguel Gil, Consuela Huerta, Dolores Montero (Agencia Española de Medicamentos y Productos Sanitarios); Luis A. Garcia-Rodriguez, Ana Ruigomez (Fundación Centro Español de Investigación Farmacoepidemiológica); Patrick Souverein, Dinny de Bakker, Anthonius de Boer, Rolf Groenwold, Svetlana Belitser, Wiebe Pestman, Kit Roes, Arno Hoes, Victoria Abbing-Karahagopian, Frank de Vries, Tjeerd van Staa, Antoine C.G. Egberts, Hubertus G.M. Leufkens, Liset van Dijk, Olaf Klungel (Utrecht University, The Netherlands); Arlene Gallagher, Deven Patel (The UK General Practice Research Database); Per Helboe, Jytte Lyngvig, Anne Marie Clemensen, Tina Engraff, Ulrik Hesse, Jan Poulsen (Lægemid-delstyrelsen, Danish Medicines Agency); John Weil (GlaxoSmithKline, Research and Development); Lamiae Bensouda-Grimaldi, Lucien Abenhaim (L.A. Sante Epidemiologie Evaluation Recherche); Robert F. Reynolds, Nicolle Gatto, Andrew Bate (Pfizer); Gerry F. Downey, Ruth Brauer, Sam Yeboa, Kah L. Goh, Maurille F. Tepie, Andrew Roddam (Amgen NV); Erica Velthuis (Genzyme Europe); Montserrat Miret (Merck KGaA); Saga Johansson (AstraZeneca AB); Paolo Primatesta, Raymond Schlienger, Joan Fortuny, Elena Rivero (Novartis); George Quartey, Hans Petri, Marcus Schuerch, Jamie Robinson (F. Hoffmann–La Roche AG); Joan-Ramon Laporte, Luisa Ibañez, Monica Sabaté, Elena Ballarin, Paula Solari (Fundació Institut Català de Farmacologia)
References
- 1.Royston P, Altman DG, Sauerbrei W. Dichotomizing continuous predictors in multiple regression: a bad idea. Stat Med 2006; 25:127–41 [DOI] [PubMed] [Google Scholar]
- 2.Steyerberg EW. Clinical prediction models: a practical approach to development, validation and updating. New York: Springer; 2009 [Google Scholar]
- 3.Harrell FE., Jr Regression modelling strategies: with applications to linear models, logistic regression, and survival analysis. New York: Springer; 2001. p. 16–26 [Google Scholar]
- 4.Royston P, Moons KG, Altman DG, et al. Prognosis and prognostic research: developing a prognostic model. BMJ 2009;338:b604. [DOI] [PubMed] [Google Scholar]
- 5.Groenwold RHH, van Deursen AM, Hoes AW, et al. Poor quality of reporting confounding bias in observational intervention studies: a systematic review. Ann Epidemiol 2008;18:746–51 [DOI] [PubMed] [Google Scholar]
- 6.Müllner M, Matthews H, Altman DG. Reporting on statistical methods to adjust for confounding: a cross-sectional survey. Ann Intern Med 2002;136:122–6 [DOI] [PubMed] [Google Scholar]
- 7.Benedetti A, Abrahamowicz M. Using generalized additive models to reduce residual confounding. Stat Med 2004;23:3781–801 [DOI] [PubMed] [Google Scholar]
- 8.Brenner H, Blettner M. Controlling for continuous confounders in epidemiologic research. Epidemiology 1997;8:429–34 [PubMed] [Google Scholar]
- 9.Becher H. The concept of residual confounding in regression models and some applications. Stat Med 1992;11:1747–58 [DOI] [PubMed] [Google Scholar]
- 10.Greenland S. Introduction to regression models. In: Rothman KJ, Greenland S, Lash TL, editors. Modern epidemiology. 3rd ed Philadelphia (PA): Lippincott Williams & Wilkins; 2008. p. 381–417 [Google Scholar]
- 11.Royston P, Sauerbrei W. Building multivariable regression models with continuous covariates in clinical epidemiology — with an emphasis on fractional polynomials. Methods Inf Med 2005; 44:561–71 [PubMed] [Google Scholar]
- 12.Royston P, Sauerbrei W. Multivariable model-building: a pragmatic approach to regression analysis based on fractional polynomials for modelling continuous variables. Hoboken (NJ): Wiley; 2008 [Google Scholar]
- 13.Altman DG, Royston P. The cost of dichotomising continuous variables. BMJ 2006;332:1080. [DOI] [PMC free article] [PubMed] [Google Scholar]
- 14.Groenwold RHH, Hoes AW, Hak E. Impact of influenza vaccination on mortality risk among elderly. Eur Respir J 2009;34:56–62 [DOI] [PubMed] [Google Scholar]
- 15.Simons PCG, Algra A, van de Laak MF, et al. SMART study Group Second Manifestations of Arterial disease (SMART) study: rationale and design. Eur J Epidemiol 1999;15:773–81 [DOI] [PubMed] [Google Scholar]
- 16.R Development Core Team R: A language and environment for statistical computing. Vienna (Austria): R Foundation for Statistical Computing; 2011 [Google Scholar]
- 17.Cochran WG. The effectiveness of adjustment by subclassification in removing bias in observational studies. Biometrics 1968; 24:295–313 [PubMed] [Google Scholar]
- 18.Ambler G, Benner A. mfp: Multivariable Fractional Polynomials. 2010. Available: http://CRAN.R-project.org/package=mfp (accessed 2012 Nov. 5).
- 19.Harrell FE., Jr Hmisc: Harrell Miscellaneous. 2012. Available: http://CRAN.R-project.org/package=Hmisc (accessed 2012 Nov. 5).
- 20.Klungel OH, Martens EP, Psaty BM, et al. Methods to assess intended effects of drug treatment in observational studies are reviewed. J Clin Epidemiol 2004;57:1223–31 [DOI] [PubMed] [Google Scholar]
- 21.Austin PC, Brunner LJ. Inflation of the type I error rate when a continuous confounding variable is categorized in logistic regression analyses. Stat Med 2004;23:1159–78 [DOI] [PubMed] [Google Scholar]


