Abstract
The moisture adsorption isotherms of low methoxyl pectin were determined at 30–70°C and water activity ranging from 0.11 to 0.94. The moisture adsorption isotherms revealed that the equilibrium moisture content increased with water activity. Increase in temperature, in general, resulted in decreased equilibrium moisture content. However in some cases, equilibrium moisture content values increased with temperature at higher water activities. Selected sorption models (GAB, Halsey, Henderson, Oswin, modified Oswin) were tested for describing the adsorption isotherms. Parameters of each sorption models were determined by nonlinear regression analysis. Oswin model gave the best fit for pectin sorption behaviour. Isosteric heat of sorption decreased with increase in moisture content and varied between 14.607 and 0.552 kJ/mol. Glass transition temperature decreased with increase in moisture content of pectin.
Keywords: Sorption model, Equilibrium moisture content, Glass transition, Pectin
Introduction
Pectin is composed of homopolymeric chain structure consisting partially methylated α-(1 → 4)-D-galacturonic acid units interrupted by the insertion of few rhamnose residues. Pectin is found in fruits and vegetables and mainly manufactured from citrus peel and apple pomace. Pectins are mainly used as gelling agents, but can also act as thickener, water binder, and stabilizer. It is used in preparation of fruit jams, jellies, marmalades, preserves, chewable fruit candies, canned fruit juices, cheese spreads, and icing. Based on the degree of methoxylation/esterification, pectin is classified as low methoxyl (LM) pectin and high methoxyl (HM) pectin. Degree of esterification (DE) of the pectin molecule is defined as the ratio of esterified galacturonic acid units to total galacturonic acid units in the molecule. The DE of HM- and LM- pectins are 50% and above, and below 50% respectively (Thakur et al. 1997). Pectin is one of the important ingredients in several food products including jam. Study of moisture sorption and thermal properties of pectin is therefore relevant from product development viewpoint.
Water sorption isotherm reveals the equilibrium relationship between moisture content of the food and water activity at constant temperature and pressure. Information on sorption characteristics is important from the point of view of microbial safety and designing processing equipments like dryer and storage chamber (Rahman 1995). Soption isotherms are indispensable to food product and process development, food engineering and quality control (Rizvi 1995; Sablani et al. 2001; Al-Muhtaseb et al. 2002). The quality and safety of food depend upon the initial moisture content of the food material, moisture uptake by the food material during storage, and interaction of moisture with food ingredients. Physical, chemical, and microbiological stability of the foods are dependent on the moisture content of the food and interaction of water with other ingredients present in the food (Rahman 1995; Rizvi 1995; Basu et al. 2006).
Several mathematical models (both theoretical and empirical) have been proposed to describe the moisture adsorption isotherms for food materials. The goodness of fit of any sorption model to the experimental equilibrium moisture content (EMC) and relative humidity data should be judged based on statistical parameters like coefficient of determination (R2), standard error, and residuals plot (Güzey et al. 2001; Al-Muhtaseb et al. 2002; Basu et al. 2006; Jain et al. 2010). Analysis of sorption isotherm data by application of thermodynamic principles provides the isosteric heat of sorption which is a measure of water-solid binding strength. The isosteric heat of sorption is essential to estimate the energy requirements in concentration and drying processes and it provides important information on the state of water (Rahman 1995; Rizvi 1995).
Glass transition temperature is one of the important factors governing the stability of amorphous materials. As powdered amorphous samples are sensitive to temperature and moisture content, temperature and time dependent changes in the physical state determine the drying behaviour and storage stability of food materials. Moisture acts as a plasticizer and significantly changes the glass transition temperature of amorphous solids (Roos and Karel 1990; Sablani et al. 2007). Literature review reveals that the systematic information on the EMC and glass transition of pectin at various temperatures and relative humidities are rather limited (Tsami et al. 1992; Iijima et al. 2000).
The overall objective of the present work was to evaluate the storage behaviour of pectin under different temperature and relative humidity conditions usually encountered during storage and processing. The specific objectives of the present study were to: (a) obtain moisture adsorption isotherms for pectin at selected water activities (0.11–0.94) and temperatures (30–70°C); (b) determine the goodness-of-fit of selected sorption models by non-linear regression; (c) estimate the isosteric heat of sorption; and, (d) correlate glass transition temperature with water activity (or moisture content) for pectin.
Materials and methods
Commercial grade low-methoxyl (LM) pectin (methoxy content = 6.0%; loss on drying at 110°C = 10%; sulphate ash = 6%; arsenic = 0.00005%) manufactured by SD Fine Chemicals (Mumbai, India) was used in experimental studies. LiCl, CH3COOK, MgCl2, Mg(NO3)2.6H20, NaNO2, KCl, KNO3, and KF.2H2O were procured from Loba Chemie (Mumbai, India) for saturated salt solution.
Measurement of adsorption isotherms
Moisture adsorption isotherms were determined using an isopiestic method (Spiess and Wolf 1987). The isopiestic method uses standard saturated salt solutions to maintain constant vapor pressure over the sample to obtain equilibrium moisture content at constant temperature. Pectin samples (≈5 g) were taken in open stainless steel pans and accurately weighed (±0.1 mg) in a weighing balance (CP-224, Sartorius, Germany). The pans with samples were transferred in desiccators containing selected saturated salt solutions for maintaining equilibrium relative humidity. Descicators were placed in a temperature controlled (±1°C) hot air oven (Narang Scientific Works, India). Samples were kept in triplicate for sorption studies of LM pectin. Samples were weighed twice per week until change in weight loss or gain reached less than 0.001 g for two successive readings. Moisture content of each sample (triplicate) was determined gravimetrically by drying in an oven at 105°C for 24 h and expressed on dry-matter basis (Basu et al. 2007).
Sorption models
Moisture sorption isotherms of foodstuffs could be described by several mathematical models and the most appropriate model is selected based on degree of fit to the experimental data and its simplicity to use (Al-Muhtaseb et al. 2002; Basu et al. 2006). The sorption isotherm models (GAB, Halsey, Henderson, Oswin, modified Oswin) used to fit the data are presented in Table 1. Non-linear regression analysis was used to estimate the model coefficients and statistical parameters using Statistica package (StatSoft Inc., Tulsa, USA, Version 5, 1998). The goodness fit of each model was evaluated considering coefficient of determination (R2), standard error (SE), and pattern of residual plots. The models with the lowest values of SE and the highest values of R2 were considered the best models to correlate the experimental data. Based on the model coefficients, predicted values were obtained and were compared with the experimental values in the graphical representation. Further, plot of residual moisture content values vs water activity were also considered. If the residual plots indicated a clear pattern, the model was rejected (Basu et al. 2006).
Table 1.
List of models used to describe moisture adsorption isotherms for pectin
| S.No. | Model | Equation | Characteristics |
|---|---|---|---|
| 1 | GAB |  |
mo: monolayer moisture content C, K: related to mono and multi layer heat of sorption |
| 2 | Halsey |  |
A, B: constants |
| 3 | Henderson |  |
A, B: constants |
| 4 | Oswin |  |
A, B: constants |
| 5 | Modified Oswin |  |
A, B, C: constants |
Isosteric heat of sorption
The net isosteric heat of sorption was computed from the Clausius-Clapeyron equation (Tsami et al. 1990; Labuja et al. 1985).
 |
1 |
where, aw is water activity (dimensionless), qst is net isosteric heat of sorption (kJ/mol), a0 is dimensionless constant, R is universal gas constant (kJ/mol.K), and T is absolute temperature (K). Tsami et al. (1990) proposed a relationship between the net isosteric heat of sorption and equilibrium moisture content.
 |
2 |
where, m is equilibrium moisture content; qo and a are the characteristic parameters.
Glass transition temperature
Glass transition temperature (Tg) of pectin samples at different moisture contents was determined using a differential scanning calorimeter (DSC-Phox, Netzsch, Germany) as described in Basu et al. (2007). The analysis of glass transition reports the onset, the mid-point, and the end temperatures of the step once the start and stop points of the transition are provided, and the mid point of the step is considered as Tg.
Results and discussion
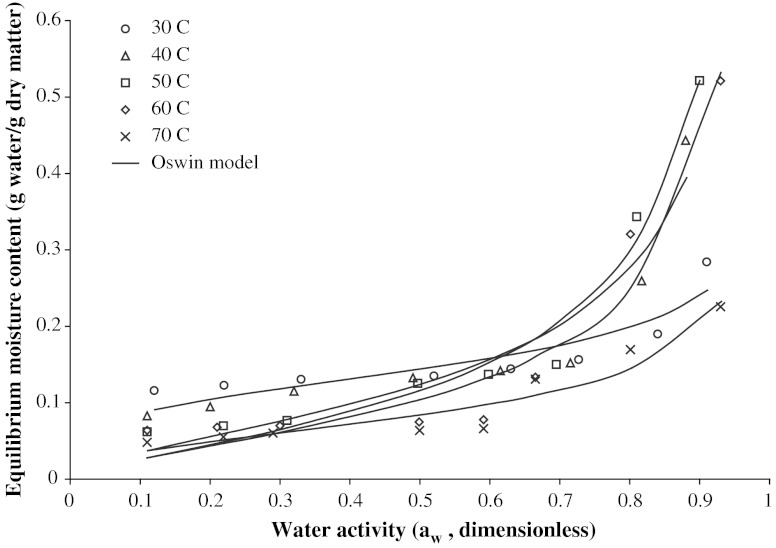
The experimental adsorption isotherms for LM-pectin at different temperatures are shown in Fig. 1. It was observed that sorption curves obtained for pectin were typical type III isotherms (Brunauer et al. 1940) and that EMC of pectin increased with water activity. Increased temperature, in general, resulted in decreased EMC at lower water activities. However at high aw values (aw > 0.6), sorption curves showed intersection or crossover point with the increase of temperature, that is, the EMC increased with temperature. This type of crossing phenomenon of EMC with temperature is mainly due to changes in water binding, or increase of solute solubility in water at higher temperatures (Rizvi 1995; Sablani and Kasapis 2006). At high water activity, the soluble components absorb more water and the temperature has a positive effect because of dissolving effect of water.
Fig. 1.
Moisture adsorption isotherms for pectin at selected temperatures
Sorption models
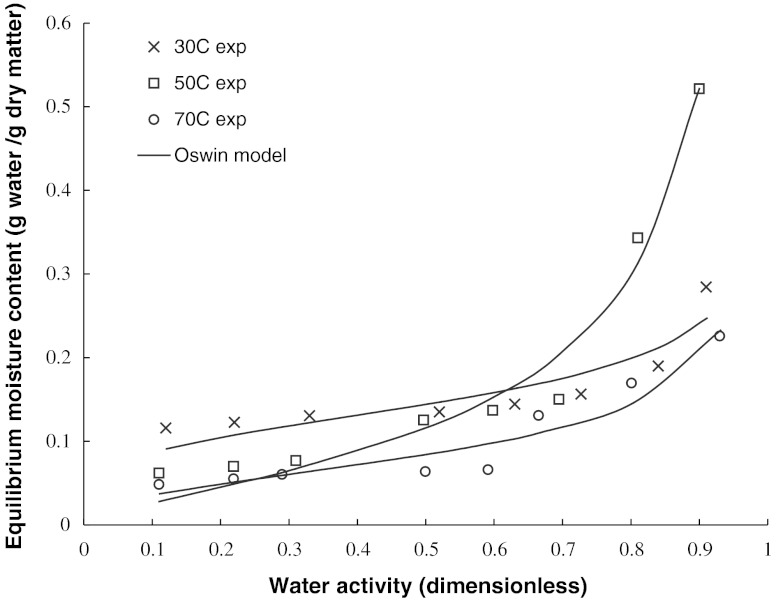
The coefficients of selected sorption models are reported in Table 2. Some of the models (GAB, Henderson) showed low R2, while other models showed high coefficient of determination (R2 > 0.8) and low standard error (SE <0.112). High R2 and low SE values are however not considered sufficient to ensure statistical validity of fitting of any model to describe the adsorption isotherm data over the range of experimental temperature and relative humidity conditions (Basu et al. 2006). Residual plots were therefore examined at different temperatures by plotting residuals against aw (GAB, Oswin, modified Oswin,) or moisture content (Halsey, Henderson). Only three models (Oswin, modified Oswin, and Halsey) provided scattered residual plot (Table 2). The coefficients of Oswin, modified Oswin, Halsey, GAB, and Henderson models are presented in Table 2. The Oswin equation showed a better fitting to the adsorption isotherm data (Fig. 2) and showed random distribution of residuals around zero in a close range compared to other models. In case of Oswin model, R2 varied between 0.82 and 0.97, while SE was less than 0.012 in all cases.
Table 2.
Coefficients of Oswin, modified Oswin, Halsey, GAB and Henderson models for pectin
| S. No. & Model | Model parameters | Temperature (°C) | Nature of residual plot | ||||
|---|---|---|---|---|---|---|---|
| 1, Oswin | 30 | 40 | 50 | 60 | 70 | Scattered | |
| A | 0.02 | 0.02 | 0.02 | 0.02 | 0.02 | ||
| B | 0.23 | 0.23 | 0.23 | 0.23 | 0.23 | ||
| R2 | 0.82 | 0.87 | 0.97 | 0.94 | 0.91 | ||
| SE | 0.003 | 0.012 | 0.005 | 0.011 | 0.003 | ||
| 2, Modified Oswin | A | 3.72 | 1019.90 | 5.37 | 18.58 | 0.52 | Scattered |
| B | −0.01 | −3.26 | −0.02 | −0.16 | −0.01 | ||
| C | 0.23 | 0.54 | 0.68 | 0.63 | 0.39 | ||
| R2 | 0.80 | 0.87 | 0.97 | 0.91 | 0.91 | ||
| SE | 0.012 | 0.023 | 0.005 | 0.05 | 0.003 | ||
| 3, Halsey | A | −0.0002 | −0.004 | −0.028 | −0.018 | −0.008 | Scattered |
| B | 4.11 | 2.56 | 1.50 | 1.54 | 1.75 | ||
| R2 | 0.91 | 0.95 | 0.97 | 0.81 | 0.87 | ||
| SE | 0.051 | 0.027 | 0.016 | 0.112 | 0.077 | ||
| 4, GAB | Mo | 2.10 | 0.06 | 0.06 | 0.52 | 0.06 | Patterned |
| C | 0.03 | 2654.97 | 28.89 | 0.173 | 5.89 | ||
| K | 4.12 | 0.987 | 0.98 | 0.76 | 0.82 | ||
| R2 | 0.17 | 0.94 | 0.96 | 0.95 | 0.91 | ||
| SE | 0.018 | 0.005 | 0.003 | 0.01 | 0.002 | ||
| 5, Henderson | A | −7611.5 | −1370.79 | −36.47 | −6.71 | −19.65 | Patterned |
| B | 4.75 | 3.74 | 1.86 | 1.03 | 1.36 | ||
| R2 | 0.89 | 0.91 | 0.91 | 0.75 | 0.82 | ||
| SE | 0.061 | 0.049 | 0.054 | 0.144 | 0.101 | ||
Fig. 2.
Oswin model fitting for moisture adsorption isotherms for pectin at selected temperatures
Isosteric heat of sorption
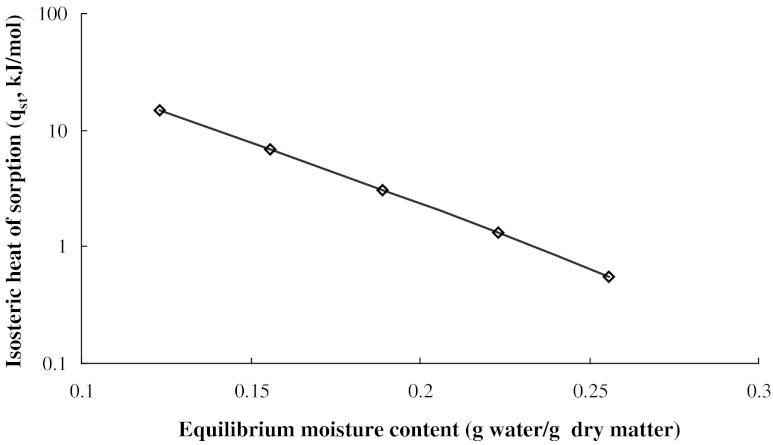
Isosteric heat of sorption was computed from the slope of the plot between the values of ln (aw) vs 1/T at given moisture content using eq. (1). Variation of qst with moisture content followed eq. (2) (Fig. 3). Isosteric heat of sorption decreased from 14.607 to 0.552 kJ/mol while moisture content increased from 0.123 to 0.256 g water/g dry matter. The coefficients of eq. (2) were found as: q0 = 270.9 kJ/mol, a = 23.73 (R2 > 0.99 and S.E.<0.0148). The isosteric heat of sorption is dependent on moisture content or water activity, with the energy required for sorption increasing at low equilibrium moisture content/water activity. This behaviour reflects the differential nature of water binding at the sorption sites: initial occupation of highly active polar sites on the surface (with the higher interaction energy), followed by the progressive filling of the less available sites with lower bonding activation energies (Al-Muhtaseb et al. 2002; McMinn and Magee 2003). As the moisture content increases further, the heat of sorption tends to that of pure water, an indication of the moisture existing in free form. This behaviour is consistent with the results reported by several researchers (Labuja et al. 1985; Vázquez et al. 2001). The information on heat of sorption at selected moisture contents indicates the state of sorbed water and provides a measure of the physical and chemical stability of the pectin under given storage conditions.
Fig. 3.
Isosteric heat of adsorption of water for pectin
Glass transition temperature
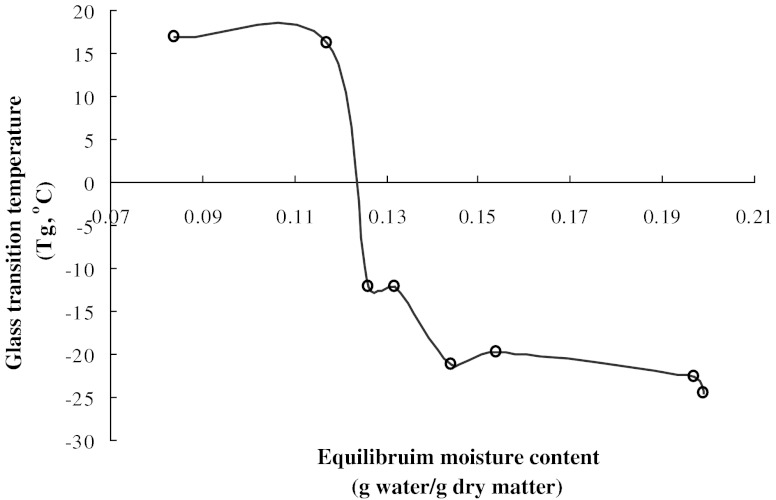
Glass transition temperature decreased with increase in water activity (or moisture content) (Fig. 4) and varied from 16.8 to −24.6°C in the aw range of 0.12 to 0.91. Tg values are dependent on water content, as water has a plasticizing effect on the Tg of pectin which leads to increased free volume and a weakening of the interchain interactions during storage (Roos and Karel 1990). Dependence of Tg on aw and m was expressed using following polynomial equations:
 |
3 |
 |
4 |
Fig. 4.
Variation of glass transition temperature with equilibrium moisture content for pectin
Conclusion
Results indicated that the equilibrium moisture content of pectin increased with increasing water activity at constant temperature. Increased temperature, in general, resulted in decreased equilibrium moisture content value. The Oswin model described well the adsorption isotherms of pectin over 30–70°C and 0.11–0.94 water activity based on high R2, low SE, and scattered pattern of residuals. The significance of residual plot along with the statistical parameters for selection of appropriate sorption models was demonstrated. The net isosteric heat of sorption and glass transition temperature decreased with increase in moisture content.
References
- Al-Muhtaseb AH, McMinn WAM, Magee TRA. Moisture sorption isotherm characteristics of food products: a review. Trans I Chem E C. 2002;80:118–128. [Google Scholar]
- Basu S, Shivhare US, Mujumdar AS. Models for sorption isotherms for foods: a review. Drying Technol. 2006;24(8):917–930. doi: 10.1080/07373930600775979. [DOI] [Google Scholar]
- Basu S, Shivhare US, Mujumdar AS. Moisture adsorption isotherms and glass transition temperature of xanthan gum. Drying Technol. 2007;25(9):1581–1586. doi: 10.1080/07373930701539795. [DOI] [Google Scholar]
- Brunauer S, Deming LS, Deming WE, Teller E. On a theory of the Van der Waals adsorption of gases. J Am Chem Soc. 1940;62:1723–1732. doi: 10.1021/ja01864a025. [DOI] [Google Scholar]
- Güzey D, Ozdemir M, Seyham FG, Doğan H, Devres O. Adsorption isotherms of raw and roasted hazelnuts. Drying Technol. 2001;19(3&4):691–699. doi: 10.1081/DRT-100103945. [DOI] [Google Scholar]
- Iijima M, Nakamura K, Hatakeyama T, Hatakeyama H. Phase transition of pectin with sorbed water. Carbohydr Polym. 2000;41:101–106. doi: 10.1016/S0144-8617(99)00116-2. [DOI] [Google Scholar]
- Jain SK, Verma RC, Sharma GP, Jain HK. Studies on moisture sorption isotherms for osmotically dehydrated papaya cubes and verification of selected models. J Food Sci Technol. 2010;47(3):343–346. doi: 10.1007/s13197-010-0056-7. [DOI] [PMC free article] [PubMed] [Google Scholar]
- Labuja TP, Knnane A, Chen JY. Effect of temperature on the moisture sorption isotherm and water activity shift of two dehydrated foods. J Food Sci. 1985;50:385–392. [Google Scholar]
- McMinn WAM, Magee TRA. Thermodynamic properties of moisture sorption of potato. J Food Eng. 2003;60:157–165. doi: 10.1016/S0260-8774(03)00036-0. [DOI] [Google Scholar]
- Rahman S (1995) Water activity and sorption properties of foods. In: Rahman MS (Ed) Food properties handbook. CRC Press, Boca Raton, Florida, USA, pp 1–86
- Rizvi SSH. Thrmodynamic properties of foods in dehydration. In: Rao MA, Rizvi SSH, editors. Engineering properties of foods. 3. New York: Marcel Dekker; 1995. pp. 133–214. [Google Scholar]
- Roos Y, Karel M. Differential scanning calorimetry study of phase transitionsaffecting the quality of dehydrated materials. Biotech Prog. 1990;6:159–163. doi: 10.1021/bp00002a011. [DOI] [Google Scholar]
- Sablani SS, Kasapis S. Glass transition and water activity of freeze-dried shark. Drying Technol. 2006;24(8):1003–1009. doi: 10.1080/07373930600776175. [DOI] [Google Scholar]
- Sablani SS, Rahman MS, Labuza TP. Measurement of water activity using isopiestic method. In: Wrolstad RE, editor. Current protocols in food analytical chemistry, Vol 1. New York: Wiley; 2001. pp. A2.3.1–A2.3.10. [Google Scholar]
- Sablani SS, Kasapis S, Rahman MS. Evaluating water activity and glass transition concepts for food stability. J Food Eng. 2007;78:266–271. doi: 10.1016/j.jfoodeng.2005.09.025. [DOI] [Google Scholar]
- Spiess WEL, Wolf W. Critical evaluation of methods to determine moisture sorption isotherms. In: Rockland LB, Beuchat LR, editors. Water activity: theory and applications to food. New York: Marcel Dekker; 1987. pp. 215–233. [Google Scholar]
- Thakur BR, Singh RK, Handa AK. Chemistry and uses of pectin-a preview. Crit Rev Food Sci Nutr. 1997;37(1):47–73. doi: 10.1080/10408399709527767. [DOI] [PubMed] [Google Scholar]
- Tsami E, Maroulis B, Marinos-Louris D, Saravacos GD. Heat of sorption of water in dried fruits. Int J Food Sci Technol. 1990;25:350–359. doi: 10.1111/j.1365-2621.1990.tb01092.x. [DOI] [Google Scholar]
- Tsami E, Vagenas GK, Marinos-Kouris D. Moisture sorption isotherms of pectins. J Food Process Preserv. 1992;16(3):151–161. doi: 10.1111/j.1745-4549.1992.tb00197.x. [DOI] [Google Scholar]
- Vázquez G, Chenlo F, Moreira R. Modeling of desorption isotherms of chestnut: influence of temperature and evaluation of isosteric heats. Drying Technol. 2001;19(6):1189–1199. doi: 10.1081/DRT-100104814. [DOI] [Google Scholar]


