

Abstract
The thick ascending limb (TAL) is a major NaCl reabsorbing site in the nephron. Efficient reabsorption along that segment is thought to be a consequence of the establishment of a strong transepithelial potential that drives paracellular Na+ uptake. We used a multicell mathematical model of the TAL to estimate the efficiency of Na+ transport along the TAL and to examine factors that determine transport efficiency, given the condition that TAL outflow must be adequately dilute. The TAL model consists of a series of epithelial cell models that represent all major solutes and transport pathways. Model equations describe luminal flows, based on mass conservation and electroneutrality constraints. Empirical descriptions of cell volume regulation (CVR) and pH control were implemented, together with the tubuloglomerular feedback (TGF) system. Transport efficiency was calculated as the ratio of total net Na+ transport (i.e., paracellular and transcellular transport) to transcellular Na+ transport. Model predictions suggest that 1) the transepithelial Na+ concentration gradient is a major determinant of transport efficiency; 2) CVR in individual cells influences the distribution of net Na+ transport along the TAL; 3) CVR responses in conjunction with TGF maintain luminal Na+ concentration well above static head levels in the cortical TAL, thereby preventing large decreases in transport efficiency; and 4) under the condition that the distribution of Na+ transport along the TAL is quasi-uniform, the tubular fluid axial Cl− concentration gradient near the macula densa is sufficiently steep to yield a TGF gain consistent with experimental data.
Keywords: tubuloglomerular feedback, autoregulation, NaCl transport, cell volume regulation
along the thick ascending limb (TAL) of a short loop of Henle in a rat kidney, active transport of Na+ reduces luminal NaCl concentration from ∼250 to 300 mM at the loop bend to ∼25 mM at the end of the cortical TAL (cTAL; Refs. 2, 37, 40). Given the low availability of oxygen within the renal medulla and the high metabolic demands of the medullary TAL (mTAL), it appears essential that TAL Na+ transport be efficient. TAL cells are believed to attain that efficiency by means of apical Na+ uptake that is mediated by the electroneutral Na+-K+/NH4+-2Cl− cotransporter (NKCC2; Refs. 1, 11). Back diffusion of K+ through apical K+ channels produces a lumen-positive transepithelial potential that drives passive Na+ reabsorption through cation-permeable tight junctions. It is thought that this reduces net ATP utilization to a level much lower than what would be required if Na+ transport were solely transcellular.
However, the above scheme is complicated by several factors. As tubular Na+ concentration ([Na+]) decreases along the TAL, the transepithelial Na+ chemical potential reduces, or perhaps reverses, the driving force for paracellular Na+ transport. Also, the distribution of Na+ transport along the TAL likely influences transport efficiency, especially if luminal [Na+] approaches low static-head levels. Similarly, apical uptake of NH4+ via NKCC2 (in competition with K+) and its extrusion via Na+-H+ exchanger (NHE3) will affect Na+ transport efficiency along the TAL by preventing K+ depletion in the lumen and by making NHE3 another transcellular pathway for Na+ reabsorption. Additionally, the rate of tubular fluid flow, which is regulated by tubuloglomerular feedback (TGF), affects transport efficiency by altering the luminal Na+ concentration profile along the TAL. Thus a thorough understanding of TAL Na+ transport efficiency can only be gained by taking all of these factors into account.
In a companion study (31), we developed a mathematical model of a TAL cell. In the present study, we extended that model to represent a TAL segment, and we used the resulting model to study the effects of tubular fluid dilution on Na+ transport efficiency. The results suggest that a quasi-uniform workload distribution along the TAL is established by processes at both the cellular and tubular levels. At the cellular level, TAL cell volume regulation (CVR) distributes transport workload by reciprocally regulating NKCC2 and KCC4 activities in the cells that comprise the TAL (15, 17). This has the effect of balancing, in each cell, apical uptake with basolateral transport capacity and leads to a more uniform distribution of Na+ transport (i.e., workload) along the corticomedullary axis. At the tubular level, the TGF system acts to maintain reasonable efficiency of TAL Na+ transport by balancing glomerular filtration with tubular reabsorptive capacity such that the TAL effluent Na+ concentration is maintained well above the static head.
MATHEMATICAL MODEL
We developed a cell-based model of the TAL of a short loop of Henle of the rat kidney. The TAL segment model consists of an ensemble of N cells that make up the walls of the TAL. A schematic diagram of the model configuration is shown in Fig. 1. The model equations describe the time evolution of cell volume and the cytosolic and luminal concentrations along the TAL. The solutes represented are Na+, K+, Cl−, H+, NH4+, NH3, H2CO3, HCO3−, H2PO4−, HPO42−, X−, Y, and Z+, where X−, Y, and Z+ represent charged and uncharged impermeants. The equations that represent solute conservation in the cytosolic compartment as well as the expressions for solute flux, water flux, and electroneutrality constraints were described in the companion study (31), as are also the mechanisms by which the model maintains pH homeostasis and regulates cell volume.
Fig. 1.

Thick ascending limb (TAL) segment model.
Within the TAL lumen, water and solute conservation equations are given by
| (1) |
| (2) |
where x is the axial coordinate along the TAL segment, such that x = 0 at the loop bend and x = L at the end of the cTAL; t is time; the superscripts a, b, p, c indicate apical, basolateral, paracellular, or cytosolic, respectively; the subscripts i, w denote either the ith solute or water; Cia (x, t) is the luminal concentration of solute i; Cic(t) is the concentration of solute i in a cell at a given position along the TAL; r is the TAL luminal radius; A is the luminal cross-sectional area; and Cib is the serosal concentration of solute i, which is assumed to be time independent. Fw(x, t) is the water flow entering the TAL segment. Equation 1 implies that, because the TAL is water impermeable, Fw is a function of time only, so we need not represent the spatial dependency and thus we write Fw(x, t) = Fw(t). The transmural solute fluxes are denoted by Jim(·, ·), (m = a, b, p), with each flux a function of its own intra/extracellular concentration as well as the intra/extracellular concentration of other solutes (Cm, m = a, b, c). Finally, the hydration/dehydration of CO2 in the lumen was represented by the inclusion of a chemical source flux (see eq 9 in the companion paper (31)) into the lumenal volume.
Boundary and initial conditions.
To complete the specification of the model equations, we specify the solute concentrations of the tubular fluid at the loop bend (i.e., at x = 0). Those concentration values are listed in Table 1.
Table 1.
Values for initial and boundary conditions
| Initial |
|||
|---|---|---|---|
| Lumen* | Cytosol | Boundary | |
| [Na+] | 252 | 7.00 | 252 |
| [K+] | 8.00 | 136 | 8.00 |
| [Cl−] | 236 | 4.40 | 236 |
| [X−] | 27.7 | 112.5 | 27.7 |
| [Y] | 0.300 | [6.00, 306]† | 0.300 |
| [Z+] | 33.7 | 0.908 | 33.7 |
| pH | 7.27 | 7.28 | 7.27 |
| [NH4+] | 3.97 | 5.01 | 3.97 |
| [NH3] | 0.0519 | 0.0682 | 0.051875 |
| [H2CO3] | 0.00504 | 0.00483 | 0.00504 |
| [HCO3−] | 25.0 | 25.0 | 25.0 |
| [H2PO4−] | 1.28 | 0.988 | 1.28 |
| [HPO42−] | 3.73 | 3.01 | 3.73 |
| Vcell | N/A | 8.20 × 10⁻⁸ | N/A |
Concentrations indicated by brackets and are in mM, and volume is in cm3. Vcell is defined in mathematical model.
Uniform along the length of the thick ascending limb (TAL).
Range from cortical TAL to medullary TAL.
Another boundary condition is the loop-bend water flow rate Fw(t), which determines the water flow rate into and along the TAL segment. We considered two approaches in specifying Fw(t). In the first case, we made the simple assumption that TAL inflow is constant, i.e.,
| (3) |
where Q is the steady-state single nephron glomerular filtration rate (SNGFR) and α is the fraction of SNGFR reaching the TAL. In the second case, we coupled the TAL model with the TGF system, so that TAL inflow depends on macula densa [Cl−] with a time delay (22):
| (4) |
| (5) |
| (6) |
Equation 4 is the TGF response, where k is the sensitivity of the TGF response, Cop is the steady-state [Cl−]MD, Qop is steady-state SNGFR, and ΔQ is the TGF-mediated range of SNGFR. Equation 5 represents the delay between changes in luminal Cl− at the end of the TAL (x = L) and effective Cl− concentration at the macula densa. The delay consists of a pure delay τ that represents the elapsed time from the stimulus until muscle tension in the afferent arteriole changes, and τd is the total time over which the effect (change in afferent arteriole diameter) is distributed. Equation 6 characterizes the distributed delay.
To compute the time evolution of the model variables, we must also specify their values at initial time, and Table 1 shows the assumed initial conditions unless stated otherwise. Cell volume is computed by assuming the TAL radius, including the walls, is 2r. Thereby, Vcell = π(2r)2Δx − Vlum, where Vlum denotes the luminal volume, given by Vlum = πr2Δx and Δx = L/N.
Numerical solution.
The numerical solution of the model equations for the cell model is described in the companion study (31). The luminal flow and solute conservation Eqs. 1 and 2 were solved using a parallelized, simple-splitting, min-mod flux limiter (27, 38) with a Δx = L/N. The implementation of the numerical methods were done in MATLAB®. The computing resource used was a Linux box with 8 GB of memory and two Intel® quad-core Xeon® X5473 3 GHz CPUs.
Model parameters.
The physical dimensions and chemical properties of the TAL cell can be found in the companion study (31). The physical dimensions of the TAL are shown in Table 2. Baseline TAL inflow is taken to be 6 nl/min, based on α = 0.2 and Q = 30 nl/min (5, 30). Table 3 shows the chemical composition of the serosal bath or the interstitium along the TAL. Note the high osmolarity (∼500 mOsm) near the outer-inner medullary boundary (loop bend) and that halfway along the TAL segment is the cortico-medullary junction. The values for this set of concentrations are consistent with values summarized in Ref. 21.
Table 2.
Basic physical parameters
| Description | Value | Reference | |
|---|---|---|---|
| N | Number of cells | 70 | N/A |
| L | TAL length, cm | 0.6 | (16) |
| R | TAL radius, μm | 10 | (16) |
| Vlum | TAL luminal volume, cm3 | 1.885 × 10⁻⁶ | Calculated* |
| α | Fraction of SNGFR reaching TAL | 0.2 | (30) |
| Q | Steady-state SNGFR, nl/min | 30 | (5) |
SNGFR, single nephron glomerular filtration rate; N/A, not applicable.
Luminal volume Vlum = πr2Δx, where Δx = L/N.
Table 3.
Serosal concentrations
| OM | Cortex | |
|---|---|---|
| Na+ | 285.6→145.0 | 145.0 |
| K+ | 8.000→3.500 | 3.500 |
| Cl− | 265.7→105.0 | 105.0 |
| X− | 0.7626→16.85 | 16.85 |
| Y | 8.300 | 1.000 |
| Z+ | 0.7625→1.000 | 1→1.921 |
| pH | 7.306→7.300 | 7.300 |
| NH4+ | 4.000→2.000 | 2.000→1.000 |
| NH3 | 0.0569→0.0279 | 0.0279 |
| H2CO3 | 4.591 × 10⁻³→4.658 × 10⁻³ | 4.658×10⁻³ |
| HCO3− | 25.00 | 25.00 |
| H2PO4− | 0.9271→0.6250 | 0.6250 |
| HPO42− | 3.000→2.000 | 2.000 |
All concentrations are in mM. Arrow (→) denotes a linear increase (or decrease) along the TAL. OM, outer medulla.
Table 4 shows apical, basolateral, and paracellular solute permeabilities along the TAL. The parameters for the membrane-embedded carriers and the carrier representation for each membrane are described in the companion study (31). In Fig. 2 and Table 4, max/min NKCC/KCC transporter densities and permeabilities were chosen such that outflow and luminal concentration profiles, and transepithelial electrical and chemical gradients computed by the model approximate experimental values reported by Greger (10) and by Vallon et al. (40). Finally, to illustrate the effects of the degree of tubular dilution on Na+ transport efficiency and TGF gain, two different No-CVR cases were studied: one with the NKCC/KCC densities at the maximum limit, and a second with the densities set to the minimum limit.
Table 4.
Apical, basolateral, and paracellular permeabilities
| Pa | Pb | Pp | |
|---|---|---|---|
| Na+ | 0 | 0.05 | [0.3, 0.6] |
| K+ | [16, 11]0.2L, [11, 2] | 4.8 | [0.3, 3] |
| Cl− | 0 | 1.2 | [0.014, 0.028] |
| X− | 0 | 0 | 0 |
| Y | 0 | 0 | 0 |
| Z+ | 0 | 0 | 0 |
| H+ | 40 | 40 | [0.6, 1.2] |
| NH4+ | [0.014, 0.75]0.2L, [0.75, 2.8] | 0.08 | 0.06 |
| NH3 | 30 | 20 | 0.6 |
| H2CO3 | 0 | 0 | 0 |
| HCO3− | 0 | 0.02 | 0.001 |
| H2PO4− | 0 | 0 | 0 |
| HPO42− | 0 | 0 | 0 |
| H2O | 0 | 40 | 0 |
Solute permeabilities are in units of ×10−4 cm/s; H2O permeability is in ×10−4 mM−1 cm/s. Brackets give the range of a linear decrease (or increase) along the TAL. The brackets' subscript denotes the distance from the inlet of the TAL for which the range applies.
Fig. 2.

Na+-K+/NH4+-2Cl− cotransporter (NKCC) and KCC maximum, minimum, and steady-state enzyme density for cell volume regulation function defined in Ref. 31.
RESULTS
TAL function.
Steady-state model solutions were computed by solving model equations (Eqs. 1 and 2), and cell model equations in Ref. 31, using parameters in Tables 2, 3, and 4 and constant TAL inflow (Eq. 3). Luminal and cytosolic concentrations are shown in Figs. 3 and 4, respectively. A generally descending gradient of all major luminal concentrations is established along the TAL length, with the exception of H2PO4− (not shown), which increases because of buffering of secreted H+ by HPO42−. Likewise, in spite of the transepithelial NaCl concentration gradient favoring paracellular backleak, Na+ is diluted from 250 to ∼28 mM (see below). The pH decreases along the segment and tubular fluid becomes slightly acidic (∼6.9) when it reaches the end of the TAL owing to the presence of NH4+. Also noteworthy are the localized changes in concavity, which we call “jumps,” in the K+ and NH4+ profiles at certain locations along the TAL (see Fig. 3, B and D). The reasons for the “jumps” are twofold: first, there is a sharp change in slope of the serosal concentration profile at the cortico-medullary junction (x = 0.3 cm) for most of the tracked solutes, in particular Na+, K+, Cl−, and NH4+ (see Table 3). Second, there is an abrupt change from NKCC2 isoform-A to isoform-B in the distal cTAL (x = 0.5 cm). Since different NKCC2 isoforms have different Cl− binding affinities (B > A > F) (9, 33) and translocation rates, when isoform-A is switched to isoform-B, a discontinuous change in model parameters associated with NKCC2 is introduced.
Fig. 3.

Steady-state luminal concentration for major solutes and steady-state membrane potential. A–D: interstitial concentration profile. F: membrane potentials (MP) where Ea, Eb, and Ep are the apical, basolateral, and transepithelial membrane potentials, respectively.
Fig. 4.

A–F: steady-state cytosolic concentration for major solutes and steady-state cell volume. In F, the solid line denotes cell volume regulation (CVR), and dashed line is for no CVR enabled with NKCC2 and KCC4 density set to its maximum allowed value.
Figure 3F shows that the apical and basolateral membrane potentials decrease from approximately −75 mV at the loop bend to approximately −100 and −120 mV, respectively, at the late cortex. Hence, the transepithelial membrane potential (Ep = Eb − Ea) is always positive and increases up to a value of 20 mV at the late cortex. This is important because a positive transepithelial potential favors paracellular Na+ reabsorption and partially counteracts the chemical gradient for Na+ that favors backleak through the tight junctions. Figure 4 shows the steady-state cytosolic concentrations and normalized cell volume. We observe the low-Na+/high-K+ regime typical of all eukaryotic cells and a pH that is within reasonable bounds. A change in monotonicity, i.e., the slope of concentration profile changes sign, is observed in the pH profile. This is attributed to the change in the slope of the interstitial pH at the cortico-medullary junction (x = 0.3 cm and see Table 3). The model also predicts that cell volume is well controlled except for the distal part of the cTAL, where the luminal fluid becomes very dilute (osmolarity of ∼60 mOsm, and see Fig. 3, A and C). Without CVR and high NKCC/KCC densities, cell volume progressively decreases along the TAL segment, owing to the very low luminal Na+ and Cl− concentrations, which blunts NKCC Na+ uptake.
Influence of CVR on TAL function.
We assessed the impact of CVR on transport efficiency and workload distribution along the TAL by computing steady-state model solutions for different tubular fluid flow rates (Fw = 4, 6, and 8 nl/min). Simulations were conducted with and without CVR. When CVR was neglected, the NKCC and KCC densities were either set to a prescribed maximum value (case no-CVR) or to their minimum (case no-CVR-min). Alternative strategies (described in Ref. 31) were tried, with results similar to those shown below, although in some cases the changes were either more subtle or led to failure to adequately dilute the tubular fluid.
Figure 5 shows the concentration profiles for Na+, Cl−, and K+ at three flows; the dashed lines are the corresponding fixed interstitium concentration profiles. At baseline flow (6 nl/min), the TAL model with CVR predicts concentration profiles for Na+ and Cl− that indicate that reabsorption is distributed such that there is substantial dilution in the cortex, while at low flow the majority of the transport occurs in the medulla and luminal concentrations approach static head such that net transport is almost zero. At high flows, the profile's slope and profiles themselves for Na+ and Cl− rise all along the TAL. Most of the K+ is reabsorbed in the medulla, and the same holds for NH4+ (not shown). Without CVR and NKCC and KCC at maximum activity, net transport takes place mostly within the medulla and the concentration profiles are relatively flat in the cortex, except at the highest flow. A flat [Cl−] profile near the macula densa would render TGF ineffective. This can be shown by computing the steady-state gain (Gss) and the compensation of the TGF system for the cases of CVR and no CVR. The calculation is based on the rationale presented in (23, 26). The gain is calculated as
| (7) |
| (8) |
where the concentrations are the steady-state values, Fwop is the flow at the TGF operating point, and ΔFw = 0.6 = 0.1Fop nl/min is a small perturbation in tubular inflow fluid from baseline value (observe that ∂Fw/∂CMD is computed by taking the derivative of Eq. 4 and evaluating at CMD = Cop). The compensation is defined as
| (9) |
The no CVR case yields a Gss = (−0.14625)(13 − 12.55)/1.2 = −0.055 and the compensation is equal to 5.2%, whereas for the CVR case Gss = (−0.14625)(35.79 − 22.79)/1.2 = −1.584 and the compensation is equal to 61.3%. These results illustrate that CVR acts to distribute work among all of the individual TAL cells and helps establish an axial Cl− gradient consistent with measured TGF gain values (12, 29, 39).
Fig. 5.

A–F: steady-state luminal concentration for major solutes. Solid curve denotes an inflow of 6 nl/min, dotted an inflow of 8 nl/min, dotted-dashed an inflow of 4 nl/min, and dashed line is the fixed serosal concentration profile. OM, outer medulla.
The graphs in Fig. 6 further illustrate the influence of CVR on TAL effluent ion composition. With CVR, the flow dependence of Na+, Cl−, and K+ is comparable to measurements by Vallon et al. (40). Without CVR and high transporter density, the model predicts that the slopes of the outflow curves are reduced because the slopes of the axial concentration profiles in the cTAL (see Fig. 5) are small in magnitude. As a reference, Fig. 6 also illustrates the effect in TAL outflow concentration when CVR was disabled but NKCC2 activity was set to a low minimal value. In that case, the TAL effluent [Na+] is flow dependent, but the concentration range is much higher than measured. Hence, CVR responses may in part explain the observed dependency of effluent ion composition on tubular fluid inflow. It is noteworthy that, in essence, the CVR responses that protect individual cells from volume perturbations also organizes the Na+ transport in the ensemble of cells along the TAL.
Fig. 6.

Steady-state outflow for major solutes. A: Na+. B: Cl−. C: K+. Circles denote CVR, squares denote no CVR enabled with NKCC2 and KCC4 density set to its maximum allowed value (see Fig. 2), and triangles denote no CVR enabled with NKCC2 and KCC4 density set to its minimum allowed value.
CVR and transport efficiency.
We studied the transport efficiency of the TAL using the following measure:
| (10) |
The index ε ranges from 0 to 2 where ε = 0 means complete backleak (serosa to lumen) through the paracellular pathway, whereas ε = 2 means that for each Na+ that goes transcellularly, one is transported paracellularly from lumen to serosa.1 An alternative measure of Na+ transport efficiency over the whole TAL segment can be obtained by integrating ε over the length of the TAL, i.e.,
| (11) |
Table 5 shows the values of ϵ̄ for cells with and without CVR and for different tubular inflow. The reported values show that increasing the tubular inflow yields greater transport efficiency and an overall greater transport efficiency for the cases with CVR. Higher tubular inflows yield greater ϵ̄ because Na+ concentration profile along the TAL is higher, and thus the transepithelial concentration gradient that favors backleak is smaller compared with the low tubular inflow case.
Table 5.
Integrated Na+ transport efficiency
| ϵ̄ | ϵ̄OM | ϵ̄cortex | |
|---|---|---|---|
| CVR, 4 nl/min | 0.676 | 1.032 | 0.327 |
| No CVR, 4 nl/min | 0.510 | 0.883 | 0.141 |
| CVR, 6 nl/min | 0.895 | 1.074 | 0.726 |
| No CVR, 6 nl/min | 0.691 | 1.083 | 0.304 |
| CVR, 8 nl/min | 0.983 | 1.083 | 0.892 |
| No CVR, 8 nl/min | 0.844 | 1.151 | 0.546 |
The ϵ̄MO and ϵ̄cortex are for the average efficiency along the OM region and cortex respectively. CVR, cell volume regulation.
Figure 7 illustrates how the transport efficiency varies along the TAL. After reaching its peak in the outer medulla, the efficiency falls as paracellular transport reverses. For the case of no CVR and NKCC2 and KCC4 transporter set to a maximal value (no-CVR case and dashed line), the lower efficiency in the cortex is a consequence of the greater dilution of the tubular fluid. In contrast, in the case of no CVR and transporter density set to minimum (no-CVR-min case and dotted line), the efficiency is higher because of the high luminal [Na+] (hence a lower transepithelial concentration gradient). Also, the jumps in the curves in the cortex results from the transition from isoform-A to isoform-B of the NKCC2 transporter.
Fig. 7.
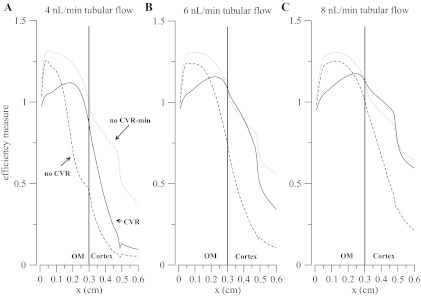
Efficiency index is defined in Eq. 10. A: 4 nl/min tubular flow. B: 6 nl/min tubular flow. C: 8 nl/min tubular flow. Solid line denotes CVR, dashed line is for no CVR enabled with NKCC and KCC activity set to its maximum allowed value, and dotted line is for no CVR enabled with NKCC and KCC activity set to its minimum allowed value.
Four things are noteworthy in Fig. 7: first, the efficiency does not monotonically decrease from the outer medullary region to the late cortex; instead, it reaches a maximum before crossing the cortico-medullary junction. The location of the maximum is determined by the location of maximum paracellular flux, which depends on the transepithelial concentration gradient, membrane potential differences, and tubular flow (inasmuch as the flow changes the transepithelial concentration difference along the TAL segment).
Second, the transport efficiency with no-CVR case is higher than the CVR case along part of the outer medulla. This is caused by an increase in paracellular transport, relative to the CVR case, driven by the rise in transepithelial potential difference that is a consequence of the increased NKCC2 uptake, which has been set to its maximum, and passive apical K+ and NH4+ backleak. Nevertheless, the increased NKCC2 uptake also yields a much greater tubular fluid dilution close to the TAL inlet that establishes a transepithelial chemical gradient that favors backleak. As a result, efficiency decreases toward the cortex.
Third, the efficiency does not rise to the maximum permitted value of 2. This means that either the TAL Na+ transport system is not as efficient as suspected or that a second system that regulates TAL workload by controlling TAL inflow, i.e., TGF, needs to be accounted for. The possible synergism between CVR and TGF is explored below.
Fourth, merely permitting the individual TAL cells to autonomously regulate their volume results in a distribution of transport workload that increases ε and yields concentration profiles consistent with experimental data.
Using the TAL cell model (31), we showed that the presence of NH4+ in the TAL lumen and the expression of the NKCC2 in the cell apical membrane gave rise to NH4+ cycling. To determine the impact of NH4+ cycling on efficiency and on the dilution capacity of the TAL, we computed the steady-state concentration profiles and the efficiency index (ε) for three cases with and without NH4+ cycling impaired. In Fig. 8, the solid lines indicate the baseline case in terms of NH4+levels and NKCC2 NH4+ transport; the dotted lines represent the results obtained when the NKCC2 model without the ammonium wing is used (28), hence hampering NH4+cycling. The dash-dotted lines indicate the case in which [NH4+] in all compartments was reduced to low levels (10−6 mM).
Fig. 8.
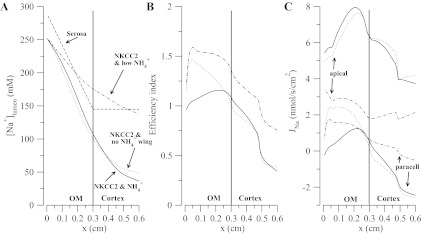
In A, the dashed line is the serosal concentration profile. In A-C, solid line is for the case with NKCC2 and normal NH4+ levels, dotted line is for NKCC2 without the NH4+ cycle (wing) and normal NH4+ levels, and dotted-dashed line is for NKCC2 and low levels of NH4+. C: corresponding apical and paracellular fluxes with a positive flux being a reabsorptive flux.
Results in Fig. 8A indicate that, with low NH4+ in the lumen, cytosol, and serosa, the diluting ability of the TAL is greatly diminished, with an effluent [Na+] of 137 mM. This stems from overall lower fluxes through NKCC and apical NHE3 (Na+ uptake pathways), lower flux via Na+-K+/NH4+ pump (Na+ extrusion pathway), lower transepithelial membrane potential, and higher luminal K+. Eliminating NKCC as an NH4+uptake pathway also reduces the dilution but not as dramatically as in the previous case (outflow just above 50 mM). Specifically, in this case ammonium permeates through the apical and basolateral K+ channels, enters via the basolateral Na+-K+/NH4+ pump, and is extruded via apical and basolateral NHE3. Figure 8B shows that the reward for poor diluting ability is higher efficiency, which just reflects the fact that high luminal Na+ concentrations reduce paracellular backleak. There, although we observe the same trend for efficiency that was pointed out above (Fig. 7), the cases in which NH4+ cycling was impaired have a higher efficiency in the outer medulla. This result was unexpected at first, but its origin is revealed in Fig. 7C. Figure 8C shows Na+ fluxes along the TAL segment with positive flux indicating net reabsorption (lumen to serosa). From Fig. 8C and from the definition of the efficiency measure (Eq. 10), the higher efficiency for the diminished NH4+cycling cases is explained by a reduction of the net apical flux. In other words, when the NH4+ cycling is reduced, the transcellular and paracellular fluxes are closer to one another. This increases the efficiency but at the expense of reducing transcellular transport rather than increasing paracellular transport, and this ultimately leads to poor tubular fluid dilution. The possibility that this presents is that it may not be possible to have a highly efficient TAL, in terms of paracellular vs. transcellular transport, without sacrificing diluting ability.
Motivated by recent findings (20, 41) that suggest that the osmolarity of tubular fluid in descending thin limbs may be lower than the medullary interstitium, we explored the impact on Na+ transport efficiency of the transepithelial osmolarity gradient in the outer medulla. We did a series of simulations for which the luminal NaCl concentration at the TAL inlet was changed (the inlet of the TAL is at the inner-outer medullary boundary). These changes were perturbations around the baseline values in Fig. 3. The results are in Fig. 9. It is clear from Fig. 9 that increasing the NaCl concentration at the TAL inlet raises the efficiency because of the reduction in transepithelial chemical gradient and that if the tubular NaCl is high compared with serosa, then paracellular transport will favor Na+ reabsorption. However, we still observe the nonmonotonic trend in efficiency where the maximum is close to the cortico-medullary junction and the global minimum is at the end of the segment in the cortical region.
Fig. 9.
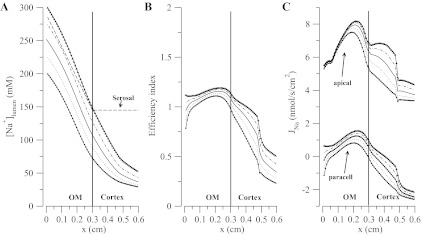
A: dashed line is the serosal concentration profile, and the rest are the luminal concentration profiles for different boundary conditions for NaCl where the solid line is the baseline case. B: corresponding efficiencies. C: corresponding apical and paracellular fluxes with a positive flux being a reabsorptive flux.
TAL-TGF system and transport efficiency.
Figures 5 and 7 show that CVR may result in a distribution of Na+ transport that establishes an axial luminal Cl− gradient consistent with the known flow dependency of TAL outflow [Na+] (40) and to account for the gain of the TGF system (12, 29, 39). In addition, Fig. 7 shows that CVR responses raise transport efficiency in part of the outer medulla and cortical regions by limiting the degree of tubular dilution. Another system that monitors tubular fluid dilution and can alter the luminal axial Na+ gradient by adjusting TAL flow is the TGF system. This motivated us to add the TGF loop Eqs. 4 and 6 to the TAL model Eqs. 1 and 2, to analyze the impact of this intranephron reflex on the distribution of transport and the efficiency along the length of the TAL. Table 6 shows the parameters for the TGF system.
Table 6.
Tubuloglomerular feedback parameters
| Description | Value | Reference | |
|---|---|---|---|
| k | Sensitivity of TGF response, mM−1 | 0.1625 | N/A |
| Cop | Steady-state [Cl−]MD, mM | 28.4 | N/A |
| Qop | Steady-state SNGFR, nl/min | 30.0 | (5) |
| ΔQ | TGF-mediated range of SNGFR, nl/min | 18.0 | (22, 35) |
| τ | Pure delay interval at JGA, s | 2.00 | (3, 25) |
| τd | Distributed delay interval at JGA, s | 3.00 | (3, 25) |
TGF, tubuloglomerular feedback; JGA, juxta-glomerular apparatus.
The TGF system regulates TAL flow by sensing TAL outflow [Cl−]. Figure 10 shows the effect TGF on ε. Starting from the 4 nl/min inflow steady-state profile which exhibits low transport efficiency (see Fig. 5), we closed the TFG loop and let the TAL-TGF system reach a steady-state. We examined two TGF modes: a low-gain mode (sensitivity of TGF response, k = 0.12; see Eq. 5), and a high-gain mode (k = 0.1625) that triggered limit-cycle oscillations in TAL flow [as observed in experiments by Holstein-Rathlou and Marsh (13)]. Model predictions summarized in Fig. 10 indicate that TGF, in both low- and high-gain cases, increases ε by readjusting the tubular inflow such that very low luminal Na+ concentrations near static head are avoided. As a result the dynamic gain of the TGF system, which depends in part on the slope of the axial Cl− gradient at the end of the TAL, also increases.
Fig. 10.

A: dotted line is the serosal profile, solid line is the case with 4 nl/min inflow, dotted line is low-gain TGF, and dot-dashed and asterisked lines correspond to high-gain TGF, with oscillating macula densa Na+ concentration at minimum and maximum, respectively. C: apical and paracellular fluxes are shown (positive flux is reabsorption).
The increase in efficiency is explained, in part, by Fig. 10C, which shows greater transcellular reabsorption and slightly smaller backleak in the cortical regions. To understand those trends we consider the transit time, that is, the amount of time that a fluid particle takes to travel the length of the TAL. A higher flow rate implies a shorter transit time, and as seen on Fig. 5, a more even workload distribution. This (as shown in Figs. 5 and 6) simultaneously raises the concentration profiles along the TAL, which reduces paracellular backleak and yields a less diluted outflow. Together, the CVR responses and the regulation of TAL flow by TGF result in a quasi-uniform distribution of NaCl transport and an axial [Cl−] gradient sufficiently steep to yield a TGF system gain consistent with experimental data.
DISCUSSION
A major function of the TAL is to reabsorb NaCl to build and sustain the interstitial osmolarity gradient that drives passive water reabsorption from the collecting duct and generates a concentrated urine. As much as 90% of the NaCl flow entering the thick limb is reabsorbed along the medullary and cortical TAL, with a part of that reabsorption driven metabolically, via Na+-K+-ATPase, against a substantial electrochemical gradient. Thus, relative to other tubular segments, the TAL has a high metabolic need. However, the availability of oxygen is limited in the rat kidney, with renal O2 tension ranging from 40 to 50 mmHg in the cortex to ∼20 mmHg in the outer medulla. With the oxygen supply to the renal medulla barely exceeding its oxygen consumption (7), the kidney is particularly vulnerable when hypoperfused, because the associated hypoxia can lead to localized tissue injury. The availability of oxygen to mTALs is further limited by their distance from the oxygen-supplying descending vasa recta. Anatomic findings (18, 19) have revealed a highly structured organization of tubules and vessels in the rat outer medulla, in which the vasa recta form tightly packed vascular bundles that appear to dominate the histotopography of the outer medulla, especially in the inner stripe, and in which collecting ducts and mTALs are found distant from the vascular bundles. As a result, under experimental conditions resulting in reduced medullary O2 tension, mTALs are the most injured segments (7, 8). Taken together, the high metabolic demands of the mTAL and the low oxygen tension make the efficiency of NaCl transport an important issue.
Our TAL model predicts that TAL transport efficiency is affected by the distribution of Na+ transport and that cell volume regulatory responses influences workload distribution along the TAL. Our representation of CVR is based on recent experimental findings in nonepithelial cells and nonrenal secretory epithelial cells that indicate that reciprocal regulation of NKCC1 (a KCl loading pathway) and the potassium chloride cotransporter (KCC) (a KCl exit pathway) stabilizes cell volume and intracellular chloride. These responses are mediated by a chloride-sensitive signaling pathway that involves WNK and Ste20-type serine/threonine kinases (14, 15). This mechanism also appears to mediate CVR in mTAL cells, as WNK-3 has been shown to enhance phosphorylation of the renal NKCC2 isoforms (34). Regardless of the mechanism, in TAL cells where the KCl loading and exit pathways are on different membranes, this CVR mechanism also balances apical uptake with KCl extrusion capacity. This permits TAL cells to adapt to variations in local availability of metabolic substrates and luminal ion concentrations. This would not only protect the cells from ischemia, but our model also predicts that it distributes the reabsorptive workload along the length of the TAL, an effect that is needed to generate an axial tubular fluid gradient in Na+ concentration. There is indirect evidence that an axial gradient is present. The well-known flow dependency of TAL effluent [Na+] (see Fig. 3 in Ref. 22) requires an axial TAL concentration gradient, and the gain of the TGF system is strongly influenced by the magnitude of that gradient (23).
TAL transport efficiency.
The standard textbook model (1, 11) proposes that the TAL efficiently reabsorbs Na+ from the luminal fluid because of paracellular electrodiffusion of Na+ driven by a transepithelial membrane potential established by K+ cycling across the apical membrane of TAL cells. However, our model predicts that this elegant scheme is complicated by several factors including CVR, NH4+ transport and the transepithelial chemical gradient established by the tubular fluid dilution. The complexity of solute transport along the TAL and the inability of the K+ cycling scheme to raise efficiency were observed using our TAL cell model (31). That model predicted that efficiency drops conspicuously as the luminal concentration decreases (Fig. 12 of Ref. 31) and that not even a substantially positive transepithelial potential can blunt the backleak in the distal TAL where the tubular fluid is very dilute with respect to the interstitium. The TAL model presented here yielded the same result. Nevertheless, the following observations are noteworthy.
First, when cells regulate their volume and when the TGF system is enabled, transport efficiency, albeit low (i.e., far from 2), is still higher than the non-CVR or non-TGF cases, in particular in the cortical region (see Figs. 7 and 8). Second, CVR and the TGF system work synergistically to increase transport efficiency by distributing the transport workload and by ensuring that TAL flow is sufficiently high to keep luminal [Na+] well above static head. Third, “perfect” cycling of K+ might raise the transport efficiency substantially. By “perfect” we mean that all K+ reabsorbed by NKCC2 is extruded by apical K+ channels. If so, a stronger transepithelial electrical potential would develop and enhance paracellular reabsorption. Close spatial association or direct interaction between the NKCC2 transporter and the K+ channels within the apical membrane could provide a means to enhance K+ cycling back into the lumen. In the model, this possibility could be examined by creating a cytosolic subcompartment that delays mixing of K+ transported in the cytosol, but experimental verification would be essential. Fourth, when NH4+ cycling is abolished, higher transport efficiency is obtained but at the expense of poor dilution of tubular fluid by our TAL model (Fig. 8). Thus the role of NH4+ and of the associated pH control mechanism particularly the NHE3 transporter must be taken into account. Apical membrane ammonium cycling, while preventing luminal K+ depletion, also increases NHE3 Na+ uptake, which reduces transport efficiency. These findings, along with the volume sensitivity of NHE3 (6), suggest a complicated but interesting interaction between the regulation of pH, cell volume, and transport efficiency. Finally, our model predicts that CVR may play an important role in the functional organization of the TAL. By defending its volume, each cell selects NKCC2 and KCC transporter activities that produce physiologically reasonable behavior for the ensemble of cells. This greatly facilitated the development of the present TAL model in that explicit parameter tuning in each cell was not necessary.
CVR and TGF gain.
Our model simulations using baseline parameters suggest that in the absence of CVR and with NKCC2 activity defaulting to a preset maximum (see Fig. 2), NaCl transport in the outer medulla may be so vigorous that transcellular NaCl reabsorption equals paracellular electrodiffusive NaCl backleak in cortical TAL near the macula densa (see Fig. 5). This rather extreme case was chosen because it illustrates the effect of the TAL luminal [Cl−] profile near the macula densa reaching “static head” (4), a condition of essentially constant concentration along the TAL near the macula densa. In this situation, variations in TAL luminal fluid inflow would have no impact on [Cl−] at the macula densa, no TGF signal would be generated, and transport efficiency would be zero. If the TGF loop were closed and functional, TAL inflow would increase to better match the NaCl load entering the TAL with its transport capacity. The result is an increase in transport efficiency and the establishment of a more linear axial Na+ gradient. On the other hand, if CVR is disabled but NKCC2 density defaults to a preset minimum, flow dependence of TAL outflow concentration is observed but at the expense of tubular dilution. In this case, with an active TGF loop, TAL inflow would be decreased to better match the load of Na+ with TAL transport capacity. The result is a decrease in transport efficiency but more appropriate dilution of the tubular fluid. In contrast, with CVR active, the model predicted flow dependence of [Na+], [Cl−], and [K+] that is comparable to experimental measurements by Vallon et al. (40). The controlled variable of the TGF system is the [Cl−] of the TAL effluent (36), and the gain of the TGF system is determined by the axial Cl− gradient. CVR, by distributing the transport workload, and the TGF system, by balancing TAL Na+ load with transport capacity, act together to keep TGF gain high. This also elevates cortical TAL transport efficiency.
Comparison with previous models.
A detailed comparison with a TAL cell model developed by Weinstein and Krahn (43) is presented in (31). Here we compare our model with the in vivo TAL model by Weinstein (42). First, the luminal diameter used in Weinstein's model is the same as ours but the segment length is shorter (4 mm vis-a-vis 6 mm), with the outer medulla and the cortex taken to be 2 mm each, whereas ours are 3 mm each. In part, the differences in length explain the differences in outflow concentrations of major solutes between the models. Weinstein's model (42) predicted higher Na+, K+, and Cl− outflow concentrations compared with ours: 69.0 vs. 36.6 mM for Na+; 2.05 vs. 1.9 mM for K+; and 57.4 vs. 28.4 mM for Cl−. However, if we compare the tubular concentrations at 4 mm from TAL inlet (which is the TAL outlet in Weinstein's model but not in ours) then we have similar outflow concentrations: 69.0 vs. 69.0 mM for Na+; 1.60 vs. 2.05 mM for K+; and 54.7 vs. 57.4 mM for Cl−. Additionally, the two models predict luminal concentration profiles that are similarly monotonic (cf. Fig. 3 with Fig. 8 in Ref. 42). It is noteworthy that, in terms of monotonicity, only the ammonium profile near the TAL inlet differs significantly from the ammonium profile in Fig. 8 of (42). The divergence arises from the different isoform distributions and binding affinities of the NKCC2 models used in the two modeling studies. Nevertheless, both modeling studies (Weinstein and ours) agree with experimental findings about NKCC2 isoform expression along the TAL (32, 33, 44), and the differences in the concentration profiles, even for NH4+ (see above), are relatively minor. Finally, as discussed in the companion study, the transport parameter values of the cells that comprise the TAL models differ in magnitude between the Weinstein's models and ours but have the similar relationships between the various solutes. Nevertheless, both models predict behaviors that are physiological reasonable given the limited functional data available for the TAL segment. This suggests that the functional characteristics of the TAL are robust with respect to modest variation in transport parameter values.
Limitations and further extensions.
Our model assumes that the serosal concentrations are known at each level along the corticomedullary axis. A natural extension would be to embed the current TAL model into a model of the outer medulla. Such a model would include collecting ducts, a descending limb, capillary blood flow, and an interstitium whose composition is determined by the balance of solute and water reabsorption from all these structures. Also, a minimal model of cell metabolism and ATP production and utilization would permit a more thorough examination of the efficiency of the TAL on a metabolic basis, as opposed to the simple measure we have employed here. That model would permit a more direct study of the interaction between blood flow, oxygen availability, and TAL function including transport efficiency. Additionally, the model in its current form can be used to determine the relation between the dynamic features of the TGF-TAL system (e.g., the establishment of limit cycle oscillations and nonlinear filtering properties of the TAL; Ref. 24) including the dynamic features of the individual TAL cells.
Finally, as discussed in the companion paper (31), additional modeling studies are needed to understand why rat cortical TAL dilutes the tubular fluid to concentrations where transport efficiency is low. It cannot be related to the urine concentrating mechanism, as the reabsorbed Na+ is taken up by the cortical peritubular capillaries. Further, in the earliest segment of the distal tubule, there is enough secretion of Na+ and Cl− to substantially increase their tubular fluid concentrations (2). Hence, the impact of the strong dilution of the tubular fluid in the cortical TAL on free water clearance would be small. One intriguing hypothesis is that the high transepithelial potential difference that develops with strong tubular fluid dilution enhances the passive paracellular reabsorption of divalent cations like Ca2+ and Mg2+.
GRANTS
This research was supported by the National Institute of Diabetes and Digestive and Kidney Diseases Grants DK-42091 and DK-89066 (to H. E. Layton and A.T. Layton, respectively) and by the National Science Foundation Grant DMS-0701412 (to A. T. Layton).
DISCLOSURES
No conflicts of interest, financial or otherwise, are declared by the author(s).
ACKNOWLEDGMENTS
Portions of this work were presented in poster form at Experimental Biology 2010 (FASEB J 24: 606.8, 2010).
Footnotes
The ε can be linked to ATP consumption by assuming that all transcellular Na+ transport ultimately involve the Na-K-ATPase and that the stoichiometry of the pump yields 3 moles of Na+ translocated per moles of ATP hydrolyzed. This gives a conversion factor that maps the above ε to transport efficiency in units of moles of Na+ transported per moles of ATP used.
REFERENCES
- 1. Boron WF, Boulpaep EL. Medical Physiology (1st ed.). New York: Saunders, 2003, p. 776–780, 2003 [Google Scholar]
- 2. Briggs JP, Schnermann J, Schubert G. In situ studies of the distal convoluted tubule in the rat. I. Evidence for NaCl secretion. Am J Physiol Renal Fluid Electrolyte Physiol 243: F160–F166, 1982 [DOI] [PubMed] [Google Scholar]
- 3. Casellas D, Moore LC. Autoregulation and tubuloglomerular feedback in juxtamedullary glomerular arterioles. Am J Physiol Renal Fluid Electrolyte Physiol 258: F660–F669, 1990 [DOI] [PubMed] [Google Scholar]
- 4. Corcia W, Caplan SR. Effect of furosemide on the thermodynamic parameters of frog skin. Am J Physiol Renal Fluid Electrolyte Physiol 243: F588–F592, 1982 [DOI] [PubMed] [Google Scholar]
- 5. de Rouffignac C, Bonlavet JP. Variations in glomerular filtration rate of single superficial and deep nephrons under various conditions of sodium intake in the rat. Pflügers Arch 317: 141–156, 1970 [DOI] [PubMed] [Google Scholar]
- 6. Demaurex N, Grinstein S. Na+/H+ antiport: modulation by ATP and role in cell volume regulation. J Exp Biol 196: 389–404, 1994 [DOI] [PubMed] [Google Scholar]
- 7. Epstein F. Oxygen and metabolism. Kidney Int 51: 381–385, 1997 [DOI] [PubMed] [Google Scholar]
- 8. Epstein F, Brezis M, Silva P, Rosen S. Physiological and clinical implications of medullary hypoxia. Artif Organs 11: 463–467, 1987 [DOI] [PubMed] [Google Scholar]
- 9. Giménez I, Isenring P, Forbush B. Spatially distributed alternative splice variants of the renal Na-K-Cl cotransporter exhibit dramatically different affinities for the transported ions. J Biol Chem 277: 8767–8770, 2002 [DOI] [PubMed] [Google Scholar]
- 10. Greger R. Ion transport mechanisms in thick ascending limb of Henle's loop of mammalian nephron. Physiol Rev 65: 760–797, 1985 [DOI] [PubMed] [Google Scholar]
- 11. Greger R, Schlatter E. Properties of the lumen membrane of the cortical thick ascending limb of Henle's loop of the rabbit kidney. Pflügers Arch 396: 315–324, 1983 [DOI] [PubMed] [Google Scholar]
- 12. Holstein-Rathlou NH. A closed-loop analysis of the tubuloglomerular feedback mechanism. Am J Physiol Renal Fluid Electrolyte Physiol 261: F880–F889, 1991 [DOI] [PubMed] [Google Scholar]
- 13. Holstein-Rathlou NH, Marsh DJ. Oscillations in tubular pressure, flow, and distal chloride concentration. Am J Physiol Renal Fluid Electrolyte Physiol 256: F1007–F1014, 1989 [DOI] [PubMed] [Google Scholar]
- 14. Kahle KT, Gimenez I, Hassan H, Wilson FH, Wong RD, Forbush B, Aronson PS, Lifton RP. WNK4 regulates apical and basolateral Cl− flux in extrarenal epithelia. Proc Natl Acad Sci USA 101: 2064–2069, 2004 [DOI] [PMC free article] [PubMed] [Google Scholar]
- 15. Kahle KT, Rinehart J, Ring A, Gimenez I, Gamba G, Hebert SC, Lifton RP. WNK protein kinases modulate cellular Cl− flux by altering the phosphorylation state of the Na-K-Cl and K-Cl cotransporters. Physiology (Bethesda) 21: 326–335, 2006 [DOI] [PubMed] [Google Scholar]
- 16. Knepper MA, Danielson RA, Saidel GM, Post RS. Quantitative analysis of renal medullary anatomy in rats and rabbits. Kidney Int 12: 313–323, 1977 [DOI] [PubMed] [Google Scholar]
- 17. Komlosi P, Fintha A, Bell P. Unraveling the relationship between macula densa cell volume and luminal solute concentration/osmolality. Kidney Int 70: 865–871, 2006 [DOI] [PubMed] [Google Scholar]
- 18. Kriz W. Der architektonische und funktionelle Aufbau der Rattenniere. Z Zellforsch Mikrosk Anat 82: 495–535, 1967 [PubMed] [Google Scholar]
- 19. Kriz W, Schnermann J, Koepsell H. The position of short and long loops of Henle in the rat kidney. Z Anat Entwickl-Gesch 138: 301–319, 1972 [DOI] [PubMed] [Google Scholar]
- 20. Layton AT, Layton HE, Dantzler WH, Pannabecker TL. The mammalian urine concentrating mechanism: hypotheses and uncertainties. Physiology 24: 250–256, 2009 [DOI] [PubMed] [Google Scholar]
- 21. Layton HE. Mathematical models of the mammalian urine concentrating mechanism. In: Membrane Transport and Renal Physiology, edited by Layton HE, Weinstein AM. New York: Springer, 2002, p. 233–272 [Google Scholar]
- 22. Layton HE, Pitman EB, Moore LC. Bifurcation analysis of TGF-mediated oscillations in SNGFR. Am J Physiol Renal Fluid Electrolyte Physiol 261: F904–F919, 1991 [DOI] [PubMed] [Google Scholar]
- 23. Layton HE, Pitman EB, Moore LC. Instantaneous and steady-state gains in the tubuloglomerular feedback system. Am J Physiol Renal Fluid Electrolyte Physiol 268: F163–F174, 1995 [DOI] [PubMed] [Google Scholar]
- 24. Layton HE, Pitman EB, Moore LC. Nonlinear filter properties of the thick ascending limb. Am J Physiol Renal Physiol 273: F625–F634, 1997 [DOI] [PubMed] [Google Scholar]
- 25. Layton HE, Pitman EB, Moore LC. Spectral properties of tubuloglomerular feedback system. Am J Physiol Renal Physiol 273: F635–F649, 1997 [DOI] [PubMed] [Google Scholar]
- 26. Layton HE, Pitman EB, Moore LC. Limit-cycle oscillations and tubuloglomerular feedback regulation of distal sodium delivery. Am J Physiol Renal Physiol 278: F287–F301, 2000 [DOI] [PubMed] [Google Scholar]
- 27. LeVeque RJ, Yee HC. A study of numerical methods for hyperbolic conservation laws with stiff source terms. J Comput Phys 86: 187–210, 1990 [Google Scholar]
- 28. Marcano M, Yang H, Nieves-Gonzalez A, Clausen C, Moore LC. Parameter estimation for mathematical models of NKCC2 cotransporter isoforms. Am J Physiol Renal Physiol 296: F369–F381, 2009 [DOI] [PMC free article] [PubMed] [Google Scholar]
- 29. Moore LC, Mason J. Perturbation analysis of tubuloglomerular feedback in hydropenic and hemorrhaged rats. Am J Physiol Renal Fluid Electrolyte Physiol 245: F554–F563, 1983 [DOI] [PubMed] [Google Scholar]
- 30. Moore LC, Schnermann J, Yarimizu S. Feedback mediation of SNGFR autoregulation in hydropenic and DOCA- and salt-loaded rats. Am J Physiol Renal Fluid Electrolyte Physiol 237: F63–F74, 1979 [DOI] [PubMed] [Google Scholar]
- 31. Nieves-González A, Clausen C, Marcano M, Layton AT, Layton HE, Moore LC. Fluid dilution and efficiency of Na+ transport in a mathematical model of a thick ascending limb cell Am J Physiol Renal Physiol (Frist published October 24, 2012). doi:10.1152/ajprenal.00100.2012 [DOI] [PMC free article] [PubMed] [Google Scholar]
- 32. Payne JA, Forbush B., 3rd Alternatively spliced isoforms of the putative renal Na-K-Cl cotransporter are differentially distributed within the rabbit kidney. Proc Natl Acad Sci USA 91: 4544–4548, 1994 [DOI] [PMC free article] [PubMed] [Google Scholar]
- 33. Plata C, Meade P, Vázquez N, Hebert SC, Gamba G. Functional properties of the apical Na+-K+-2Cl− cotransporter isoforms. J Biol Chem 277: 11004–11012, 2002 [DOI] [PubMed] [Google Scholar]
- 34. Rinehart J, Kahle KT, de los Heros P, Vazquez N, Meade P, Wilson FH, Hebert SC, Gimenez I, Gamba G, Lifton RP. WNK3 kinase is a positive regulator of NKCC2 and NCC, renal cation-Cl cotransporters required for normal blood pressure homeostasis. Proc Natl Acad Sci USA 102: 16777–16782, 2005 [DOI] [PMC free article] [PubMed] [Google Scholar]
- 35. Schnermann J, Briggs JP. Function of the juxtaglomerular apparatus: local control of glomerular hemodynamics. In: The Kidney: Physiology and Pathology, edited by Seldin DW, Giebish G. New York: Raven, 1985, p. 669–697 [Google Scholar]
- 36. Schnermann J, Briggs JP. Function of the juxtaglomerular apparatus: control of glomerular hemodynamics and renin secretion. In: Seldin and Giebisch's The Kidney: Physiology and Pathophysiology (4th ed.), edited by Alpern RJ, Hebert SC. Amsterdam; Boston: Elsevier Academic, 2008, p. 589–626 [Google Scholar]
- 37. Schnermann J, Steipe B, Briggs JP. In situ studies of distal convoluted tubule in rat. II. K secretion. Am J Physiol Renal Fluid Electrolyte Physiol 252: F970–F976, 1987 [DOI] [PubMed] [Google Scholar]
- 38. Thomas JW. Numerical Partial Differential Equations: Finite Difference Methods (1st ed.). New York: Springer, 1995 [Google Scholar]
- 39. Thomson SC, Blantz RC. Homeostatic efficiency of tubuloglomerular feedback in hydropenia, euvolemia, and acute volume expansion. Am J Physiol Renal Fluid Electrolyte Physiol 264: F554–F563, 1993 [DOI] [PubMed] [Google Scholar]
- 40. Vallon V, Osswald H, Blantz RC, Thomson S. Potential role for luminal potassium in tubuloglomerular feedback. J Am Soc Nephrol 8: 1831–37, 1997 [DOI] [PubMed] [Google Scholar]
- 41. Wade JB, Lee AJ, Ecelbarger CA, Mitchell C, Bradford AD, Terris J, Kim GH, Knepper MA. UT-A2: a 55-kDa urea transporter in thin descending limb whose abundance is regulated by vasopressin. Am J Physiol Renal Physiol 278: F52–F62, 2000 [DOI] [PubMed] [Google Scholar]
- 42. Weinstein AM. A mathematical model of rat distal ascending Henle limb. III. Tubular function. Am J Physiol Renal Physiol 298: F543–F556, 2010 [DOI] [PMC free article] [PubMed] [Google Scholar]
- 43. Weinstein AM, Krahn TA. A mathematical model of rat distal ascending Henle limb. II. Epithelial function. Am J Physiol Renal Physiol 298: F525–F542, 2010 [DOI] [PMC free article] [PubMed] [Google Scholar]
- 44. Yang T, Huang YG, Singh I, Schnermann J, Briggs JP. Localization of bumetanide- and thiazide-sensitive Na-K-Cl cotransporters along the rat nephron. Am J Physiol Renal Fluid Electrolyte Physiol 271: F931–F939, 1996 [DOI] [PubMed] [Google Scholar]