

Abstract
In angiotensin II (ANG II) infusion hypertension, there is an augmentation of intratubular angiotensinogen (AGT) and ANG II leading to increased urinary AGT and ANG II excretion rates associated with tissue injury. However, the changes in urinary AGT and ANG II excretion rates and markers of renal injury during physiologically induced stimulation of the renin-angiotensin system (RAS) by a low-salt diet remain unclear. Male Sprague-Dawley rats received a low-salt diet (0.03% NaCl; n = 6) and normal-salt diet (0.3% NaCl, n = 6) for 13 days. Low-salt diet rats had markedly higher plasma renin activity and plasma ANG II levels. Kidney cortex renin mRNA, kidney AGT mRNA, and AGT immunoreactivity were not different; however, medullary renin mRNA, kidney renin content, and kidney ANG II levels were significantly elevated by the low-salt diet. Kidney renin immunoreactivity was also markedly increased in juxtaglomerular apparati and in cortical and medullary collecting ducts. Urinary AGT excretion rates and urinary ANG II excretion rates were not augmented by the low-salt diet. The low-salt diet caused mild renal fibrosis in glomeruli and the tubulointerstitium, but no other signs of kidney injury were evident. These results indicate that, in contrast to the response in ANG II infusion hypertension, the elevated plasma and intrarenal ANG II levels caused by physiological stimulation of RAS are not reflected by increased urinary AGT or ANG II excretion rates or the development of renal injury.
Keywords: urinary angiotensinogen, urinary angiotensin II, kidney injury markers, renin expression, collecting duct renin
previous studies have demonstrated that chronic ANG II infusions to normal rats significantly increase urinary excretion of endogenous ANG II in a time-dependent manner that is mediated by ANG II type 1 (AT1) receptors (48). While juxtaglomerular cell and plasma renin activities (PRA) are markedly reduced by ANG II infusions (44, 48), the renin mRNA and protein in principal cells of collecting ducts are increased (10, 44). Chronic ANG II infusion also results in significant increases in renal expression of angiotensinogen (AGT) mRNA and protein (26, 27). Furthermore, urinary excretion of AGT is significantly increased in a dose- and time-dependent manner in association with enhancement of intrarenal AGT and ANG II levels (28).
The augmentation of the intrarenal renin-angiotensin system (RAS) during ANG II infusion hypertension leads to the progressive development of renal injury as evidenced by increased oxidative stress, glomerular and interstitial fibrosis, mesangial expansion, cellular proliferation, and macrophage accumulation (33). These results support the hypothesis that urinary excretion of AGT and/or ANG II serves as an index of intrarenal ANG II production in ANG II infusion hypertension (30, 48) and contribute to the development of renal injury. However, the changes in urinary AGT and ANG II excretion rates during physiologically induced stimulation of the RAS in normal rats remain unclear. In ANG II-infused rats, there is significant kidney mesangial expansion, collagen deposition, and macrophage infiltration and cell proliferation (33), which may contribute to renal injury. Because these changes are prevented by blockade of the RAS, they have been attributed to being mediated solely by AT1 receptor activation. If this was true, the effects of RAS stimulation by a low-salt diet on renal histology in normotensive rats should be similar. A low-salt diet activates the RAS, increases oxidative stress via NADPH oxidase, attenuates nitric oxide bioavailability in the heart (51), and increases prorenin receptor (PRR) expression in kidney tissues (20). However, the overall responses of the intratubular RAS and other markers of renal inflammation and injury have not been assessed.
A low-salt diet produces a pronounced stimulation of both circulating and renal RAS, which induces an elevation in PRA associated with increases in ANG I and ANG II levels in plasma, kidneys, and other organs throughout the body (6, 22, 23). Although salt restriction enhances AGT mRNA expression in the kidney (21, 24, 49), there is a decrease in plasma AGT levels, which could be due to a higher consumption of AGT by the elevated plasma renin (6, 22, 23). Because there is little information on the intratubular RAS and development of renal injury, the objective of this study was to evaluate in a comprehensive manner the effects of physiological activation of the RAS by a low-salt diet on the intratubular RAS, in particular, as reflected by the urinary AGT and ANG II excretion rates and markers of renal injury in normal rats.
MATERIALS AND METHODS
Animal preparation.
The experimental protocol was approved by the Animal Care and Use Committee at Tulane University. Male Sprague-Dawley rats weighing 350–380 g (Charles River Laboratories) were housed in metabolic cages and maintained in a temperature-controlled room regulated on a 12-h light/dark cycle with free access to water. Rats were divided at random into two groups and placed on a normal-salt diet (NS group, 0.3% NaCl; Ralston Purina; n = 6) or a low-salt diet (LS group, 0.03% NaCl; Dyets; n = 6). Systolic blood pressure (SBP) was measured every 3 days in conscious rats by tail-cuff plethysmography (IITC Life Science). The rats were euthanized by conscious decapitation on day 13, trunk blood was collected, and the kidneys were immediately removed, quickly weighed, and homogenized in methanol. The time delay between decapitation and homogenization of the kidneys did not exceed 60 s.
Collection and extraction of blood, kidney, and urine samples.
Trunk blood was collected in chilled tubes containing a mixed inhibitor solution (final concentration: 5 mmol/l of EDTA, 20 μmol/l of pepstatin A, 10 μmol/l of PMSF, 20 μmol/l of enalaprilat, and 1.25 mmol/l of 1,10-phenanthroline). After centrifugation at 4°C for 10 min at 1000 g, plasma was separated and applied to phenyl-bonded solid-phase extraction columns (Bond-Elut, Varian) that had been prewashed with 90% methanol followed by water. After sample application, each solid-phase extraction column was washed sequentially with water, hexane, and chloroform. angiotensin peptides were eluted from the solid-phase extraction column with 90% methanol (48). The eluates were collected, evaporated to dryness under vacuum, and stored at −20°C until radioimmunoassay was performed.
The left kidneys were sectioned for measuring the expression of renin and AGT mRNA levels and immunohistochemistry studies. Renal cortices were dissected from inner medullae under stereomicroscopy and RNase-free conditions. For tissue ANG II measurements, half of the right kidneys were immersed in cold methanol (100%), minced, and homogenized with a polytron tissue tearor immediately after harvesting and weighing. The homogenates were centrifuged, and the supernatants from the kidney homogenates were dried overnight in a vacuum centrifuge. The dried residue was reconstituted in 1 ml of radioimmunoassay buffer (19 mmol/l of monobasic sodium phosphate, 81 mmol/l of dibasic sodium phosphate, 0.05 mol/l of sodium chloride, 0.1% BSA, 0.1% Triton X-100, and 0.01% sodium azide, pH 7.4). These samples were extracted and evaporated as described above for plasma.
Urine was collected into tubes containing the same mixed inhibitor solution as for the blood. Collection was carried out for 24 h on the day before the low-salt diet was started and on days 3, 6, 9, and 12. Urine was centrifuged, and representative 1.0-ml aliquots of the supernatants were extracted and evaporated as described above for plasma.
PRA and kidney renin content.
For PRA determinations, trunk blood was collected in chilled tubes containing EDTA (5 mmol/l). Plasma was separated and stored at −20°C until assayed with a commercially available GammaCoat Plasma Renin Activity 125I RIA kit (DiaSorin) (53). For kidney renin content (KRC) assessment, half of the right kidneys were immersed in cold KRC homogenization buffer (2.6 mM EDTA, 3.4 mM hydroxyquinoline, 5 mM ammonium acetate, 200 μM PMSF, and 0.256 μM dimercaprol), minced, and homogenized. The homogenates were centrifuged, and the supernatants were used to generate 1:1,000 dilutions that were spiked with 1 μM synthetic renin tetradecapeptide substrate, and the generated ANG I was assayed with the Diasorin PRA RIA kit.
Plasma and kidney ANG II.
The reconstituted samples were incubated with a rabbit anti-ANG II serum (Peninsula Laboratories) and 125I-radiolabeled ANG II (Perkin Elmer Life and Analytic Sciences) for 48 h at 4°C. Bound and free ANG peptides were separated by dextran-coated charcoal, and the supernatants were counted on a computer-linked gamma-counter for 3 min. The sensitivity of the ANG II assay was 0.79 fmol. For the ANG II assays, the specific binding was 78.5%, and nonspecific binding was 0.5%.
Urinary angiotensinogen.
Urinary concentrations of AGT were measured using an ELISA kit (Immuno-Biological Laboratories, Minneapolis, MS) as previously described (25, 29), and urinary excretion rates were calculated from the 24-h volumes collected.
Renal expression of AGT mRNA.
Total RNA was extracted from part of the kidney using an RNeasy Midi kit (Qiagen, Chatsworth, CA). For determination of AGT mRNA, real-time quantitative RT-PCR was then performed as described previously (27, 31).
mRNA levels of renin.
For RT-PCR purposes, first-strand cDNA synthesis was performed using 5 μg of total RNA and SuperScript II RNase H-reverse transcriptase system (Invitrogen, Life Technologies, Carlsbad, CA). Synthetic specific primers located in exons 1 and 5 of renin 1c gene (sense 5′-ATGCCTCTCTGGGCACTCTT-3′ and antisense 5′- GTCAAACTTGGCCAGCATGA-3′) were used with standard experimental conditions as previously described (43).
Histology and immunohistochemistry of kidney injury markers.
For the renin immunohistochemistry, formalin-fixed kidneys were dehydrated in gradated concentrations of alcohol, embedded in paraffin blocks, sectioned, and mounted onto slides with Vectabond (Vector Laboratories, Burlingame, CA). Serial kidney sections were immunostained by the immunoperoxidase technique with modifications as described previously (42). Renin immunolocalization was assessed using a polyclonal anti-rat specific renin antibody raised in rabbit (generously provided by Dr. Tadashi Inagami, Vanderbilt University) and an automatic robot system (DAKO, Carpinteria, CA), which allowed us to apply identical conditions to all slides. The results are expressed in arbitrary units of the relative intensity normalized to the renin immunostaining average of the normal-salt group. Immunohistochemical analysis of AGT was performed with a rabbit polyclonal anti-mouse/rat AGT antibody (Immuno-Biological Laboratories, Takasaki, Japan), using an Autostainer System (DakoCytomation, Glostrup, Denmark). For each rat, the cortical lesions in 20 consecutive microscopic fields were examined, and the intensities of AGT immunoreactivity were calculated and averaged using Image Pro Plus software (Media Cybernetics, Bethesda, MD).
Kidney sections (3 μm), paraffin-embedded, were stained with 1) Masson's trichrome (Mass Histology, Worcester, MA) for assessment of glomerular and interstitial fibrosis and 2) periodic acid-Schiff for the determination of glomerular lesions. Morphometry of glomeruli and the extent of the interstitial fibrotic area were evaluated quantitatively using computerized image analysis, as described previously (12, 35). For the immunoexpression of proliferating cell nuclear antigen and CD68, markers of cell proliferation and macrophage infiltration, respectively, monoclonal antibodies for proliferating cell nuclear antigen and CD68 were used at 1:1,000 dilutions (12, 35), respectively. All data were expressed as fold changes. All of the staining was performed by a robotic system (Autostainer; Dako, Carpinteria, CA) and analyzed using photomicrographs at ×200 or ×400 magnification from 20 different microscopic fields per tissue section per animal, and digital images were captured with a DS-U2/L2 USB camera attached to a Nikon Eclipse 50i microscope and an NIS Elements AR version 3.0 software image analyzer in a blinded manner to avoid bias.
Statistical analysis.
Results are expressed as means ± SE. Data were analyzed by repeated-measures ANOVA with post hoc Newman-Keuls multiple comparison test within each group and by one-way ANOVA with post hoc Newman-Keuls multiple comparison test between two groups. We used unpaired t-test to analyze two group data. A value of P < 0.05 was considered statistically significant.
RESULTS
Blood pressure and metabolic parameters.
Systolic blood pressures were similar at the onset of the study but were increased slightly in low-salt diet rats at day 9 (129 ± 3 vs. 115 ± 3 mmHg). However, SBP values were not statistically different from those in normal-salt diet rats by day 12 (118 ± 4 vs. 113 ± 2 mmHg; Fig. 1A). A low-salt diet induced significant decreases in water intake and urine volume compared with normal-salt diet rats (Table 1). A low-salt diet decreased urinary sodium excretion rates sharply by day 3 (20 ± 6 vs. 89 ± 16 mmol/24 h; P < 0.05) and trended even lower by day 12 (15 ± 3 vs. 85 ± 18 mmol/24 h; P < 0.05; Fig. 1B); however, serum sodium concentrations were not significantly different compared with normal-salt diet rats (Table 1).
Fig. 1.

A: comparison of systolic blood pressures (SBPs) between low-salt diet (n = 6) and normal-salt diet rats (n = 6). B: comparison of urinary sodium excretion rates in low-salt diet (n = 6) and normal-salt diet rats (n = 6). Values are means ± SE. *P < 0.05 vs. normal-salt diet rats.
Table 1.
Results of metabolic parameters on a low- and normal-salt diet for 13 days
| Parameters | Normal-Salt Diet | Low-Salt Diet |
|---|---|---|
| Body weight, g | 496.7 ± 19.2 | 498.0 ± 13.0 |
| Water intake, ml/day | 41.3 ± 3.1 | 23.7 ± 1.6* |
| Food intake, g/day | 31.4 ± 3.0 | 22.8 ± 4.4 |
| Urine volume, ml/day | 23.2 ± 4.1 | 13.0 ± 1.9* |
| Urinary osmolality, mmol/kgH2O | 1,273.6 ± 202.8 | 914.0 ± 174.3 |
| Hematocrit, % | 40.3 ± 0.7 | 41.4 ± 0.9 |
| Serum sodium, mmol/l | 145 ± 1.1 | 144 ± 0.8 |
| Urinary AGT concentration, ng/ml | 3.1 ± 0.7 | 2.6 ± 0.1 |
| Urinary ANG II concentration, fmol/ml | 165.6 ± 37.8 | 93.8 ± 5.2* |
Values are means ± SE. AGT, angiotensinogen.
P < 0.05 vs. normal-salt diet.
PRA and ANG II levels.
PRA was markedly elevated in low-salt diet rats (13.9 ± 2.7 vs. 4.3 ± 0.7 ANG I ng·ml−1·h−1 P < 0.05; Fig. 2A). Likewise compared with normal-salt diet rats, low-salt diet rats also had significantly higher plasma ANG II levels (154 ± 49 vs. 33 ± 10 fmol/ml; P < 0.05; Fig. 2B).
Fig. 2.

A: comparison of plasma renin activity in low-salt diet (n = 6) and normal-salt diet rats (n = 6). B: comparison of plasma ANG II in low-salt diet (n = 6) and normal-salt diet rats (n = 6). Values are means ± SE. *P < 0.05 vs. normal-salt diet rats.
Kidney renin content, renin mRNA, AGT mRNA, and ANG II levels.
The kidney renin content in the low-salt diet was augmented (83 ± 12 vs. 56 ± 8 ANG I generation ng/h/mg; P < 0.05; Fig. 3A) and, as previously shown (6, 23), the kidney ANG II levels were significantly elevated in the low-salt diet rats compared with the normal-salt diet rats (435 ± 57 vs. 265 ± 12 fmol/g; P < 0.05; Fig. 3B). A low-salt diet induced significantly greater expression of kidney medullary renin mRNA (287 ± 71 vs. 101 ± 17 renin-to-β-actin ratio [% control); P < 0.05], but kidney cortex renin mRNA was not significantly higher compared with normal-salt diet rats [174 ± 42 vs. 100 ± 21 renin-to-β-actin ratio (%control); P > 0.05; Fig. 4A]. In addition, the renal AGT mRNA values were not statistically different in low-salt and normal-salt diet rats (densitometric value/GAPDH mRNA value ratios of 0.6 ± 0.2 vs. 1.0 ± 0.2).
Fig. 3.

A: comparison of kidney renin content in low-salt diet (n = 6) and normal-salt diet rats (n = 6). B: comparison of kidney ANG II in low-salt diet (n = 6) and normal-salt diet rats (n = 6). Values are means ± SE. *P < 0.05 vs. normal-salt diet rats.
Fig. 4.

A: comparison of kidney cortex and medulla renin/β actin mRNA (% control) in low-salt diet (n = 6) and normal-salt diet rats (n = 6). B: quantification of the intensity of kidney renin immunoreactivity in normal-salt diet (a and c; n = 6) and low-salt diet (b and d; n = 6) rats. b: increased renin immunoreactivity in juxtaglomerular (JG) renin and cortical collecting duct cells in low-salt diet compared with normal-salt diet rats (a). d: increased renin immunoreactivity in medullary collecting duct cells in low-salt diet compared with normal-salt diet rats (c). e–g: densitometric analyses of the renin intensity immunoreactivity in JG renin, cortical collecting duct (CD) renin and medullary collecting duct renin. IHC, immunohistochemistry. Values are means ± SE. *P < 0.05 vs. normal-salt diet rats.
Kidney renin and AGT immunoreactivity.
Kidney renin immunoreactivity in juxtaglomerular apparatus [JGA; 17 ± 3 vs. 1.0 ± 0.3 densitometric units (DU); P < 0.01], cortical (4.1 ± 0.9 vs. 1.0 ± 0.3 DU; P < 0.05), and medullary (2.3 ± 0.3 vs. 1.0 ± 0.2 DU; P < 0.01) collecting duct cells in the low-salt diet were markedly increased compared with normal-salt diet rats (Fig. 4B). Kidney AGT immunoreactivity in the low-salt diet was not different from that in normal-salt diet rats (9.4 ± 1.5 vs. 10.1 ± 2.2 DU).
Urinary excretion rates of AGT and ANG II.
Urinary AGT excretion rates (28 ± 3 vs. 55 ± 7 ng/24 h; Fig. 5A) and urinary ANG II excretion rates (1,196 ± 152 vs. 3,181 ± 349 fmol/24 h; P < 0.05; Fig. 5B) in low-salt diet rats were not augmented compared with normal-salt diet rats. Urinary AGT concentration in the low-salt diet was not different from that in the normal-salt diet (2.6 ± 0.1 vs. 3.1 ± 0.7 ng/ml); however, urinary ANG II concentration was significantly lower in the low-salt diet compared with the normal-salt diet (94 ± 5 vs. 166 ± 38 fmol/ml; P < 0.05; Table 1).
Fig. 5.

A: comparison of urinary angiotensinogen (AGT) excretion rates in low-salt diet (n = 6) and normal-salt diet rats (n = 6). B: comparison of urinary ANG II excretion rates in low-salt diet (n = 6) and normal-salt diet rats (n = 6). Values are means ± SE. *P < 0.05 vs. normal-salt diet rats.
Kidney injury markers.
As shown in Fig. 6, low-salt diet rats did not show any mesangial expansion (0.7 ± 0.03 vs. 1.0 ± 0.02; P < 0.05; Fig. 6) nor cell proliferation in either the renal glomeruli (0.9 ± 0.05 vs. 1.0 ± 0.05; Fig. 6) or in the tubulointerstitium (0.4 ± 0.03 vs. 1.0 ± 0.04; P < 0.05; Fig. 6) compared with normal-salt diet rats. Indeed, low-salt diet rats had reduced levels of these markers. A low-salt diet did not increase macrophage infiltration in cortical glomeruli (1.0 ± 0.05 vs. 1.0 ± 0.04), juxtamedullary glomeruli (0.6 ± 0.05 vs. 1.0 ± 0.03; P < 0.05), or the tubulointerstitium (0.5 ± 0.05 vs. 1.0 ± 0.08; P < 0.05; Fig. 7). However, the low-salt diet rats did appear to have a mild renal fibrosis in glomeruli (2.1 ± 0.11 vs. 1.0 ± 0.07; P < 0.05) and the tubulointerstitium (1.4 ± 0.2 vs. 0.9 ± 0.1; P < 0.05; Fig. 8).
Fig. 6.
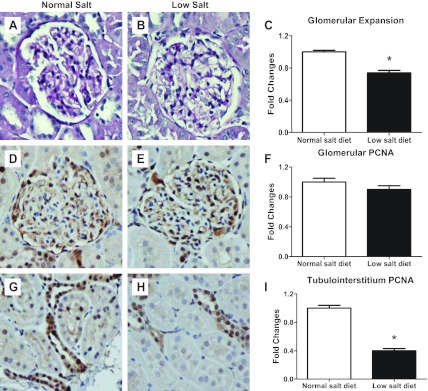
Representative photomicrographs of glomerular expansion in normal-salt diet (A) and low-salt diet (B) rats and image analysis (C). Proliferative cell nuclei antigen (PCNA) was photomicrographed in glomeruli [D: normal salt (NS); E: low salt (LS); F: image analysis] and also in the tubulointerstitium (G: NS; H: LS; I: image analysis). Values are means ± SE. *P < 0.05 vs. normal-salt diet rats.
Fig. 7.
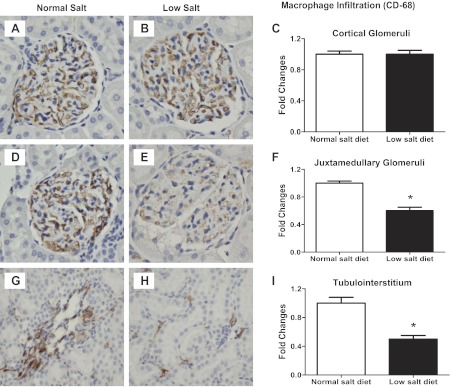
Kidney immunoexpression of CD-68 as a marker of macrophages in cortical glomeruli (A: NS; B: LS; C: image analysis), juxtamedullary glomeruli (D: NS; E: LS; F: image analysis) and the tubulointerstitium (G: NS; H: LS; I: image analysis). Values are means ± SE. *P < 0.05 vs. normal-salt diet rats.
Fig. 8.
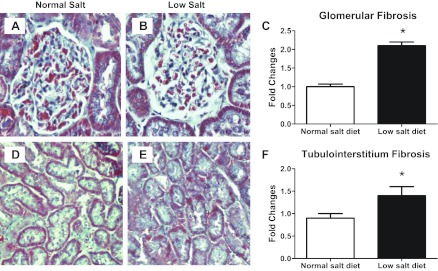
Representative photomicrographs of collagen deposition in glomeruli (A: NS; B: LS; C: image analysis) and the tubulointerstitium (D: NS; E: LS; F: image analysis). Values are means ± SE. *P < 0.05 vs. normal-salt diet rats.
DISCUSSION
The RAS is involved in the regulation of arterial pressure and electrolyte balance through the coordinated functions of both systemic and tissue systems (15, 37, 39). One of the most important physiological functions is to guard against loss of extracellular fluid sodium and volume by responding with a robust increase in renin secretion during low-salt intake (6, 23). Indeed, a few reports have shown that RAS activation by a low-salt diet may actually increase blood pressure slightly in normotensive rats without a genetic predisposition for high blood pressure, such as in two-kidney Goldblatt rats (36), uninephrectomized rats (52), and normotensive rats (19). These studies are consistent with our results that blood pressure in the low-salt group was slightly elevated. The elevated blood pressure in low-salt diet rats can be reduced by angiotensin-converting enzyme inhibitor (16), indicating that the elevation of blood pressure induced by a low-salt diet is dependant on activation of the RAS. In uninephrectomized rats, denervation of the remaining kidney markedly attenuated the rise in both the blood pressure and PRA produced by the low-salt diet, suggesting that the sympathetic nervous system is activated (52). Thus the stimulation of renin release and increased sympathetic nervous system activity may both contribute to the slightly elevated blood pressure by a low-salt diet, which collectively may be responsible for the modest fibrosis that was observed in the low-salt group.
In addition to increased renin release, the increased ANG II caused by a low-salt diet stimulates aldosterone formation and release leading to further stimulation of sodium reabsorption and decreased urinary sodium excretion rates as reflected by our data. A low-salt diet also increases the expression of various Na+ transporters in tubular cells, thus augmenting the overall renal sodium reabsorption capacity (8, 34). Ingert et al. (23) reported that intact plasma AGT levels were decreased in low-salt diet rats due to a higher consumption of AGT by the elevated circulating renin. Our data show that renin mRNA in the renal medulla was significantly elevated in low-salt diet rats, but there was no change in the renal cortex compared with normal-salt diet. Some studies also reported that the expression of renin mRNA is augmented by a low-salt diet (21, 49). Overnight sodium restriction led to a marked increase in connecting tubule immunoreactive renin, but there was no significant change in JGA renin; however, longer periods of sodium restriction stimulated renin expression in JGA (46). In the present study, the total kidney renin content was significantly elevated in low-salt rats and renin immunoreactivity was also markedly increased in JGA cells and in collecting ducts from cortex and medulla. In contrast, in ANG II-infused rats, renin immunoreactivity is suppressed in JGA cells, but the cortical and medullary collecting duct cells have increased renin immunoreactivity (43). The increased renal ANG II stimulates renin expression in collecting ducts (43). In low-salt diet rats, the increased renin activity in JG cells and collecting ducts may act cooperatively to augment the intrarenal ANG II levels.
Several studies report that a low-salt diet does not influence the expression of hepatic AGT mRNA (21, 41). It is known that renal AGT is expressed in proximal tubular cells (21, 45) and is secreted into luminal fluid (46). The action of filtered renin of systemic origin or of distal nephron renin secretion on AGT secreted locally may produce a high luminal concentration of intrarenal ANG II (38, 43), which further augments sodium reabsorption. Although ANG II levels in the kidney were increased in the low-salt diet rats, the increases are less compared with the increases in ANG II levels in ANG II-infused rats (48). The increases of ANG II levels in low-salt diet rats in our study are slightly lower in the plasma and in the kidney when compared with previous data in ANG II-infused rats (37, 48, 55). Some studies have shown that the expression of AGT mRNA is augmented by a low-salt diet (21, 49), but others have reported no changes in AGT mRNA in a low-salt diet (32, 41). Our data indicate that the expression of AGT mRNA and AGT immunoreactivity in low-salt diet rats were not different from that in rats fed a normal-salt diet. Ingert et al. (22, 23) reported that a low-salt diet significantly decreased the AGT levels in the kidney, which was also regulated by AT1 blocker, but Lantelme et al. (32) showed no difference in AGT protein expression. Although a low-salt diet and ANG II infusion both can activate the intrarenal RAS, only ANG II infusion results in increases in renal expression of AGT mRNA (27) and protein (26). Thus urinary excretion of AGT and ANG II in ANG II-infused rats is significantly increased in association with enhancement of intrarenal AGT and ANG II levels (28, 48), while the moderately elevated intrarenal ANG II levels caused by a low-salt diet do not stimulate urinary excretion of AGT and ANG II. Lantelme et al. (32) also reported that a low-salt diet does not increase urinary excretion rates of AGT in CD and C57BL/6 mice. Because a low-salt diet also increases renal tubular expression of the prorenin receptors (20), the elevated prorenin receptors may increase binding of prorenin and renin, which induces an increase in the catalytic efficiency of AGT cleavage, therefore facilitating ANG II generation (20, 40). Other reports indicate that urinary excretion of AGT reflects net tubular flow, rather than systemic RAS activity or glomerular filtration rate during sodium restriction (9, 32). Although the urinary excretion rates of AGT and ANG II reflect intrarenal production of AGT and ANG II in ANG II-infused hypertension (28, 48), under physiological conditions, this relationship may be obscured by the extent of tubular reabsorption of AGT and ANG II (32, 55). Also, low tubular flow during salt restriction may increase the duration of exposure to degradative sites, thus reducing urinary angiotensinogen and ANG II. The proximal tubular reabsorptive function and metabolism of these peptides may play a more important role than does the peptide production rate of the proximal tubular cells. In low-salt diet rats, renal expression of AT1A receptor mRNA was significantly increased (5, 24). The upregulated AT1 receptors may cause more ANG II uptake from the luminal fluid into the protected compartment endosomes that then prevent degradation and maintain a higher level of intrarenal ANG II (55), which may also contribute to the reduced urinary ANG II excretion rate and urinary ANG II concentrations. Thus the lower urinary levels could have been due to greater degradation and/or uptake of the peptide as a consequence of the slower transit time along the nephrons.
Although slight renal fibrosis was observed in low-salt diet rats, it represents only mild renal injury. The extent of renal fibrosis in the glomeruli is fourfold higher in rats fed a high salt diet and fivefold higher in ANG II-infused rats compared with our low-salt data (33). A low-salt diet activates RAS, stimulates renin release, and upregulates renal expression of the PRR via cGMP-PKG signaling pathways (20). In addition to the direct effects of increased AT1 receptor activation, the elevated renin and prorenin may directly promote fibrosis through stimulation of PRR via a Nox4-dependent mechanism (3). These studies indicate that singular increases in RAS intrarenal activity are not sufficient to cause marked renal injury as observed with chronic ANG II infusions. It appears that additional coexistent factors associated with the increased arterial pressure such as increased oxidative stress, cytokines, or immunologic and inflammatory factors may be needed to cause more overt renal injury (1, 7, 11, 13, 17, 47, 54). A low-salt diet induces the activation of RAS, and the elevated ANG II through its interaction with AT1 receptor activates NADPH oxidase to increase superoxide production and reduce nitric oxide bioactivity (14, 51), which increases oxidative stress (51). Thus both sodium restriction by activation of RAS and high-salt intake may increase reactive oxygen species production that is considered an important mechanism of organ injury (33). Accordingly inappropriate stimulation of the intrarenal RAS may be an important contributor to the development of renal injury.
In conclusion, the physiological stimulation of the intrarenal RAS by a low-salt diet does not lead to augmentation of the tubular AGT or ANG II levels as occurs in ANG II-infusion hypertension. Thus the increased urinary AGT and ANG II excretion rates that occur in the hypertensive models appear to be primarily a biomarker of pathological stimulation of the intrarenal RAS and may act synergistically with associated oxidative and inflammatory cofactors to cause hypertension and progressive development of renal injury.
Perspective
Population studies have shown that a moderate reduction in salt intake can decrease blood pressure in both hypertensive and nonhypertensive subjects (2). However, extreme sodium restriction activates the sympathetic system and markedly stimulates the RAS. Thus it is important that moderate reductions in salt intake should be considered optimal to sustain the reduced blood pressure and prevent organ injury. The long-term moderate reduction of salt intake in the general population leads to significant reduction in cardiovascular events by 25% (4) and potentiates the protective effects of angiotensin-converting enzyme inhibitors and AT1 receptor blockers (18, 50).
GRANTS
This work was supported by grants from the National Heart, Lung, and Blood Institute Grant HL-26371 and Centers of Biomedical Research Excellence Grant P20RR017659 from the Institutional Developmental Award program of the National Institute of General Medical Sciences.
DISCLOSURES
No conflicts of interest, financial or otherwise, are declared by the author(s).
AUTHOR CONTRIBUTIONS
Author contributions: W.S., D.M.S., M.C.P., and H.K. performed experiments; W.S., D.M.S., M.C.P., and H.K. analyzed data; W.S., D.M.S., M.C.P., H.K., and L.G.N. interpreted results of experiments; W.S., M.C.P., and H.K. prepared figures; W.S. drafted manuscript; W.S., D.M.S., M.C.P., H.K., and L.G.N. edited and revised manuscript; W.S. and L.G.N. approved final version of manuscript; L.G.N. conception and design of research.
ACKNOWLEDGMENTS
We thank Dr. Kayoko Miyada and Akemi Sato for technical assistance and Debbie Olavarrieta for assistance in the preparation of the manuscript.
REFERENCES
- 1.Brands MW, Banes-Berceli AK, Inscho EW, Al Azawi H, Allen AJ, Labazi H. Interleukin 6 knockout prevents angiotensin II hypertension: role of renal vasoconstriction and janus kinase 2/signal transducer and activator of transcription 3 activation. Hypertension 56: 879–884, 2010 [DOI] [PMC free article] [PubMed] [Google Scholar]
- 2.Chobanian AV, Hill M. National Heart, Lung, and Blood Institute Workshop on Sodium and Blood Pressure : a critical review of current scientific evidence. Hypertension 35: 858–863, 2000 [DOI] [PubMed] [Google Scholar]
- 3.Clavreul N, Sansilvestri-Morel P, Magard D, Verbeuren TJ, Rupin A. (Pro)renin promotes fibrosis gene expression in HEK cells through a Nox4-dependent mechanism. Am J Physiol Renal Physiol 300: F1310–F1318, 2011 [DOI] [PubMed] [Google Scholar]
- 4.Cook NR, Cutler JA, Obarzanek E, Buring JE, Rexrode KM, Kumanyika SK, Appel LJ, Whelton PK. Long term effects of dietary sodium reduction on cardiovascular disease outcomes: observational follow-up of the trials of hypertension prevention (TOHP). BMJ 334: 885–888, 2007 [DOI] [PMC free article] [PubMed] [Google Scholar]
- 5.Du Y, Yao A, Guo D, Inagami T, Wang DH. Differential regulation of angiotensin II receptor subytpes in rat kidney by low dietary sodium. Hypertension 25: 872–877, 1995 [DOI] [PubMed] [Google Scholar]
- 6.Fox J, Guan S, Hymel AA, Navar LG. Dietary Na and ACE inhibition effects on renal tissue angiotensin I and II and ACE activity in rats. Am J Physiol Renal Fluid Electrolyte Physiol 262: F902–F909, 1992 [DOI] [PubMed] [Google Scholar]
- 7.Franco M, Tapia E, Santamaria J, Zafra I, Garcia-Torres R, Gordon KL, Pons H, Rodriguez-Iturbe B, Johnson RJ, Herrera-Acosta J. Renal cortical vasoconstriction contributes to development of salt-sensitive hypertension after angiotensin II exposure. J Am Soc Nephrol 12: 2263–2271, 2001 [DOI] [PubMed] [Google Scholar]
- 8.Frindt G, Masilamani S, Knepper MA, Palmer LG. Activation of epithelial Na channels during short-term Na deprivation. Am J Physiol Renal Physiol 280: F112–F118, 2001 [DOI] [PubMed] [Google Scholar]
- 9.Gociman B, Rohrwasser A, Lantelme P, Cheng T, Hunter G, Monson S, Hunter J, Hillas E, Lott P, Ishigami T, Lalouel JM. Expression of angiotensinogen in proximal tubule as a function of glomerular filtration rate. Kidney Int 65: 2153–2160, 2004 [DOI] [PubMed] [Google Scholar]
- 10.Gonzalez AA, Liu L, Lara LS, Seth DM, Navar LG, Prieto MC. Angiotensin II stimulates renin in inner medullary collecting duct cells via protein kinase C and independent of epithelial sodium channel and mineralocorticoid receptor activity. Hypertension 57: 594–599, 2011 [DOI] [PMC free article] [PubMed] [Google Scholar]
- 11.Graciano ML, Mitchell KD. Imatinib ameliorates renal morphological changes in Cyp1a1-Ren2 transgenic rats with inducible ANG II-dependent malignant hypertension. Am J Physiol Renal Physiol 302: F60–F69, 2012 [DOI] [PMC free article] [PubMed] [Google Scholar]
- 12.Graciano ML, Mouton CR, Patterson ME, Seth DM, Mullins JJ, Mitchell KD. Renal vascular and tubulointerstitial inflammation and proliferation in Cyp1a1-Ren2 transgenic rats with inducible ANG II-dependent malignant hypertension. Am J Physiol Renal Physiol 292: F1858–F1866, 2007 [DOI] [PubMed] [Google Scholar]
- 13.Graciano ML, Nishiyama A, Jackson K, Seth DM, Ortiz RM, Prieto-Carrasquero MC, Kobori H, Navar LG. Purinergic receptors contribute to early mesangial cell transformation and renal vessel hypertrophy during angiotensin II-induced hypertension. Am J Physiol Renal Physiol 294: F161–F169, 2008 [DOI] [PMC free article] [PubMed] [Google Scholar]
- 14.Griendling KK, Sorescu D, Ushio-Fukai M. NAD(P)H oxidase: role in cardiovascular biology and disease. Circ Res 86: 494–501, 2000 [DOI] [PubMed] [Google Scholar]
- 15.Hall JE, Brands MW, Henegar JR. Angiotensin II and long-term arterial pressure regulation: the overriding dominance of the kidney. J Am Soc Nephrol 10, Suppl 12: S258–S265, 1999 [PubMed] [Google Scholar]
- 16.Hamming I, van GH, Turner AJ, Rushworth CA, Michaud AA, Corvol P, Navis G. Differential regulation of renal angiotensin-converting enzyme (ACE) and ACE2 during ACE inhibition and dietary sodium restriction in healthy rats. Exp Physiol 93: 631–638, 2008 [DOI] [PubMed] [Google Scholar]
- 17.Harrison DG, Guzik TJ, Lob HE, Madhur MS, Marvar PJ, Thabet SR, Vinh A, Weyand CM. Inflammation, immunity, hypertension. Hypertension 57: 132–140, 2011 [DOI] [PMC free article] [PubMed] [Google Scholar]
- 18.Heerspink HJ, Holtkamp FA, Parving HH, Navis GJ, Lewis JB, Ritz E, de Graeff PA, de ZD. Moderation of dietary sodium potentiates the renal and cardiovascular protective effects of angiotensin receptor blockers. Kidney Int 82: 330–337, 2012 [DOI] [PubMed] [Google Scholar]
- 19.Hettinger U, Lukasova M, Lewicka S, Hilgenfeldt U. Regulatory effects of salt diet on renal renin-angiotensin-aldosterone, and kallikrein-kinin systems. Int Immunopharmacol 2: 1975–1980, 2002 [DOI] [PubMed] [Google Scholar]
- 20.Huang J, Siragy HM. Sodium depletion enhances renal expression of (pro)renin receptor via cyclic GMP-protein kinase G signaling pathway. Hypertension 59: 317–323, 2012 [DOI] [PMC free article] [PubMed] [Google Scholar]
- 21.Ingelfinger JR, Pratt RE, Ellison K, Dzau VJ. Sodium regulation of angiotensinogen mRNA expression in rat kidney cortex and medulla. J Clin Invest 78: 1311–1315, 1986 [DOI] [PMC free article] [PubMed] [Google Scholar]
- 22.Ingert C, Grima M, Coquard C, Barthelmebs M, Imbs JL. Contribution of angiotensin II internalization to intrarenal angiotensin II levels in rats. Am J Physiol Renal Physiol 283: F1003–F1010, 2002 [DOI] [PubMed] [Google Scholar]
- 23.Ingert C, Grima M, Coquard C, Barthelmebs M, Imbs JL. Effects of dietary salt changes on renal renin-angiotensin system in rats. Am J Physiol Renal Physiol 283: F995–F1002, 2002 [DOI] [PubMed] [Google Scholar]
- 24.Jo H, Yang EK, Lee WJ, Park KY, Kim HJ, Park JS. Gene expression of central and peripheral renin-angiotensin system components upon dietary sodium intake in rats. Regul Pept 67: 115–121, 1996 [DOI] [PubMed] [Google Scholar]
- 25.Katsurada A, Hagiwara Y, Miyashita K, Satou R, Miyata K, Ohashi N, Navar LG, Kobori H. Novel sandwich ELISA for human angiotensinogen. Am J Physiol Renal Physiol 293: F956–F960, 2007 [DOI] [PMC free article] [PubMed] [Google Scholar]
- 26.Kobori H, Harrison-Bernard LM, Navar LG. Enhancement of angiotensinogen expression in angiotensin II-dependent hypertension. Hypertension 37: 1329–1335, 2001 [DOI] [PMC free article] [PubMed] [Google Scholar]
- 27.Kobori H, Harrison-Bernard LM, Navar LG. Expression of angiotensinogen mRNA and protein in angiotensin II-dependent hypertension. J Am Soc Nephrol 12: 431–439, 2001 [DOI] [PMC free article] [PubMed] [Google Scholar]
- 28.Kobori H, Harrison-Bernard LM, Navar LG. Urinary excretion of angiotensinogen reflects intrarenal angiotensinogen production. Kidney Int 61: 579–585, 2002 [DOI] [PMC free article] [PubMed] [Google Scholar]
- 29.Kobori H, Katsurada A, Miyata K, Ohashi N, Satou R, Saito T, Hagiwara Y, Miyashita K, Navar LG. Determination of plasma and urinary angiotensinogen levels in rodents by newly developed ELISA. Am J Physiol Renal Physiol 294: F1257–F1263, 2008 [DOI] [PMC free article] [PubMed] [Google Scholar]
- 30.Kobori H, Nishiyama A, Harrison-Bernard LM, Navar LG. Urinary angiotensinogen as an indicator of intrarenal angiotensin status in hypertension. Hypertension 41: 42–49, 2003 [DOI] [PMC free article] [PubMed] [Google Scholar]
- 31.Kobori H, Ozawa Y, Suzaki Y, Nishiyama A. Enhanced intrarenal angiotensinogen contributes to early renal injury in spontaneously hypertensive rats. J Am Soc Nephrol 16: 2073–2080, 2005 [DOI] [PMC free article] [PubMed] [Google Scholar]
- 32.Lantelme P, Rohrwasser A, Gociman B, Hillas E, Cheng T, Petty G, Thomas J, Xiao S, Ishigami T, Herrmann T, Terreros DA, Ward K, Lalouel JM. Effects of dietary sodium and genetic background on angiotensinogen and renin in mouse. Hypertension 39: 1007–1014, 2002 [DOI] [PubMed] [Google Scholar]
- 33.Lara LS, McCormack M, Semprum-Prieto LC, Shenouda S, Majid DS, Kobori H, Navar LG, Prieto MC. AT1 receptor-mediated augmentation of angiotensinogen, oxidative stress, and inflammation in ANG II-salt hypertension. Am J Physiol Renal Physiol 302: F85–F94, 2012 [DOI] [PMC free article] [PubMed] [Google Scholar]
- 34.Masilamani S, Wang X, Kim GH, Brooks H, Nielsen J, Nielsen S, Nakamura K, Stokes JB, Knepper MA. Time course of renal Na-K-ATPase, NHE3, NKCC2, NCC, and ENaC abundance changes with dietary NaCl restriction. Am J Physiol Renal Physiol 283: F648–F657, 2002 [DOI] [PubMed] [Google Scholar]
- 35.Miyata K, Ohashi N, Suzaki Y, Katsurada A, Kobori H. Sequential activation of the reactive oxygen species/angiotensinogen/renin-angiotensin system axis in renal injury of type 2 diabetic rats. Clin Exp Pharmacol Physiol 35: 922–927, 2008 [DOI] [PMC free article] [PubMed] [Google Scholar]
- 36.Munoz-Ramirez H, Chatelain RE, Bumpus FM, Khairallah PA. Development of two kidney Goldblatt hypertension in rats under dietary sodium restruction. Am J Physiol Heart Circ Physiol 238: H889–H894, 1980 [DOI] [PubMed] [Google Scholar]
- 37.Navar LG, Kobori H, Prieto MC, Gonzalez-Villalobos RA. Intratubular renin-angiotensin system in hypertension. Hypertension 57: 355–362, 2011 [DOI] [PMC free article] [PubMed] [Google Scholar]
- 38.Navar LG, Lewis L, Hymel A, Braam B, Mitchell KD. Tubular fluid concentrations and kidney contents of angiotensins I and II in anesthetized rats. J Am Soc Nephrol 5: 1153–1158, 1994 [DOI] [PubMed] [Google Scholar]
- 39.Navar LG, Prieto MC, Satou R, Kobori H. Intrarenal angiotensin II and its contribution to the genesis of chronic hypertension. Curr Opin Pharmacol 11: 180–186, 2011 [DOI] [PMC free article] [PubMed] [Google Scholar]
- 40.Nguyen G, Delarue F, Burckle C, Bouzhir L, Giller T, Sraer JD. Pivotal role of the renin/prorenin receptor in angiotensin II production and cellular responses to renin. J Clin Invest 109: 1417–1427, 2002 [DOI] [PMC free article] [PubMed] [Google Scholar]
- 41.Pratt RE, Zou WM, Naftilan AJ, Ingelfinger JR, Dzau VJ. Altered sodium regulation of renal angiotensinogen mRNA in the spontaneously hypertensive rat. Am J Physiol Renal Fluid Electrolyte Physiol 256: F469–F474, 1989 [DOI] [PubMed] [Google Scholar]
- 42.Prieto M, Dipp S, Meleg-Smith S, El Dahr Ss Ureteric bud derivatives express angiotensinogen and AT1 receptors. Physiol Genomics 6: 29–37, 2001 [DOI] [PubMed] [Google Scholar]
- 43.Prieto-Carrasquero MC, Harrison-Bernard LM, Kobori H, Ozawa Y, Hering-Smith KS, Hamm LL, Navar LG. Enhancement of collecting duct renin in angiotensin II-dependent hypertensive rats. Hypertension 44: 223–229, 2004 [DOI] [PMC free article] [PubMed] [Google Scholar]
- 44.Prieto-Carrasquero MC, Kobori H, Ozawa Y, Gutierrez A, Seth D, Navar LG. AT1 receptor-mediated enhancement of collecting duct renin in angiotensin II-dependent hypertensive rats. Am J Physiol Renal Physiol 289: F632–F637, 2005 [DOI] [PMC free article] [PubMed] [Google Scholar]
- 45.Richoux JP, Cordonnier JL, Bouhnik J, Clauser E, Corvol P, Menard J, Grignon G. Immunocytochemical localization of angiotensinogen in rat liver and kidney. Cell Tissue Res 233: 439–451, 1983 [DOI] [PubMed] [Google Scholar]
- 46.Rohrwasser A, Morgan T, Dillon HF, Zhao L, Callaway CW, Hillas E, Zhang S, Cheng T, Inagami T, Ward K, Terreros DA, Lalouel JM. Elements of a paracrine tubular renin-angiotensin system along the entire nephron. Hypertension 34: 1265–1274, 1999 [DOI] [PubMed] [Google Scholar]
- 47.Satou R, Gonzalez-Villalobos RA, Miyata K, Ohashi N, Katsurada A, Navar LG, Kobori H. Costimulation with angiotensin II and interleukin 6 augments angiotensinogen expression in cultured human renal proximal tubular cells. Am J Physiol Renal Physiol 295: F283–F289, 2008 [DOI] [PMC free article] [PubMed] [Google Scholar]
- 48.Shao W, Seth DM, Navar LG. Angiotensin II type 1 receptor-mediated augmentation of urinary excretion of endogenous angiotensin II in Val5-angiotensin II-infused rats. Hypertension 56: 378–383, 2010 [DOI] [PMC free article] [PubMed] [Google Scholar]
- 49.Singh I, Grams M, Wang WH, Yang T, Killen P, Smart A, Schnermann J, Briggs JP. Coordinate regulation of renal expression of nitric oxide synthase, renin, and angiotensinogen mRNA by dietary salt. Am J Physiol Renal Fluid Electrolyte Physiol 270: F1027–F1037, 1996 [DOI] [PubMed] [Google Scholar]
- 50.Slagman MC, Waanders F, Hemmelder MH, Woittiez AJ, Janssen WM, Lambers Heerspink HJ, Navis G, Laverman GD. Moderate dietary sodium restriction added to angiotensin converting enzyme inhibition compared with dual blockade in lowering proteinuria and blood pressure: randomised controlled trial. BMJ 343: d4366, 2011 [DOI] [PMC free article] [PubMed] [Google Scholar]
- 51.Suematsu N, Ojaimi C, Recchia FA, Wang Z, Skayian Y, Xu X, Zhang S, Kaminski PM, Sun D, Wolin MS, Kaley G, Hintze TH. Potential mechanisms of low-sodium diet-induced cardiac disease: superoxide-NO in the heart. Circ Res 106: 593–600, 2010 [DOI] [PMC free article] [PubMed] [Google Scholar]
- 52.Vari RC, Freeman RH, Davis JO, Sweet WD. Role of renal nerves in rats with low-sodium, one-kidney hypertension. Am J Physiol Heart Circ Physiol 250: H189–H194, 1986 [DOI] [PubMed] [Google Scholar]
- 53.Von Thun AM, Vari RC, El-Dahr SS, Navar LG. Augmentation of intrarenal angiotensin II levels by chronic angiotensin II infusion. Am J Physiol Renal Fluid Electrolyte Physiol 266: F120–F128, 1994 [DOI] [PubMed] [Google Scholar]
- 54.Zhang W, Wang W, Yu H, Zhang Y, Dai Y, Ning C, Tao L, Sun H, Kellems RE, Blackburn MR, Xia Y. Interleukin 6 underlies angiotensin II-induced hypertension and chronic renal damage. Hypertension 59: 136–144, 2012 [DOI] [PMC free article] [PubMed] [Google Scholar]
- 55.Zhuo JL, Imig JD, Hammond TG, Orengo S, Benes E, Navar LG. ANG II accumulation in rat renal endosomes during ANG II-induced hypertension: role of AT(1) receptor. Hypertension 39: 116–121, 2002 [DOI] [PubMed] [Google Scholar]