

Abstract
In cell mechanics, distinguishing the respective roles of the plasma membrane and of the cytoskeleton is a challenge. The difference in the behavior of cellular and pure lipid membranes is usually attributed to the presence of the cytoskeleton as explored by membrane nanotube extrusion. Here we revisit this prevalent picture by unveiling unexpected force responses of plasma membrane spheres devoid of cytoskeleton and synthetic liposomes. We show that a tiny variation in the content of synthetic membranes does not affect their static mechanical properties, but is enough to reproduce the dynamic behavior of their cellular counterparts. This effect is attributed to an amplified intramembrane friction. Reconstituted actin cortices inside liposomes induce an additional, but not dominant, contribution to the effective membrane friction. Our work underlines the necessity of a careful consideration of the role of membrane proteins on cell membrane rheology in addition to the role of the cytoskeleton.
Introduction
Cortical mechanics play an important role in cell fate (1). Examples include spreading, rounding-up of cells before division, or exo-/endocytosis. The cell cortex contains different interacting modules: the plasma membrane (PM), proteins embedded in the PM, and the underlying cytoskeleton (CSK). Cortical mechanics results from the combined mechanics of these modules. The PM has its own mechanical tension that is subjected to a subtle homeostasis and has been shown to govern many cellular processes (2). The actin CSK polymerizes at the PM due to nucleation promoting factors, such as the WASP family proteins (3), which are linked to specific lipids of the PM, like PIP2 in the case of WASP. The CSK is attached to the membrane through the ezrin radixin moesin, or ERM, family proteins linked to PIP2 lipids (4). Moreover, the CSK regulates its own tension, established by myosin motors able to pull on actin filaments. Understanding the respective role of each module on cortical mechanics is a difficult task.
Among the experimental techniques available to measure these parameters, micropipette aspiration gives access to the cortical tension, which reflects the tension of the CSK (1,5) and can be compared to pure lipid bilayers (6). Membrane nanotube extrusion (MNE) (7) provides both PM tension and PM-CSK attachment strength. In this technique, a membrane nanotube of diameter of ∼50 nm is formed by the application of a point force on the PM. The force required to maintain the nanotube depends on the PM elastic bending modulus κ and its effective tension, itself the sum of the PM tension σ plus the density of PM-CSK adhesion energy (8–11). MNE has thus been used to highlight the role of PM tension on cell spreading (12), exocytosis (13), motility (14), or the buffering of PM tension by caveolae (15) as well as to study PM-CSK interaction in blebbing cells (9) or how the selection of different modes of cell motility is dictated by PM-CSK interaction (10). Complementary to these static MNE studies, dynamic nanotube experiments, where tube length and extrusion speed are varied, are another way to study PM-CSK interactions. Indeed, whereas pure lipid membranes display a force independent of the extrusion velocity at moderate extension rate (17,18), the dynamical component of the force is much larger in cells (19). This difference of dynamical behavior is generally attributed to friction between PM and CSK (20–26), while the viscous dissipation within the PM is assumed to be negligible as for pure artificial lipid bilayers. In this article, we revisit this prevalent picture by dynamic MNE on various cell-based and biomimetic systems. We use a reconstitution approach as an alternative way to study cell complexity, because the mechanics of each of the modules constituting the cell cortex can be characterized separately. In particular, biomimetic liposomes encapsulating a reconstituted actin cortex (27,28) allow us to address cortical cell mechanics.
We began by comparing liposomes prepared with two different techniques: electroformation (EF) (29) and inverted emulsion (IE) (30). Their elastic bending moduli measured by static MNE are similar and so are their membrane thicknesses. However, they have very different dynamical properties; we attribute this to a tiny difference in their membrane composition that depends on the preparation technique. Then we show that the dynamical response of IE liposomes recapitulates the behavior observed for native plasma membrane spheres (PMS), which is close to the behavior observed on cells even though they do not enclose a CSK, and strikingly different from that of a pure lipid membrane. We correlate this observation with the fact that PM is far more complex than pure lipid bilayers: it consists of a mosaic of proteins, lipids, and other molecules (31) and interacts with the CSK. We analyze how the force response of these liposomes and PMS depends on nanotube length and elongation speed and highlight the timescales of force relaxation subsequent to tube elongation. Finally, we study the modification of membrane dynamics induced by a membrane-associated reconstituted actin shell in IE liposomes. Overall, these measurements show that a tiny variation of membrane composition changes drastically its dynamical response, which is of importance for the reconstitution approach based on liposomes. We also show that liposomes prepared by IE and native cell membranes devoid of CSK exhibit a dynamical force response close to that observed on a cell, and therefore that the force response obtained on cells is not solely due to the presence of the CSK but to the subtle role of PM mosaic composition. Finally, these measurements show how future MNE experiments, in particular on cells, should take into account the contribution of PM composition to the dynamics of membrane relaxation and measure the times of related characteristics.
Methods
Chemicals and materials
EPC (L-α-phosphatidylcholine from egg yolk), DOGS-NTA-Ni (1,2-dioleoyl-sn-glycero-3-[N(5-amino-1 carboxypentyl)iminodiacetic acid]succinyl nickel salt), cholesterol (ovine wool), and DSPE-PEG-Biotin (1,2-distearoyl-sn-glycero-3-phosphoethanolamine-N-[biotinyl(polyethylene glycol) 2000]) are purchased from Avanti Polar Lipids (Alabaster, AL). All other chemicals are purchased from Sigma Aldrich (St. Louis, MO). Streptavidin-coated polystyrene beads (radius R = 1.7 μm) used to pull membrane nanotubes from liposomes are obtained from Bangs Laboratories (Carmel, IN). MG132 protease inhibitor is purchased from Calbiochem (Darmstadt, Germany) and used for PMS formation.
Actin, the Arp2/3 complex, gelsolin, and actin-depolymerizing factor (ADF)-cofilin are purchased from Cytoskeleton (Denver, CO) and used without further purification. Alexa-Fluor 488-labeled actin is purchased from Molecular Probes (Eugene, OR). N-WASP fragment WWA (aa400–501, also called VVCA) is expressed as a recombinant protein in Escherichia coli BL21 (DE3) CodonPlus cells (Invitrogen, Carlsbad, CA), with an N-terminal his6 tag out of a plasmid given by D. Mullins’ laboratory (Department of Cellular and Molecular Pharmacology, University of California, San Francisco, CA). We call this fragment VVCA-His in the following. Proteins were expressed in the presence of 1 mM IPTG (isopropyl β-D-1-thiogalactopyranoside) for 2 h at 37°C and purified by chromatography on Ni-NTA Agarose (Qiagen, Venlo, The Netherlands) according to the manufacturer’s instructions.
Electroformation of liposomes
The EF method (29) is used as modified by several groups by replacing platinum wires with ITO slides (32). We prepared three types of lipid mixtures: EPC + 0.1% of DSPE-PEG-biotin, EPC/cholesterol 63:37 (mass) + 0.1% of DSPE-PEG-biotin, and EPC/DOGS-NTA-Ni/cholesterol of 58:5:37 + 0.1% of DSPE-PEG-biotin at a total concentration of 0.5 mg/mL. We also prepared a mixture of lipids (EPC/DOGS-NTA-Ni/cholesterol 58:5:37) and mineral oil 87:13 (mass) at 0.5 mg/mL. A quantity of 10 μL of the lipid (or lipid and mineral oil) solution is spread on each ITO-coated glass slide and dried in a vacuum chamber for at least 1 h. Then the two ITO slides are placed face-to-face on both sides of a 1-mm spacer to form a growth chamber. A sinusoidal voltage of 1V and 10 Hz is applied between the slides for 3 h. The liposomes are then gently aspirated from the growth chamber before transfer to the observation chamber for nanotube experiments.
Inverted emulsion-prepared liposomes
We use the protocol described in Pontani et al. (27) and Pautot et al. (30). Lipids (EPC, DOGS-NTA-Ni, cholesterol, and DSPE-PEG-biotin) are incorporated in mineral oil (M5904; Sigma Aldrich) at a molar ratio EPC/DOGS-NTA-Ni/cholesterol of 58:5:37 complemented with 0.1% of DSPE-PEG-biotin, at a total concentration of 0.5 mg/mL. A quantity of 5 mL of this oil-lipid mixture is then mixed in a sonication bath at room temperature for 30 min at a power of 30 W. Then, the oil-lipid mixture is heated to 50°C for 3 h, cooled to room temperature, and stored at 4°C until use (within one week). We use an internal buffer (0.2 mM ATP, 0.1 mM CaCl2, 10 mM HEPES at pH 7.6, 100 mg/mL dextran, 1 mM DTT (dithiothreitol), 0.5 mM DABCO (diazabicyclo[2,2,2]octane), and 280 mM sucrose) and an external buffer (10 mM HEPES at pH 7.5, 2 mM MgCl2, 0.2 mM CaCl2, 2 mM ATP, 6 mM DTT, 0.13 mM DABCO, 275 mM glucose, and 0.5 mg/mL casein), the osmolarities of which are carefully adjusted with water at 320 mOsm (Avantec Cryoscopic Osmometer; Advantec MFS, Dublin, CA) to ensure osmotic balance and obtain floppy liposomes. A water-in-oil emulsion is obtained by gentle back-and-forth aspirating a few microliters of the internal buffer together with 500 μL of phospholipid-containing oil with a Hamilton syringe. The oil-lipid mixture (30 μL) is placed in a tube on top of the same volume of the external aqueous buffer, thus allowing the assembly of a lipid monolayer at the interface. The emulsion (50 μL) is then slowly poured on top of the oil-lipid mixture, resulting in a three-layer sample with the external buffer at the bottom, the oil-lipid mixture in the middle, and the emulsion on top. The whole tube is finally centrifuged to drive the emulsion drops through the lipid monolayer (100g for 12 min).
Reconstitution of an actin cortex in liposomes
We use the protocol described in Pontani et al. (27) and Murrell et al. (33). Briefly, liposomes containing the minimal mixture to reconstitute actin-based motility are prepared by IE. Proteins are dissolved in a nonpolymerizing buffer (IG-buffer: 0.2 mM ATP, 0.1 mM CaCl2, 10 mM HEPES (pH 7.6), 100 mg/mL dextran, 1 mM DTT, 0.5 mM DABCO and 280 mM sucrose) at 4°C to a final total volume of 10 μL, with concentrations: 0.24 μM for the Arp2/3 complex, 0.1 μM gelsolin, 4 μM ADF-cofilin, 13 μM G-actin (including 20% of fluorescently labeled actin), and 2.2 μM VVCA-His. These 10 μL are added at 4°C to 10 μL of polymerizing buffer (IP-buffer: 10 mM ATP, 4 mM MgCl2, 10 mM HEPES (pH 7.6), 100 mg/mL dextran, 1 mM DTT, 0.5 mM DABCO, 100 mM KCl, and 70 mM sucrose). Actin polymerization is triggered upon heating up the sample to room temperature. In this condition, the concentrations of the entire inside solution (I0-solution) are: 5 mM ATP, 2 mM MgCl2, 10 mM HEPES (pH 7.6), 50 mg/mL dextran, 1 mM DTT, 0.5 mM DABCO, 50 mM KCl, 0.05 mM CaCl2, 175 mM sucrose, 0.12 μM Arp2/3, 50 nM gelsolin, 2 μM ADF-cofilin, 6.5 μM G-actin, and 1.1 mM VVCA-His.
Plasma membrane spheres preparation
Plasma membrane spheres (PMS) are generated by a protocol described in Sinha et al. (15) and Lingwood et al. (34). Briefly, mouse lung endothelial cells are grown on glass cover slides (25 × 40 mm2) to ∼50% confluence, and then incubated for 6–8 h in phosphate-buffered saline (pH 7.4) supplemented with 1.5 mM CaCl2, 1.5 mM MgCl2, and 10 mM MG132. PMS detach from mother cells upon gentle shaking of the chamber, which is subsequently mounted on the microscope stage. We have checked, using Lifeact-mCherry transfection, that actin polymerization is undetectable at the PMS membrane.
Micropipette aspiration
The micropipette aspiration technique, developed by Waugh and Evans (35) and Kwok and Evans (36), was extensively used by us to study lipid membranes. We use it to set the membrane tension σ of liposomes and PMS. The value σ is calculated from the Laplace law (35,36),
| (1) |
where ΔP is the applied suction pressure, rp is the inner radius of the pipette, and R is the radius of the portion of the liposome outside of the pipette (Fig. 1 A). To avoid nonspecific adhesion, the micropipette and observation chamber are incubated for 30 min in a casein solution at 0.5 mg/mL before each experiment.
Figure 1.
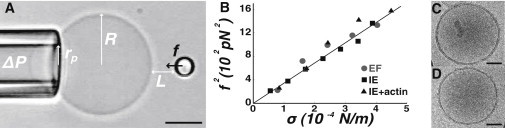
Effect of liposome preparation protocol on their bending modulus and membrane thickness. (A) Video micrograph of a static nanotube extrusion experiment (lipid composition: EPC/DOGS-NTA-Ni/cholesterol 58:5:37 prepared by IE) (scale bar: 5 μm). (B) Plot of f2 as a function of the membrane tension σ for liposomes with the same lipid composition prepared by EF (gray dots), IE (black squares), and IE with a reconstituted actin cortex (black triangles); the slope of the linear fit is 8π2κ (see Methods). Cryo-electron micrograph of liposomes (lipid composition: EPC/DOGS-NTA-Ni/cholesterol 58:5:37. Prepared by EF (C) and IE (D), the measured membrane thickness is, respectively, 3.99 ± 0.55 nm and 4.18 ± 0.55 nm (scale bar, 50 nm).
Optical tweezers
Experiments are performed on a model No. TE2000 inverted microscope (Nikon, Melville, NY). The optical trap is obtained by guiding an Ytterbium fiber laser (1070 nm, 5 W, continuous wave; IPG Photonics, Oxford, MA) into a 100×/1.3 NA oil immersion objective (Nikon) (37). The displacement of the polystyrene bead in the trap is recorded and analyzed using a custom-made video tracking software with a temporal resolution of 40 ms and a subpixel spatial resolution of 35 nm. The trap stiffness is calibrated using the Stokes drag force method (38) and found to be 450 ± 30 pN/μm/W. The optical trap stiffness is constant between 5 and 50 μm from the bottom of the observation chamber and all experiments presented here are performed at a distance of ∼10 μm (the average liposome radius).
Membrane nanotube pulling experiments
Membrane nanotubes are extracted using a 3-μm streptavidin-coated polystyrene bead that is initially brought into contact with a liposome containing 0.1% of DSPE-PEG-biotin. While the bead is optically trapped, the liposome held in a micropipette at constant tension is then moved away with a piezo-translator (MP 105; Physik Instrumente, Auburn, MA) to produce a membrane nanotube. All experiments are performed on nucleated nanotubes of typical initial length >2 μm; note that we do not study the tube nucleation, which is characterized by an overshoot force that was intensively described in Derényi et al. (39). The nanotube force f is calculated from the measured displacement of the bead from its equilibrium position in the optical trap multiplied by the trap stiffness. Bending modulus measurements are performed in static experiments where f = f0 as follows: a membrane nanotube is maintained at a constant length L0 ∼ 2–5 μm for 1–2 min (Fig. 1 A). Membrane tension is increased by ∼10−4 N/m steps through changing the aspiration pressure ΔP in the micropipette (see Eq. 1). The nanotube force f0 is recorded for each increment of σ and the bending modulus κ is calculated from the linear fit of f02 versus σ-curves using f02 = 8π2κσ (40) (Fig. 1 B). For dynamic experiments, we control the piezo-translator by an arbitrary waveform generator developed with LabVIEW (National Instruments, Austin, TX), which allows varying the length and extraction velocity of the nanotubes. Practically, the explored range of length is 2–20 μm and extrusion speeds can be varied between 0.2 and 4 μm/s.
Analysis of nanotube force traces
In dynamic nanotube experiments (Fig. 2 C, e.g., for a PMS), we directly measure fmax on the f(t) curves when tube elongation stops (L = Lmax) and then adjust f(t) during force relaxation (10–80 s on Fig. 2 C) by f(t) = frelax + (fmax − frelax)∗exp(−(t−tmax)/τs) − a(t−tmax) (Fig. 2 C, gray plot) to measure frelax, τs, and a. The latter parameter characterizes the slow relaxation dynamics. A linear relaxation is used because our dynamical tether experiments were stopped before the long relaxation time τl. We have also plotted on Fig. 2 C f(t) = frelax + (fmax − frelax)∗exp(−(t−tmax)/τs) to show the value of frelax. Assuming that f(t) decreases linearly after τs, the force relaxes from frelax to f0 in a time τl = (frelax − f0)/a. Here τl is exactly (frelax − f0)/a + (fmax − frelax)∗exp(−(τl /τs)/a, but we neglect the second term as the ratio τl/τs is always much smaller than 1: in the experiment presented on Fig. 2 C, τl/τs ≈ 2/200).
Figure 2.
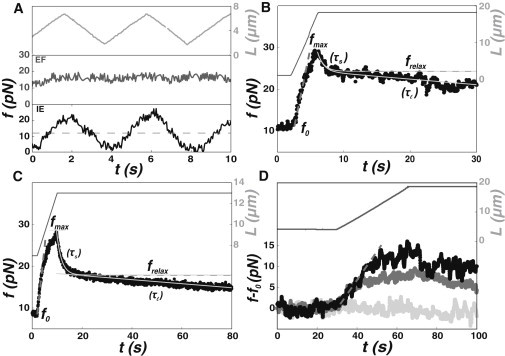
Dynamics of nanotube extrusion on liposomes and PMS. (A) Force response to a sawtooth variation of the tube length L with time (light grey plot) for a liposome prepared by EF (dark grey plot) and IE (black plot) with a similar lipid composition (EPC/DOGS-NTA-Ni/cholesterol 58:5:37), and (dashed line) equilibrium force f0. (B) Measured tube force f (black dots) and tube length (dark grey line) as a function of time during a typical dynamic nanotube pulling experiment (v = 4 μm/s) on a liposome prepared by IE (lipid composition EPC/DOGS-NTA-Ni/cholesterol 58:5:37). (Gray line) Fit of the force curve with f(t) = frelax + (fmax − frelax)∗exp(−(t − tmax)/τs)−a(t − tmax)). (Dashed grey line) Value of frelax. (C) Measured tube force f (black dots) and tube length (dark grey line) as a function of time during a typical dynamic nanotube pulling experiment (v = 0.75 μm/s) on a PMS extracted from a mouse lung endothelial cell. (Gray line) Fit of the force curve with f(t) = frelax + (fmax − frelax)∗exp(−(t − tmax)/τs)−a(t − tmax)). (Dashed line) Value of frelax. (D) Force traces on a liposome prepared by IE (dark gray), EF (light gray), and EF with 10% oil (black) as a function of time during a typical tether pulling experiment (v = 0.45 μm/m). (Dashed grey line in panels B–D) Linear regime at the beginning of the extrusion phase.
Cryo-electron microscopy
Liposomes are deposited onto a glow-discharged holey grid (Ted Pella, Mountain Lakes, CA) and flash-frozen in liquid ethane. Frozen samples are observed with a model No. CM120 electron microscope operating at 120 kV (Philips, Eindhoven, The Netherlands). Images are recorded in low dose mode with a 1024 × 1024 pixels charge-coupled device camera (SSC, Solna, Sweden; and Gatan, Pleasanton, CA). Calibration is performed with a two-dimensional crystal of purple membrane leading to 0.385 nm/pixel at 45,000× magnification. Measurement of membrane thickness is performed with the software ImageJ (National Institutes of Health, Bethesda, MD). Values given are averages on several liposomes and several locations along one liposome; these two measurements give similar results.
Results and Discussion
We investigate by MNE whether differences exist in the bending modulus of liposomes prepared by two different techniques, inverted emulsion (IE) (30) and electroformation (EF) (29). Whereas liposomes encapsulating biological materials are increasingly produced using the IE technique (27,28,41), their mechanics has never been studied. We investigate several membrane compositions, with and without reconstituted actin cortex (Fig. 1, A and B, Table 1, and see Methods). We find that the preparation technique, the membrane composition of our biomimetic systems, and their content of actin (27) have no detectable effect on the bending modulus (Fig. 1 B and Table 1). In all cases, bending moduli are in agreement with values ∼10 kBT reported in the literature for EPC membranes (42). In particular, the presence of 37% of cholesterol has little impact on the bending rigidity of EPC-based membranes, as previously reported for DOPC membranes (43). To further compare membranes prepared by EF and IE, we observe these two types of liposomes by cryo-electron microscopy (Fig. 1, C and D). We measure a bilayer thickness h = 4.0 ± 0.6 nm for EF and h = 4.2 ± 0.6 nm for IE in good agreement with reported values for small EPC liposomes using the same technique (44). There is thus no detectable difference in the membrane thickness of liposomes prepared by IE and EF, consistent with the unaffected bending moduli. Taken altogether, these measurements show that the static properties of liposomes prepared by EF and IE are similar and not affected by the presence of a reconstituted actin cortex.
Table 1.
Values of the bending modulus κ (in units of kBT mean ± SE) for liposomes made with several lipid compositions measured by nanotube extrusion
| Lipid composition | Preparation | κ (kBT) |
|---|---|---|
| EPC | EF | 11.1 ± 0.6 |
| EPC/Cholesterol 63:37 | EF | 9.5 ± 0.4 |
| EPC/NTA-Ni/Cholesterol 58:5:37 | EF | 10.0 ± 1.1 |
| EPC/NTA-Ni/Cholesterol 58:5:37 | IE | 9.2 ± 0.6 |
| EPC/NTA-Ni/Cholesterol 58:5:37 + actin cortex | IE | 11.2 ± 1.5 |
We now investigate the dynamical properties of these liposomes: we pull a few μm-long nanotube and then vary its length back and forth with a sawtooth pattern while the nanotube force is recorded as a function of time (Fig. 2 A). Force traces are strikingly different depending on the preparation method. EF liposomes exhibit a flat force profile (dark grey) as previously observed (17,18). In contrast, the force trace obtained with liposomes prepared by IE reveals drastic variations, of ∼100% of the static force f0. A closer look at the sawtooth experiment of Fig. 2 A reveals that the force does not strictly follow tube elongation in a linear manner, thus suggesting that the timescale of ∼2 s is insufficient to correctly characterize this dynamic behavior. To clarify this dynamic force response, we perform a ramp experiment, at the end of which we allow the force to relax for tens of seconds at constant tube length (Fig. 2 B). To begin, we nucleate a short (2-μm) nanotube and measure the equilibrium force f0. Then we elongate the tube with a constant velocity up to a maximal length Lmax and finally maintain the tube at this maximal length (Fig. 2 B, dark grey plot). Such an experimental procedure allows us to investigate how extrusion velocity and nanotube length influence the temporal variation in force upon elongation and relaxation after arrest. In the course of a ramp experiment, the recorded nanotube force f(t) increases from f0 up to a maximal force fmax during nanotube elongation and then relaxes when the tube length is kept constant (Fig. 2 B, black plot). These force traces are strikingly reminiscent of those observed on cells in similar experiments (19,26,45). The force first increases linearly with the tether length as f = f0∗L/L0, which indicates that the tether is extended at constant area at the beginning of the extrusion phase (Fig. 2, B–D, dashed grey line). Deviation from linearity indicates area transfer from the liposome or PMS to the nanotube, which occurs for longer tether length under high friction. The force relaxation in our experiments occurs with two characteristic times: a short one, τs, of a few seconds (from fmax to frelax), and a longer one, τl, between tens of seconds and tens of minutes. Characteristic times τs and τl are obtained by fitting the force relaxation curve (see Methods). Note that bending moduli presented above were extracted from static measurement with forces measured 1 min after extraction, i.e., after a time between τs and τl (described in Fig. 2 B). Such forces can indeed be considered to be close enough to the static force f0, especially when tension increases (see Fig. S2 B in the Supporting Material and Fig. 1).
We perform the same ramp experiments on a membrane system closer to cells. Following previous work on PM-CSK attachment (9), we use blebs devoid of CSK, detached from cells and called plasma membrane spheres (34) (PMS) (Fig. 2 C). Dynamic MNE experiments show that for PMS, nanotube force traces are similar to those of liposomes prepared by IE. In particular, force relaxes with two timescales τs and τl of the same order of magnitude as found on IE liposomes and PMS (Fig. 3 and see discussion below, black squares and grey dots).
Figure 3.
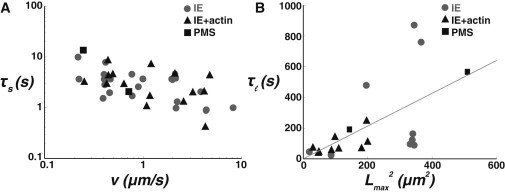
Timescales of force relaxation after tube elongation. (A) Short force relaxation time τs (from fmax to frelax) as a function of the extrusion velocity v for PMS (black squares), liposomes prepared by IE (grey dots), and IE with a reconstituted actin cortex (black triangles). (B) Long force relaxation time τl (from frelax to f0) as a function of the square of the nanotube length Lmax for PMS (black squares), liposomes prepared by IE (grey dots), and IE with a reconstituted actin cortex (black triangles).
To understand the difference between membrane dynamics of liposomes prepared by IE and EF and because the IE method involves a contact between lipids and oil, we perform a ramp experiment on liposomes prepared by EF with 13% mass of mineral oil initially added to the lipids (Fig. 2 D, black plot). We focus on the extrusion phase by pulling the tube at a lower constant velocity than in Fig. 2 B. We find that, in contrast to simple EF liposome which displays a flat force curve (Fig. 2 D, light-gray plot), EF liposomes containing oil display an increase in tube force. The same qualitative effect of force increase is observed in liposomes prepared by IE (dark-gray plot). We thus attribute the dynamic effect observed on liposomes prepared by IE to the presence of a low fraction of mineral oil, resulting in hydrophobic chains embedded in the membrane. This oil fraction is low enough, however, not to affect the membrane thickness. In comparison, other studies on IE-prepared liposomes reported the presence of <5% of oil in the bilayer (30) or of hydrophobic residues when decane is used instead of oil (46). Considering our results on IE liposomes, PMS from cells, or EF liposomes with added oil, the central point of our study is that it demonstrates that a low fraction of hydrophobic compounds in the lipid bilayer dramatically alters membrane dynamics.
To further understand the details of these dynamics, we now systematically investigate the influence of extrusion velocity and maximal tube length on the nanotube force response. We measure the difference on the equilibrium force (f−f0) upon tube extension. We observe that this force difference increases with extrusion velocity v (Fig. 4 A). Moreover, after tube elongation is stopped, the initial (short time) relaxation process also depends on the history of nanotube formation (Fig. 4 B). To characterize the relaxation process, we measure the force difference Δf = fmax − frelax and find that it varies almost linearly with both parameters v and maximal tube length Lmax (Fig. 5 A). A fit of Δf gives Δf = αv+βLmax with α = 0.7 ± 0.3 pN.s/μm and β = 0.06 ± 0.03 pN/μm, with a coefficient of determination R2 of 0.49. The finding that Δf is not exclusively a function of v suggests that the increase in force is not solely a dynamic effect. We might thus hypothesize that it partly originates from nonlocal bending elasticity, as previously reported in Waugh et al. (47). Indeed, the whole liposome resists against the elongation of a thin tether because it increases the area difference between the two membrane leaflets. Tube elongation thus costs an elastic force increment ΔfNL ∼ βNLLmax with βNL = 12π2κ/A, where A is the liposome surface (47). We estimate βNL ∼10−2 pN/μm with our values of κ and A, in agreement with literature values (47) and on the same order as our experimental value β = 0.06 ± 0.03 pN/μm. Thus, the dependence of the force with maximal length can be attributed to a nonlocal bending effect that was previously observed in EF liposomes (47). The effect on the force is on the order of picoNewtons for tube lengths of ∼20 μm.
Figure 4.
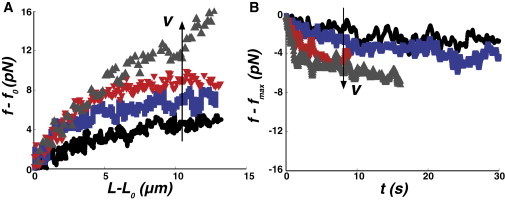
Influence of the extrusion velocity on the force response in dynamic membrane nanotube experiments. (A) Force traces recorded on the same liposome prepared by IE with the lipid composition EPC/DOGS-NTA-Ni/cholesterol 58:5:37 with increasing extrusion velocity v (v = 0.225, 0.406, 2.17, and 4 μm/s, respectively) showing that the maximal force increases with the extrusion velocity. (B) Force relaxation subsequent to tube elongation for increasing extrusion velocities (same velocities than panel A). We plot f − fmax versus t to display all the relaxation curves starting form the same point.
Figure 5.
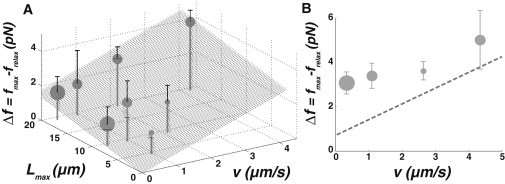
Quantification of membrane friction. (A) Δf = fmax− frelax as a function of the extrusion velocity v and the maximal nanotube length Lmax for liposomes prepared by the IE technique (grey dots) (lipid composition EPC/DOGS-NTA-Ni/cholesterol 58:5:37). (Gray surface) Best linear fit (αv+βLmax with α = 0.7 ± 0.3 pN.s/μm and β = 0.06 ± 0.03 pN/μm) of these weighted data. (B) Δf = fmax– frelax as a function of the extrusion velocity v for liposomes with a reconstituted actin cortex (grey circles, Lmax = 10.5 μm); (dashed line) value of Δf for IE lipid membrane without actin, calculated from the fit of panel A. In panels A and B, we represent the number of measures by circle size (small circles, N = 1–2; medium circles, N = 3–5; and large circles, N = 6–8). (Black error bars on top of points) Half of the standard deviation.
Let us now focus on the velocity-dependence of the force. In pure membranes, the dissipation is dominated by interlayer slip between the two membrane leaflets but its impact on the force is sizable only for very large extrusion velocities (v ≥ 100 μm/s) (17). The resulting force contribution reads
| (2) |
where h is the membrane thickness, R is the liposome radius, and r is the nanotube radius. In pure lipid membranes, the intermonolayer friction parameter is b = 108 Pa.s/m (17). Such a friction effect could be, however, dramatically enhanced by a density ρb of molecules bridging the two membrane leaflets, like alkane chains for liposomes prepared by IE, or trans-membrane proteins for cellular membranes. In this case, upon tube extension, lipids have to circulate around bridges in the viscous plane of the membrane, characterized by a viscosity μ of ∼10−8 Pa.s.m (48,49). If δv is the velocity difference between the two membrane leaflets, the total force per unit area reads bδv + μΔδv, where Δδv is the Laplacian of the velocity difference. A scaling argument gives that Δδv is δv divided by the square of a characteristic distance (here the distance between bridges), thus Δδv ∝ ρbδv. Consequently, the effective friction is increased and becomes instead of b. For liposomes prepared by IE, the linear fit of Δf with v (see coefficient α above and Fig. 5 A) provides of ∼109 Pa.s/m. This 10-fold increase compared to pure lipid membranes, shows that the term μρb dominates . Furthermore, with ρb = ϕb/a, where ϕb is the surface fraction of molecular bridges and a = 0.25 nm2 is the typical area of a hydrophobic tail (50), this value is consistent with a surface fraction of ∼ϕb ∼2.5%, in agreement with the estimate for the maximal amount of oil inserted within the bilayer (30,46). Moreover, from the ratio of Δf and v in the force trace of Fig. 2 C, we estimate that the friction parameter is ∼10 times higher for PMS than for liposomes prepared by IE. This implies that the membrane surface fraction occupied by membrane proteins, ϕb, is ∼25%. This number is, however, underestimated because membrane proteins have a larger area than lipids. Consistently, the measured surface fraction of transmembrane proteins is 23% in red blood cells (51) and probably larger in other cell types (31,52).
To probe the effect of CSK on PM, we compare liposomes containing a reconstituted actin cortex (27) to their bare homologs. Fig. S1 shows a confocal observation of the reconstituted actin cortex at the inner leaflet of a liposome membrane (see Fig. S1 A) from which a membrane nanotube is pulled (see Fig. S1 B). We find that liposomes with a reconstituted actin cortex display dynamic force effects similar to the other biomimetic systems presented above (PMS and liposomes prepared by IE). Performing the same analysis of force traces, we find that forces are systematically larger in the presence of an actin cortex than for bare lipid membranes (Fig. 5 B), revealing an additional effect due to the presence of the CSK. Indeed, friction is likely to happen due to CSK-membrane linkage through the nucleating promoting factor, here VVCA-his. To create a tube, the membrane has to slide over the cortex, generating a friction force that was derived in particular for cells (25),
| (3) |
where ρa is the density of CSK anchors in the membrane and r = 2πκ/f is the tether radius. This force adds up to the interleaflet friction force described above for bare membranes, and reads
| (4) |
where
and
The term f∗/f corresponds to the additional friction induced by the presence of the cortex. Experimentally, at f = fmax, we find that this additional contribution Δfcsk is on the same order as Δff, namely ∼3 pN (Fig. 5 B). This means that f∗/f is of order one. Because (fmax − f0) is ∼3–8 pN and f0 ∼10 pN, then f∗ is ∼15–20 pN. With our measurement of κ ∼ 10 kBT, h ∼ 4 nm, we obtain ρa/ρb ∼ 4. With the value of ρb derived above, ∼1015 m−2, the distance between CSK anchors is 100 nm, which corresponds to the experimental estimate (27).
Let us now examine the two characteristic relaxation times (τs, Fig. 3 A; and τl, Fig. 3 B) and how they may affect experimental force measurements on pure membranes and cells. The short time τs is not affected by the presence of CSK. It has similar values in artificial systems and PMS (Fig. 3 A). Its value is ∼1 s, close to the value derived for pure lipid membranes, and is characteristic of intermonolayer friction (17,53).
More interesting and (to our knowledge) unreported to date is the presence of the long relaxation time τl for PMS, liposomes prepared by IE, and liposomes containing an actin cortex. This time can reach tens of minutes and typically varies linearly as Lmax2 (Fig. 3 B), suggesting a process controlled by lateral diffusion along the tether, valid for both PMS and IE liposomes. The slope of τl versus Lmax2 provides an estimated value of the diffusion coefficient of ∼1 μm2/s, typical of a membrane species (49). Full relaxation of the tether dynamical force may thus require the diffusion of a particular molecular species in (or out of) the long membrane tube, although the fact that static mechanical properties were identical to EF lipid membranes does not provide evidence of a molecule sorting effect in the membrane tube. Another explanation could be found in the reorganization of the bilayer under stretch. Indeed, the presence of molecular bridges during tube pulling leads to a nonoptimal density difference between the two monolayers of the membrane tube. This mismatch relaxes by diffusion with a coefficient (53), where Ks ∼ 0.1 N/m is the membrane stretching modulus and is the friction parameter measured above. The relaxation of the in-plane stretching gradient is usually very fast in pure lipid membranes (Db ∼ 103 μm2/s), and is expected to be significantly slowed down by bridge molecules in the composite membrane we study (Db ∼ 102 μm2/s). However, it is still more than one order of magnitude larger than the one derived from our slow relaxation times (Fig. 3 B). Although its origin is not entirely clear, the slow relaxation process uncovered by our study is a diffusive process at the scale of the entire membrane tube that could play an important role in cells, as the timescales are similar to those of CSK remodeling. As a consequence, membrane reorganization and CSK remodeling are difficult to distinguish when operating simultaneously, thus highlighting that the subtle mechanical properties of the cellular interface should not be attributed solely to the presence of CSK.
Conclusion
Membrane nanotube experiments in cells are often compared with experiments on pure lipid membranes, which appear to be correct only for static mechanical properties. Differences in their dynamical behavior are often attributed to the presence of the CSK. However, we show here that even in the absence of CSK in liposomes and PMS, we obtain dynamic force traces that are reminiscent of those found in cells. Dynamic nanotube extrusion experiments in the range of velocities explored here (0.2–4 μm/s) reveal drastic differences between liposomes prepared by EF and all the other types of membranes that we consider. Relaxation of tube force occurs in two different characteristic times: the short one is attributed to intermonolayer friction whereas the long one corresponds to a diffusion process inside the membrane tube and is on the same order of magnitude of CSK remodeling, thus revisiting the effective role of CSK and PM on cell mechanics.
Acknowledgments
We acknowledge the BioImaging Cell and Tissue Core Facility of the Institut Curie Imaging Facility. This work was supported by the Agence Nationale de la Rechereche (ANR-08-BLAN-0012-12) and (ANR-09-BLAN-283).
C.C. acknowledges financial support by the Association pour la Recherche contre le Cancer.
Contributor Information
Clément Campillo, Email: clement.campillo@univ-lyon1.fr.
Pierre Nassoy, Email: pierre.nassoy@curie.fr.
Cécile Sykes, Email: cecile.sykes@curie.fr.
Supporting Material
References
- 1.Tinevez J.Y., Schulze U., Paluch E. Role of cortical tension in bleb growth. Proc. Natl. Acad. Sci. USA. 2009;106:18581–18586. doi: 10.1073/pnas.0903353106. [DOI] [PMC free article] [PubMed] [Google Scholar]
- 2.Gauthier N.C., Masters T.A., Sheetz M.P. Mechanical feedback between membrane tension and dynamics. Trends Cell Biol. 2012;22:527–535. doi: 10.1016/j.tcb.2012.07.005. [DOI] [PubMed] [Google Scholar]
- 3.Charras G.T., Hu C.-K., Mitchison T.J. Reassembly of contractile actin cortex in cell blebs. J. Cell Biol. 2006;175:477–490. doi: 10.1083/jcb.200602085. [DOI] [PMC free article] [PubMed] [Google Scholar]
- 4.Fehon R.G., McClatchey A.I., Bretscher A. Organizing the cell cortex: the role of ERM proteins. Nat. Rev. Mol. Cell Biol. 2010;11:276–287. doi: 10.1038/nrm2866. [DOI] [PMC free article] [PubMed] [Google Scholar]
- 5.Evans E., Yeung A. Apparent viscosity and cortical tension of blood granulocytes determined by micropipette aspiration. Biophys. J. 1989;56:151–160. doi: 10.1016/S0006-3495(89)82660-8. [DOI] [PMC free article] [PubMed] [Google Scholar]
- 6.Evans E., Rawicz W. Entropy-driven tension and bending elasticity in condensed-fluid membranes. Phys. Rev. Lett. 1990;64:2094–2097. doi: 10.1103/PhysRevLett.64.2094. [DOI] [PubMed] [Google Scholar]
- 7.Sheetz M.P., Dai J.W. Modulation of membrane dynamics and cell motility by membrane tension. Trends Cell Biol. 1996;6:85–89. doi: 10.1016/0962-8924(96)80993-7. [DOI] [PubMed] [Google Scholar]
- 8.Hochmuth R.M., Marcus W.D. Membrane tethers formed from blood cells with available area and determination of their adhesion energy. Biophys. J. 2002;82:2964–2969. doi: 10.1016/S0006-3495(02)75637-3. [DOI] [PMC free article] [PubMed] [Google Scholar]
- 9.Dai J.W., Sheetz M.P. Membrane tether formation from blebbing cells. Biophys. J. 1999;77:3363–3370. doi: 10.1016/S0006-3495(99)77168-7. [DOI] [PMC free article] [PubMed] [Google Scholar]
- 10.Diz-Muñoz A., Krieg M., Heisenberg C.P. Control of directed cell migration in vivo by membrane-to-cortex attachment. PLoS Biol. 2010;8:e1000544. doi: 10.1371/journal.pbio.1000544. [DOI] [PMC free article] [PubMed] [Google Scholar]
- 11.Keren K. Membrane tension leads the way. Proc. Natl. Acad. Sci. USA. 2011;108:14379–14380. doi: 10.1073/pnas.1111671108. [DOI] [PMC free article] [PubMed] [Google Scholar]
- 12.Raucher D., Sheetz M.P. Cell spreading and lamellipodial extension rate is regulated by membrane tension. J. Cell Biol. 2000;148:127–136. doi: 10.1083/jcb.148.1.127. [DOI] [PMC free article] [PubMed] [Google Scholar]
- 13.Gauthier N.C., Fardin M.A., Sheetz M.P. Temporary increase in plasma membrane tension coordinates the activation of exocytosis and contraction during cell spreading. Proc. Natl. Acad. Sci. USA. 2011;108:14467–14472. doi: 10.1073/pnas.1105845108. [DOI] [PMC free article] [PubMed] [Google Scholar]
- 14.Batchelder E.L., Hollopeter G., Plastino J. Membrane tension regulates motility by controlling lamellipodium organization. Proc. Natl. Acad. Sci. USA. 2011;108:11429–11434. doi: 10.1073/pnas.1010481108. [DOI] [PMC free article] [PubMed] [Google Scholar]
- 15.Sinha B., Köster D., Nassoy P. Cells respond to mechanical stress by rapid disassembly of caveolae. Cell. 2011;144:402–413. doi: 10.1016/j.cell.2010.12.031. [DOI] [PMC free article] [PubMed] [Google Scholar]
- 16.Reference deleted in proof.
- 17.Evans E., Yeung A. Hidden dynamics in rapid changes of bilayer shape. Chem. Phys. Lipids. 1994;73:39–56. [Google Scholar]
- 18.Cuvelier D., Derényi I., Nassoy P. Coalescence of membrane tethers: experiments, theory, and applications. Biophys. J. 2005;88:2714–2726. doi: 10.1529/biophysj.104.056473. [DOI] [PMC free article] [PubMed] [Google Scholar]
- 19.Khatibzadeh N., Gupta S., Anvari B. Effects of cholesterol on nano-mechanical properties of the living cell plasma membrane. Soft Matter. 2012;8:8350–8360. doi: 10.1039/C2SM25263E. [DOI] [PMC free article] [PubMed] [Google Scholar]
- 20.Hochmuth R.M., Evans E.A. Extensional flow of erythrocyte membrane from cell body to elastic tether. I. Analysis. Biophys. J. 1982;39:71–81. doi: 10.1016/S0006-3495(82)84492-5. [DOI] [PMC free article] [PubMed] [Google Scholar]
- 21.Hochmuth R.M., Wiles H.C., McCown J.T. Extensional flow of erythrocyte-membrane from cell body to elastic tether. 2. Experiment. Biophys. J. 1982;39:83–89. doi: 10.1016/S0006-3495(82)84493-7. [DOI] [PMC free article] [PubMed] [Google Scholar]
- 22.Dai J.W., Sheetz M.P. Mechanical properties of neuronal growth cone membranes studied by tether formation with laser optical tweezers. Biophys. J. 1995;68:988–996. doi: 10.1016/S0006-3495(95)80274-2. [DOI] [PMC free article] [PubMed] [Google Scholar]
- 23.Hochmuth F.M., Shao J.Y., Sheetz M.P. Deformation and flow of membrane into tethers extracted from neuronal growth cones. Biophys. J. 1996;70:358–369. doi: 10.1016/S0006-3495(96)79577-2. [DOI] [PMC free article] [PubMed] [Google Scholar]
- 24.Borghi N., Brochard-Wyart F. Tether extrusion from red blood cells: integral proteins unbinding from cytoskeleton. Biophys. J. 2007;93:1369–1379. doi: 10.1529/biophysj.106.087908. [DOI] [PMC free article] [PubMed] [Google Scholar]
- 25.Brochard-Wyart F., Borghi N., Nassoy P. Hydrodynamic narrowing of tubes extruded from cells. Proc. Natl. Acad. Sci. USA. 2006;103:7660–7663. doi: 10.1073/pnas.0602012103. [DOI] [PMC free article] [PubMed] [Google Scholar]
- 26.Nassoy P., Cuvelier D., Brochard-Wyart F. Nanofluidics in cellular tubes under oscillatory extension. Europhys. Lett. 2008;84:18004. [Google Scholar]
- 27.Pontani L.-L., van der Gucht J., Sykes C. Reconstitution of an actin cortex inside a liposome. Biophys. J. 2009;96:192–198. doi: 10.1016/j.bpj.2008.09.029. [DOI] [PMC free article] [PubMed] [Google Scholar]
- 28.Takiguchi K., Yamada A., Yoshikawa K. Entrapping desired amounts of actin filaments and molecular motor proteins in giant liposomes. Langmuir. 2008;24:11323–11326. doi: 10.1021/la802031n. [DOI] [PubMed] [Google Scholar]
- 29.Angelova M., Dimitrov D. A Mechanism of Liposome Electroformation. In: DeGiorgio V., editor. Springer; Berlin: 1988. pp. 59–67. [Google Scholar]
- 30.Pautot S., Frisken B.J., Weitz D.A. Production of unilamellar vesicles using an inverted emulsion. Langmuir. 2003;19:2870–2879. [Google Scholar]
- 31.Engelman D.M. Membranes are more mosaic than fluid. Nature. 2005;438:578–580. doi: 10.1038/nature04394. [DOI] [PubMed] [Google Scholar]
- 32.Mathivet L., Cribier S., Devaux P.F. Shape change and physical properties of giant phospholipid vesicles prepared in the presence of an AC electric field. Biophys. J. 1996;70:1112–1121. doi: 10.1016/S0006-3495(96)79693-5. [DOI] [PMC free article] [PubMed] [Google Scholar]
- 33.Murrell M., Pontani L.-L., Sykes C. Spreading dynamics of biomimetic actin cortices. Biophys. J. 2011;100:1400–1409. doi: 10.1016/j.bpj.2011.01.038. [DOI] [PMC free article] [PubMed] [Google Scholar]
- 34.Lingwood D., Ries J., Simons K. Plasma membranes are poised for activation of raft phase coalescence at physiological temperature. Proc. Natl. Acad. Sci. USA. 2008;105:10005–10010. doi: 10.1073/pnas.0804374105. [DOI] [PMC free article] [PubMed] [Google Scholar]
- 35.Waugh R., Evans E.A. Thermoelasticity of red blood cell membrane. Biophys. J. 1979;26:115–131. doi: 10.1016/S0006-3495(79)85239-X. [DOI] [PMC free article] [PubMed] [Google Scholar]
- 36.Kwok R., Evans E. Thermoelasticity of large lecithin bilayer vesicles. Biophys. J. 1981;35:637–652. doi: 10.1016/S0006-3495(81)84817-5. [DOI] [PMC free article] [PubMed] [Google Scholar]
- 37.Sorre B., Callan-Jones A., Bassereau P. Curvature-driven lipid sorting needs proximity to a demixing point and is aided by proteins. Proc. Natl. Acad. Sci. USA. 2009;106:5622–5626. doi: 10.1073/pnas.0811243106. [DOI] [PMC free article] [PubMed] [Google Scholar]
- 38.Neuman K.C., Block S.M. Optical trapping. Rev. Sci. Instrum. 2004;75:2787–2809. doi: 10.1063/1.1785844. [DOI] [PMC free article] [PubMed] [Google Scholar]
- 39.Derényi I., Jülicher F., Prost J. Formation and interaction of membrane tubes. Phys. Rev. Lett. 2002;88:238101. doi: 10.1103/PhysRevLett.88.238101. [DOI] [PubMed] [Google Scholar]
- 40.Heinrich V., Waugh R.E. A picoNewton force transducer and its application to measurement of the bending stiffness of phospholipid membranes. Ann. Biomed. Eng. 1996;24:595–605. doi: 10.1007/BF02684228. [DOI] [PubMed] [Google Scholar]
- 41.Noireaux V., Libchaber A. A vesicle bioreactor as a step toward an artificial cell assembly. Proc. Natl. Acad. Sci. USA. 2004;101:17669–17674. doi: 10.1073/pnas.0408236101. [DOI] [PMC free article] [PubMed] [Google Scholar]
- 42.Marsh D. Elastic curvature constants of lipid monolayers and bilayers. Chem. Phys. Lipids. 2006;144:146–159. doi: 10.1016/j.chemphyslip.2006.08.004. [DOI] [PubMed] [Google Scholar]
- 43.Pan J., Mills T.T., Nagle J.F. Cholesterol perturbs lipid bilayers nonuniversally. Phys. Rev. Lett. 2008;100:198103. doi: 10.1103/PhysRevLett.100.198103. [DOI] [PMC free article] [PubMed] [Google Scholar]
- 44.Tahara Y., Fujiyoshi Y. A new method to measure bilayer thickness: cryo-electron microscopy of frozen hydrated liposomes and image simulation. Micron. 1994;25:141–149. doi: 10.1016/0968-4328(94)90039-6. [DOI] [PubMed] [Google Scholar]
- 45.Heinrich V., Leung A., Evans E. Nano- to microscale dynamics of P-selectin detachment from leukocyte interfaces. II. Tether flow terminated by P-selectin dissociation from PSGL-1. Biophys. J. 2005;88:2299–2308. doi: 10.1529/biophysj.104.051706. [DOI] [PMC free article] [PubMed] [Google Scholar]
- 46.Kirchner S.R., Ohlinger A., Feldmann J. Membrane composition of jetted lipid vesicles: a Raman spectroscopy study. J. Biophotonics. 2012;5:40–46. doi: 10.1002/jbio.201100058. [DOI] [PubMed] [Google Scholar]
- 47.Waugh R.E., Song J., Zeks B. Local and nonlocal curvature elasticity in bilayer membranes by tether formation from lecithin vesicles. Biophys. J. 1992;61:974–982. doi: 10.1016/S0006-3495(92)81904-5. [DOI] [PMC free article] [PubMed] [Google Scholar]
- 48.Cicuta P., Keller S.L., Veatch S.L. Diffusion of liquid domains in lipid bilayer membranes. J. Phys. Chem. B. 2007;111:3328–3331. doi: 10.1021/jp0702088. [DOI] [PubMed] [Google Scholar]
- 49.Domanov Y.A., Aimon S., Bassereau P. Mobility in geometrically confined membranes. Proc. Natl. Acad. Sci. USA. 2011;108:12605–12610. doi: 10.1073/pnas.1102646108. [DOI] [PMC free article] [PubMed] [Google Scholar]
- 50.Israelachvili J.N. Academic Press; London: 1985. Intermolecular and Surface Forces. [Google Scholar]
- 51.Dupuy A.D., Engelman D.M. Protein area occupancy at the center of the red blood cell membrane. Proc. Natl. Acad. Sci. USA. 2008;105:2848–2852. doi: 10.1073/pnas.0712379105. [DOI] [PMC free article] [PubMed] [Google Scholar]
- 52.Alberts B., Johnson A., Roberts K. Garland Science; New York: 2008. Molecular Biology of the Cell. [Google Scholar]
- 53.Seifert U., Langer S.A. Viscous modes of fluid bilayer-membranes. Europhys. Lett. 1993;23:71–76. [Google Scholar]
Associated Data
This section collects any data citations, data availability statements, or supplementary materials included in this article.