

Abstract
Direct transfer of proteins between DNA helices is a recognized important feature of the recognition site search process. Direct transfer is characterized by a dissociation rate that depends on total DNA concentration. This is taken as evidence for the formation of an intermediate DNA-protein-DNA ternary complex. We find that the dissociation rate of EcoRI-DNA-specific complexes at 80 mM NaCl depends on the concentration of competitor oligonucleotide suggesting that direct transfer contributes to EcoRI dissociation. This dependence on competitor DNA concentration is not seen at 180 mM salt. A careful examination of the salt concentration dependence of the dissociation rate, however, shows that the predictions for the formation of a ternary complex are not observed experimentally. The findings can be rationalized by considering that just after dissociating from a DNA fragment the protein remains in close proximity to that fragment, can reassociate with it, and diffuse back to the recognition site rather than bind to an oligonucleotide in solution, a hopping excursion. The probability that a protein will bind to an oligonucleotide during a hop can be approximately calculated and shown to explain the data. A dependence of the dissociation rate of a DNA-protein complex on competitor DNA concentration does not necessarily mean direct transfer.
Introduction
The association and dissociation kinetics of sequence-specific DNA-binding proteins are surprisingly complicated (1–9). It is generally thought that the sequence-specific DNA-binding proteins that regulate gene activity locate their target sequences by initially binding nonspecifically with subsequent one-dimensional diffusion along the DNA interspersed with short three-dimensional excursions due to transient dissociation of nonspecifically bound protein and by direct transfer of protein from one DNA helix to another. The dissociation of a protein bound to its specific recognition site on a DNA fragment can likewise be parsed into several steps. Typically, the slowest step in the whole process is a transition from specific to nonspecific binding modes at the recognition site. This step involves the incorporation of a water layer between the DNA and protein interfaces (10–17). The nonspecifically bound protein can then diffuse in one-dimension or, equivalently, slide along the DNA. There is a probability that the nonspecifically bound protein will dissociate into solution before rebinding to the recognition site. The dissociated protein can either reassociate with the original DNA or bind to another DNA in the adjoining volume. Reassociation with the original DNA is termed hopping or jumping depending on the distance traveled along the DNA. The characteristic times of sliding and dissociation of a nonspecifically bound protein are both much faster than the initial specific-nonspecific binding mode transition.
Additionally, direct transfer of protein between DNA helices (1,2,18–28) is now recognized as an important feature of the specific site search process and dissociation for several proteins. Direct transfer is characterized by a dependence of the dissociation rate on total DNA concentration that is interpreted as the formation of an intermediate DNA-protein-DNA ternary complex. The direct transfer model is gaining popularity because protein-DNA dissociation rates are becoming more widely observed to depend on competitor DNA concentrations. In general, direct transfer requires that the protein can bind, either specifically or nonspecifically, two DNA helices simultaneously. Because DNA-protein complexes are very generally stabilized by electrostatic interactions between DNA phosphate charges and lysines or arginines of protein, the formation of a ternary DNA-protein-DNA complex as a direct transfer intermediate will very likely be coupled to a release of salt. This is very different from simple dissociation of protein from DNA that results in a net binding of salt. Higher salt concentrations will favor simple dissociation over the formation of a ternary complex and subsequent direct transfer. This difference, however, has not been directly investigated.
We report here that the dissociation rate of EcoRI at 80 mM NaCl depends on competitor oligonucleotide concentration. The observed sensitivity of the rate to oligonucleotide concentration would suggest contributions from both simple dissociation and direct transfer. EcoRI has only one specific DNA binding site, not two. EcoRI does have a positively charged patch on the protein surface opposite from the binding site, however, that may serve to bind another DNA helix nonspecifically and promote dissociation. We have previously reported that the salt dependence of the dissociation rate of EcoRI abruptly changes at ∼40 mM NaCl and suggested that dissociation by direct transfer could be the cause (29). At 180 mM NaCl, no dependence of the dissociation rate on oligonucleotide concentration is observed, suggesting that only simple dissociation seems to contribute. This is consistent with the expected decrease in the direct transfer contribution relative to simple dissociation as the salt concentration is increased. When the salt concentration dependence of dissociation is measured between 60 and 90 mM NaCl for two oligonucleotide concentrations, however, very little difference is observed. The two oligonucleotide concentrations should have had significantly different salt concentration dependencies because of the very different relative contributions from simple dissociation and direct transfer.
To explain this anomalous behavior, we hypothesize that the dependence of dissociation rate on oligonucleotide concentration for both 80 and 180 mM NaCl is due to the interplay of protein hopping kinetics with oligonucleotide association times. After the initial dissociation of protein from DNA, it is still in close proximity to the DNA. The probability that the protein will simply rebind to the same DNA is quite large. The protein can still be considered bound to the DNA in a practical sense or microdissociated as suggested by Graham et al (30). Mathematical expressions are available for the probability distribution that a protein that dissociates at time t = 0 will rebind to the original DNA fragment at time t assuming no other DNA is around. If competing DNA is present in the mixture, however, it can bind the protein during this off-time. The return of the protein to the original DNA fragment does not necessarily mean a return to the recognition site; the protein can bind anywhere on the DNA and dissociate again before reaching the recognition site. The probability for the return to the recognition site will depend on how far the nonspecifically bound protein can slide along the DNA before dissociating again relative to the average distance the protein can diffuse in solution parallel to the DNA during the hop. These two distances can be used to define a characteristic time, tf, which is a practical limit for considering a hop that can end in a return to the recognition site. The probability that a protein will be captured by an oligonucleotide during a hopping excursion before rebinding to the original recognition site can be then roughly estimated from tf, the oligonucleotide concentration, the association rate constant, and the hopping time distribution function. A distribution function determined by random walk simulations gives a reasonably good description of the oligonucleotide concentration dependence observed for EcoRI at both 80 and 180 mM NaCl. The difference in the oligonucleotide concentration dependence of the dissociation rate for these two NaCl concentrations results from the salt dependent difference in the average sliding distance between dissociation events. Because the protein is already dissociated from DNA during a hop, there is no contribution to the salt sensitivity from forming the intermediate DNA-EcoRI-DNA ternary complex.
The results presented here suggest an alternate mechanism to direct transfer for explaining a competitor DNA concentration dependence of the dissociation rate of a specific DNA-protein complex. Characterizing the salt dependencies for simple dissociation and for competitor DNA concentration-dependent contribution might be a reliable way to distinguish direct transfer from an indirect transfer of a microdissociated protein.
Materials and Methods
Materials
A DNA fragment containing a single EcoRI recognition sequence was isolated from the plasmid derived from pNEB193 (New England Biolabs) using standard techniques. The 360 bp fragment was purified from a PvuII (New England Biolabs) digestion of the plasmid. The double-stranded 30 bp long oligonucleotides used as competitor DNA for the kinetic experiments were:
Specific sequence oligo: ACGACGGCCAGTGAATTCGAGCTCGGTACC.
Nonspecific sequence oligo: ACGACGGCCAGTCTTAAGGAGCTCGGTACC.
These oligonucleotides only differ in the central six basepairs shown in bold letters. The specific sequence oligonucleotide contains the EcoRI cognate recognition site, GAATTC. The CTTAAG oligonucleotide contains an inverted specific sequence or a nonspecific site with all six basepairs wrong. Sequence differences from the recognition sequence in this central six basepair region are underlined. The oligonucleotides shown above and their complements were purchased from Invitrogen (Carlsbad, CA), and dissolved in STE buffer (100 mM NaCl, 10 mM TrisCl (pH 7.5), 1 mM EDTA). Complementary strands were mixed in 1:1 proportion, heated to 92°C, and annealed by slow cooling to 25°C. Small molecular mass impurities were removed using P6 Bio-Spin columns at room temperature. Double-stranded oligonucleotides were then additionally purified on a Protein Pak Q anion exchange column (Waters, Milford, MA) using an AKTA Purifier (GE Healthcare Life Sciences, Piscataway, NJ), ethanol precipitated, and dissolved in TE buffer (10 mM TrisCl (pH 7.5), 1 mM EDTA). The purity of the double-stranded oligonucleotides was confirmed by polyacrylamide gel electrophoresis. The concentrations of the DNA fragment and oligonucleotides were determined spectrophotometrically, using an extinction coefficient of 0.013 (μM basepairs)−1 at 260 nm. Absorption spectra were obtained with a Perkin Elmer (Foster City, CA) Lambda 800 UV-Vis spectrophotometer.
DNA-binding experiments were performed with highly purified EcoRI restriction endonuclease (kind gift of Dr. L. Jen-Jacobson). Titration of the EcoRI sample with known concentration with specific DNA fragment (1–10 nM concentration range) confirmed that stoichiometry of binding was one EcoRI dimer per 360 bp fragment with a single EcoRI-specific recognition sequence (data not shown). Active protein concentrations for the individual binding experiments were determined by direct titration of the EcoRI with the 360 bp DNA fragment under conditions of stoichiometric binding as described previously (10).
Betaine glycine and triethylene glycol were purchased from Fluka Chemical ( now Sigma Aldrich, Bellefonte, PA) and used without further purification. Osmolal concentrations of betaine glycine were determined by direct measurement using a vapor pressure osmometer operating at room temperature (Wescor, Logan, UT; model 5520XR).
Dissociation kinetics
The dissociation reaction mixture contained 20 mM Imidazole, pH 7.2, 1 mM EDTA, 2 mM dithiothreitol (DTT), and 100 μg/ml acetylated bovine serum albumin (BSA) (Ambion). The NaCl concentration was varied between 60 and 200 mM. For salt concentrations above 140 mM NaCl, 2.5 osmolal betaine glycine was added to slow the specific-nonspecific binding mode transition that is the first step in dissociation. The DNA fragment concentration was 2.5 nM and the EcoRI concentration was ∼1.2 nM. The enzyme was allowed to equilibrate with the DNA fragment for ∼60 min at 20°C. The dissociation reaction was initiated by adding oligonucleotide to the reaction mixture to a final concentration ranging between 0.25 and 5 μM oligonucleotide. The total reaction volume was 30 μl. Reactions were stopped at various times by adding 10 μl triethylene glycol. The combination of decreased ionic strength, increased osmotic pressure, and oligonucleotide excess is sufficient to prevent additional dissociation or association reactions for many hours (31).
Gel mobility shift experiments
Our methodology for gel mobility shift assays has been described in detail elsewhere (29,31). Briefly, reaction mixtures from the kinetic experiments were loaded onto a 12% polyacrylamide gel in 1× TAE and electrophoresed at 150 v for ∼14 h. The gels were stained with SYBR Green I (Invitrogen) and imaged with an FLA7000 (GE Life Sciences) laser scanner.
Analysis
Intensities of free DNA and protein-DNA complex bands from the FLA7000 images were analyzed using MultiGauge (Fujifilm Life Sciences) and SigmaPlot 10 (Systat Software, San Jose, CA). The probability that a protein will react with an oligonucleotide during a hopping excursion (Eq. 3 in the Discussion section) was evaluated with Mathcad 14 (Parametric Technology Corporation, Needham, MA).
Results
Dissociation kinetics can be measured by adding an excess of oligonucleotide containing the specific site to a solution of a longer DNA fragment also containing the specific recognition site with EcoRI already bound. Protein that dissociates from the DNA fragment is trapped by the added competitor. A variant of the standard gel mobility shift assay that we have developed (31) can be used to measure the loss of protein-bound fragment with time. The ratio of specific site concentrations of oligonucleotide and of DNA fragment we use here is at least 100. Fig. 1 shows semilog plots for the dissociation of EcoRI from a 360 bp DNA fragment (∼2.5 nM) containing a single recognition site for two competitor specific site oligonucleotide concentrations, 0.25 and 5 μM in recognition sites, for 80 mM NaCl, pH 7.2, 20°C. In both cases, the kinetics can be well described by a single exponential with a dissociation rate constant kd. The two dissociation rate constants for the two oligonucleotide concentrations differ by a factor of ∼2.7.
Figure 1.
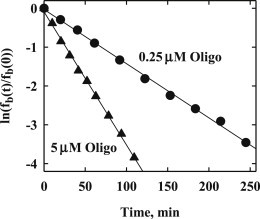
Dissociation kinetics of EcoRI are shown for two concentrations of competitor-specific sequence oligonucleotide, 0.25 (●) and 5 μM (▴). Semilog plots of the normalized fraction DNA remaining as complex with protein, fb(t)/fb(0), as dependent on time is shown. The reaction conditions were 80 mM NaCl, 20 mM Imidazole (pH 7.2), 1 mM EDTA, 2 mM DTT, 100 μg/ml BSA, and 20°C. The dissociation reactions were stopped by adding triethylene glycol and the mixture analyzed by gel mobility shift electrophoresis as described in the Materials and Methods. The slope of each line is –kd, where kd is the dissociation rate constant.
Fig. 2 shows the dependence of the dissociation rate constant on a specific sequence oligonucleotide concentration for 80 mM NaCl, pH 7.2 at 20°C (▴ and ★). The star point shows the dissociation rate constant for added 0.5 μM specific site oligonucleotide and 4.5 μM nonspecific oligonucleotide. The kd value is the same as for the added 5 μM specific sequence oligonucleotide.
Figure 2.
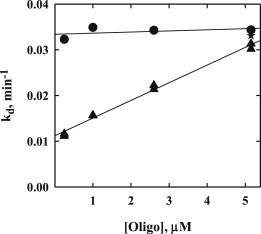
The dependence of the dissociation rate constant, kd, on oligonucleotide concentration is shown for: 80 mM NaCl, pH 7.2, no osmolyte (▴, ★), and for 180 mM NaCl, 2.5 osmolal betaine glycine, pH 7.2 (●). The specific sequence oligonucleotide was used in these experiments, except for ★, which had 0.5 μM specific sequence oligonucleotide and 4.5 μM nonspecific sequence oligonucleotide. The competitor DNA dependence seen at 80 mM NaCl is absent at the higher salt concentration. All samples contained 20 mM Imidazole, 1 mM EDTA, 2 mM DTT, and 100 μg/ ml BSA in addition to the NaCl and the osmolyte betaine glycine.
The curve shows a dependence of the dissociation rate on oligonucleotide concentration that is approximately linear or kd = kd0 + k′ [Oligo]. A significant dependence of the dissociation rate on competitor DNA concentration, k′, has typically been taken as evidence for a direct transfer mechanism of dissociation. The complex of DNA fragment and protein binds a second DNA; this ternary complex then dissociates into an oligonucleotide-protein complex and free DNA fragment. The binding of oligonucleotide to the complex is considered stabilized by protein-oligonucleotide electrostatic interactions. The finite kd0 indicates that simple dissociation also contributes to the overall off-rate. We have previously measured dissociation rate constants by measuring the transfer rate of protein initially bound to a 360 bp DNA fragment to a 240 bp DNA fragment (29). In this case, both DNA concentrations were low, 2–3 nM. The kd0 inferred here is within ∼20% of the previously measured dissociation rate constant for similar salt and pH conditions.
Simplistically, the salt concentration dependence of dissociation results from the breaking of DNA-protein charge-charge interactions. The salt concentration dependence of simple dissociation reflects the loss of DNA fragment-protein electrostatic interactions. The salt concentration dependence of direct transfer dissociation is the net not only of the loss of DNA fragment-protein electrostatic interactions, but also of the gain of charge-charge interactions in forming the ternary oligonucleotides-complex. With increasing salt concentration, the rate of dissociation due to direct transfer will not increase as fast as the rate of simple dissociation assuming that the rate of ternary complex formation remains rate limiting and not the dissociation of the ternary complex.
Fig. 2 shows also the dependence of dissociation rates on oligonucleotide concentration for 180 mM NaCl, 2.5 osmolal glycine betaine, pH 7.2 (●).The dissociation rate of nonspecifically bound EcoRI is ∼150-fold faster at 180 mM NaCl than at 80 mM (29). The osmolyte glycine betaine is added to significantly slow the transition between specific and nonspecific binding modes (∼200-fold) so that the overall dissociation rate remains about constant (29). Glycine betaine minimally affects the sliding rate along DNA of the nonspecifically bound enzyme and the salt dependence of dissociation (29,32,33). Within experimental error (∼5%), the dissociation rate is independent of the oligonucleotide concentration at the higher salt concentration. This is consistent with the expected effect of salt concentration on the relative rates of direct transfer and simple dissociation.
Fig. 3 shows the salt concentration dependence of the dissociation rate measured from 60 to 90 mM NaCl at pH 7.5 and from 150 to 200 mM NaCl at pH 7.5 for 0.25 and 2.5 μM oligonucleotide. To within 5% error, no difference in the salt concentration dependence is observed for the two oligonucleotide concentrations or for the two salt concentration ranges, d(log(kd))/dlog([NaCl]) = 5.8 ± 0.2, a measure of the thermodynamic number of salt ions coupled to dissociation. This is consistent with previous measurements at pH 7.2 (29). This insensitivity of the salt dependence to oligonucleotide concentration in the 80 mM NaCl range is not expected for separate contributions from direct transfer and simple dissociation. If the salt dependence for both simple dissociation and direct transfer rate constants are described by a simple linkage relation, i.e., k ∼ [NaCl]N, then an approximate difference between N values for direct transfer and simple dissociation can be determined from the ratio of rates at 80 and 180 mM NaCl. At 80 mM NaCl and 2.5 μM oligonucleotide (Fig. 2, ▴), the ratio k′ [Oligo]/kd0 is ∼1. At 180 mM NaCl (Fig. 2, ●), contribution from direct transfer at 2.5 μM oligonucleotide is only at most ∼5% of the simple dissociation rate. If we take N = 6 for the salt dependence for simple dissociation and N′ for direct transfer, then N′ can be calculated from (180/80)N′/(180/80)6 = 0.05 (see the Supporting Material). N′ would have to be ∼2.5 to account for a difference in the oligonucleotide concentration dependence between 80 and 180 mM salt. This difference in salt concentration sensitivity between the two mechanisms would result in dlog(kd)/dlog([NaCl]) values that would differ by 25% at least for 0.25 and 2.5 μM oligonucleotide in the region around 80 mM NaCl (see the Supporting Material, Fig. S1).
Figure 3.
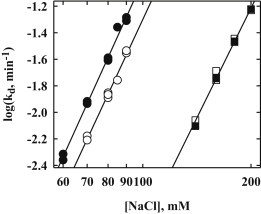
The salt dependences of dissociation rates are shown for two competitor oligonucleotide concentrations and two ranges of salt concentrations: 0.25 μM oligonucleotide (○) and 2.5 μM oligonucleotide (●) over the salt concentration range 60–90 mM NaCl and 0.25 μM oligonucleotide (▪) and 2.5 μM oligonucleotide (□) over the range 150–200 mM NaCl with 2.5 osmolal betaine glycine. The log-log plots all have very similar slopes, 5.8 ± 0.2, giving the thermodynamic linkage of salt with the activation energy of dissociation.
Discussion
The dependence of the dissociation rate on competitor oligonucleotide concentration at 80 mM NaCl seen in Fig. 2 could reasonably be interpreted as a combination of simple and direct transfer-mediated dissociation. The loss of the oligonucleotide concentration dependence seen in Fig. 2 for a much higher salt concentration (180 mM NaCl) could also reasonably be rationalized considering the expected difference in salt sensitivities between simple dissociation and direct transfer assuming that the formation of the ternary complex remains rate limiting. Simple dissociation is faster at higher salt concentrations because DNA-protein charge-charge contacts are lost and replaced by DNA-salt and protein-salt interactions. It is generally assumed that the ternary complex-oligonucleotide intermediate of direct transfer would be stabilized electrostatically through DNA-protein charge-charge interactions. The ternary structure would be less apt to form at higher salt concentrations, comparatively slowing dissociation by direct transfer. This difference in the expected sensitivity to salt concentration could account for the virtually negligible contribution from direct transfer to dissociation observed in Fig. 2 for 180 mM NaCl. When the salt concentration dependence of dissociation is measured around 80 mM NaCl for 0.25 and 2.5 μM competitor oligonucleotide that have quite different apparent contributions from direct transfer to dissociation, however, a much smaller than expected difference can be observed. What else can be occurring?
Dissociation of protein from a specific recognition complex results from a complicated series of steps (2–6,8). The protein bound to the recognition sequence is in equilibrium between specific and nonspecific binding modes. A protein in the nonspecific mode can begin to diffuse of slide along the DNA. The transition between specific and nonspecific binding modes is typically the slowest step compared to subsequent ones. The protein diffusing along the DNA can either rebind to the recognition site or dissociate from the DNA into solution. Because DNA is extended and stiff, even after the protein dissociates into solution, it is likely to rebind nonspecifically to the same DNA. This rebinding is termed hopping or jumping depending on the distance traversed. After rebinding, the protein can either find the recognition sequence or dissociate into solution again. If there was no other DNA in solution, the protein would eventually find its way back to the original recognition site in a finite volume through this sliding/dissociation process. Although the protein is off the DNA, it can react with competitor oligonucleotide. A dependence on oligonucleotide concentration can then result from the concentration-dependent probability that an oligonucleotide will react with the protein during a hop or jump. If we define kd,intrinsic as the rate constant for initiating a hop and R as the probability that the protein will react with an oligonucleotide after beginning a hopping excursion and before rebinding and returning to the specific recognition site, kd is then the product of kd,intrinsic and R. The rate constant kd,intrinsic depends on salt and osmotic pressure, but not the oligonucleotide concentration.
A rigorous calculation of the probability R that a protein will bind to an oligonucleotide while in solution during the time after the protein first dissociates from DNA and before it subsequently rebinds to the initial recognition sequence is beyond the scope of this work. We can, however, illustrate the basic features using a simpler framework. Both analytical (34) and simulation-based expressions (35) are available for the probability that if a protein leaves a DNA helix at time 0 it will rebind to the helix (at any location) at time t. These first passage time distribution functions, P(t), can be well approximated by a power law from nsec to msec timescales. For the analytical solution, P(t) ∼1/t1.3 through ∼1 msec; whereas for the simulation-based expression, P(t) ∼1/t1.5. The reason for the discrepancy is not apparent. Neither approach takes into account an electrostatic attraction between protein and DNA. The simplest form for the probability, Q(t), that a protein will react with an oligonucleotide during a hop of duration time t is
| (1) |
where k2 is the second order association rate constant and [Oligo] is the concentration of oligonucleotide. The total oligonucleotide concentration-dependent probability, R([Oligo]), that a protein will react with an oligonucleotide during all hopping times is simply the integral of P(t)∗Q(t). This framework is a crude approximation to the real situation for two reasons. A protein that rebinds to a DNA fragment can dissociate into solution again before sliding or diffusing along the DNA far enough to find the recognition site. Both the analytical and simulation-based expressions consider an infinite and straight DNA helix, not a finite fragment.
We will consider a general power law for the first passage time distribution, 1/tn. To normalize this function, we choose a minimum time, t0, such that the analytical and simulation-based functions are still in the power law regime and that the probability of reacting with an oligonucleotide is negligibly small. We also choose a maximum time, tf, such that at longer times the probability that the protein will return to the original recognition site is negligibly small because of the finite DNA fragment length and sliding distance. For the time range t > tf, the probability the protein will react with an oligonucleotide is 1, i.e., Q(t) = 1. The probability of reaction is then,
| (2) |
or
| (3) |
For the purposes of illustration, we take k2 = 1 nM−1sec−1. The association rate constant for EcoRI has been estimated at between 0.1 and 1 nM−1sec−1 (36–38) close to the diffusion rate limit. For the oligonucleotide concentration range 5–0.25 μM, the characteristic time for the reaction with oligonucleotide, 1/k2[Oligo], ranges from 200 μsec to 4 msec. We take t0 as 10 nsec. Choosing tf is problematic; it should take into account both the finite size of the DNA and how far the protein can slide along the DNA to account for the probability of finding the recognition site again after rebinding. For illustration purposes, we take as a reasonable estimate of tf the time it takes for a dissociated protein to diffuse an average distance L parallel to the DNA that is about twice the average sliding distance or the DNA length whichever is shorter or tf ∼4πL2/D, where D is the translational diffusion coefficient of EcoRI, ∼108 nm2/sec. For the 80 mM NaCl, pH 7.2 experimental conditions shown in Fig. 2, we have previously estimated that nonspecifically bound EcoRI can scan ∼200 bp, on average, before dissociating (32). The DNA fragment length is 360 bp somewhat larger than this average sliding length. For L ∼200 bp, tf is then ∼500 μsec. This time is within the relaxation time range for reaction with oligonucleotide, 1/k2[Oligo], given above.
R([Oligo]) does not give absolute dissociation rates, but is only proportional to the measured dissociation constant rate through the dissociation rate of a nonspecifically bound protein, kd,intrinsic. The transition between specific and nonspecific binding modes is typically the slow step in dissociation. Because we are not considering direct transfer, this rate is independent of oligonucleotide concentration. To account for the proportionality, Fig. 4 A shows a comparison of R([Oligo])/R(5μM) calculated for P(t) ∼1/t1.3 and 1/t1.5 with tf = 500 μsec with the experimental kd([Oligo])/kd(5μM) data for 80 mM NaCl, pH 7.2. Both P(t) functions show a dependence on oligonucleotide concentration. The simulation-based probability function fits the data surprisingly well given all the approximations. The analytical expression for first passage times, however, predicts a smaller dependence than is observed. The star point in Fig. 2 indicates that nonspecific oligonucleotides can increase the rate of dissociation as efficiently as specific oligonucleotides. The dissociation rate of EcoRI from a nonspecific oligonucleotide can be estimated from the specific site dissociation rate, ∼10−3/sec, and the ratio of specific and nonspecific site binding constants, ∼2 × 10⁴. This gives a characteristic dissociation time for a nonspecific complex of ∼50 msec. This is much longer than the time tf. Binding to a nonspecific oligonucleotide will prevent rebinding of EcoRI to the initial DNA fragment as effectively as a specific oligonucleotide.
Figure 4.
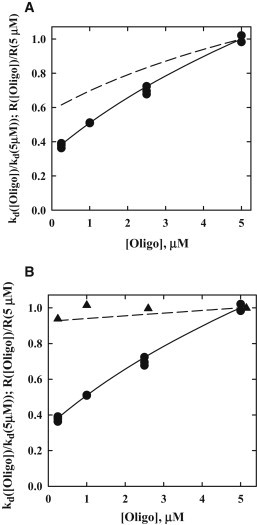
Comparisons of calculated probabilities to react with an oligonucleotide during a hopping excursion with experimental dissociation rates. (A) Scaled dissociation rate constants, kd([Oligo])/kd(5μM), for 80 mM NaCl (●) are compared to scaled estimated probabilities to react with an oligonucleotide, R([Oligo])/R(5μM), calculated with Eq. 3 for two first passage time distribution functions: 1/t1.3 (dashed line) and 1/t1.5 (solid line). The R([oligo]) probabilities and kd values are scaled to 5 μM oligonucleotide to account for the proportionality between them. The other parameters are, t0 = 10 nsec, tf = 500 μsec, and k2 = 1 (nM sec)-1. (B) Scaled dissociation rate constants for 180 mM NaCl, 2.5 osmolal betaine glycine (▴) are compared to the scaled R([Oligo]) probabilities (dashed line) calculated from Eq. 3 for P(t) = 1/t1.5, t0 = 10 nsec, tf = 20 μsec, and k2 = 1 (nM sec)−1. The tf parameter is significantly smaller than that for 80 mM NaCl data in (A) because of the much smaller sliding distance before dissociation. The 80 mM NaCl data (●) and fit (solid line) with P(t) = 1/t1.5 from (A) are shown for comparison.
In 180 mM NaCl, 2.5 osmolal betaine, and at pH 7.2, we previously estimated that EcoRI can only slide along DNA ∼20 bp on average before dissociating (32). This would reduce our estimate of tf to ∼15 μsec. This time is much smaller than the oligonucleotide reaction times for the range of concentrations examined. Fig. 4 B shows a comparison of the dependence on oligonucleotide concentration for experimental dissociation rates, kd([Oligo])/kd(5μM) measured in 180 mM NaCl, 2.5 osm betaine, and pH 7.2 with R([Oligo])/R(5μM) calculated with P(t) = 1/t1.5 and tf = 15 μsec along with the 80 mM NaCl data and fit. Again the model can account for the observed behavior.
It is possible that the absence of an oligonucleotide concentration dependence for dissociation at 180 mM NaCl and 2.5 osm betaine glycine is because the dissociation of the ternary complex rate limiting, not the formation as would be the case at 80 mM NaCl. This would also explain why the salt concentration dependence is the same as at 80 mM NaCl. We can estimate the ratio of dissociation constants at 5 μM oligonucleotide for 180 mM NaCl, 2.5 osm and for 80 mM NaCl from the salt (ΔNs = 6) and osmotic pressure (ΔNw = −120) sensitivities we have previously measured for dissociation (29) and from the probabilities of oligonucleotide reaction we calculate here; R(5μM Oligo) is 0.0264 for 180 mM NaCl, 2.5 osm betaine glycine and 0.0125 for 80 mM NaCl. The ratio of expected dissociation rate constants is then (180/80)6 × exp(−120∗2.5/55.5) × (0.0264/0.0125) = 1.2. The experimental ratio from Fig. 2 is 1.1. It does not seem that the rate-limiting step has changed from 80 mM NaCl to 180 mM NaCl, 2.5 osm betaine glycine.
Until the protein has been off the DNA fragment for a long enough time, tf, that return to the initial recognition site is very unlikely, the protein is still bound in a practical sense to the DNA or only partially dissociated. Only at times longer than tf is the protein functionally dissociated, i.e., the probability to bind with the fragment or with an oligonucleotide is proportional to their concentration ratio. If tf is much shorter than the characteristic times for the association reaction with competitor DNA, then dissociation rates will not vary with oligonucleotide concentration for large ratios of oligonucleotide to fragment. If tf is on the same order or longer than the characteristic times to react with competitor DNA, however, the dissociation rates will depend on the oligonucleotide concentration dependence as expected for direct transfer. Because the protein is not in direct contact with the DNA fragment, however, this transfer during hopping will have the same salt concentration dependence as expected for simple dissociation. The salt concentration difference between 80 and 180 mM NaCl results from the change in sliding distance between dissociation events. In the range 60–90 mM salt (Fig. 3) the change in this sliding length is too small to significantly affect the salt dependence. Because the dissociation rate of a nonspecifically bound enzyme, knsp, varies with the salt concentration as ∼ [NaCl]6 (29), the average sliding distance before dissociation will vary as 1/√knsp or as 1/[NaCl]3. Taking the average sliding length at 80 mM NaCl, L, as ∼200 bp, then the calculated salt concentration dependence at 2.5 μM oligonucleotide is <5% different from simple dissociation in the range 60–90 mM NaCl (Fig. S2).
We wish to emphasize again that the calculations presented here are only crude approximations to the physical reality. They are able, however, to capture the important features of the oligonucleotide concentration-dependent dissociation of EcoRI and may explain the results for other proteins. The electrostatic attraction between EcoRI and DNA at close distances is not included in either the analytic expression for first passage times or the simulation-based form. This may significantly change the functional form. The increased ionic strength at 180 mM NaCl will lessen the electrostatic attraction between the protein and DNA fragment compared to 80 mM. The protein may be able to escape from the DNA vicinity into bulk solution more easily further reducing tf.
The single molecule kinetic studies and interpretation of the effect of DNA extension on the binding and cleavage of another restriction nuclease, EcoRV, are closely related to this work (39,40). The rate of cleavage by the enzyme was found to decrease with DNA stretching. DNA extension decreases the local concentration of DNA that has looped into close proximity to a nonspecifically bound complex such that a dissociated protein has less probability to bind to a more distant DNA region rather than rebind to the same local area.
NMR exchange spectroscopy has been used in several instances to measure oligonucleotide concentration-dependent dissociation rates (24–28). With this technique, the oligonucleotide concentrations used are, of course, much higher than used here with consequently much faster oligonucleotide reaction rates. Additionally, the salt concentrations are typically <50 mM. Of course, direct transfer may still occur, but additional experiments are necessary to exclude transfer during a hopping excursion or partial dissociation.
The data of Graham et al (30) were also closely related to the work presented here. In this case the dissociation of fluorescently labeled Fis protein from DNA is seen dependent on the concentration of competing unlabeled Fis or HU protein. The increase in the dissociation rate with a protein competitor is reasonably linear and has finite intercept. There is about a threefold increase in the apparent dissociation rate with a 10-fold increase in competitor protein concentration. Unlike the results here, competitor protein can only partially displace labeled protein. Graham et al (30) have suggested that competitor protein binding interferes with rebinding of the loosely bound or microdissociated protein, i.e., the return of a hopping protein.
Conclusions
We have shown that an observed dependence of the dissociation rate of a DNA-protein complex on competitor DNA concentration does not necessarily mean direct transfer through the formation of a ternary complex. The salt dependence of any presumed direct transfer dissociation should be closely examined to substantiate the claim. Dissociation is commonly considered an all-or-none process. This is not true for DNA-protein complexes. At early times after dissociation of a protein-DNA complex, i.e., although still in close proximity to the DNA, a protein can be considered bound albeit loosely.
Acknowledgments
We are grateful to L. Jen-Jacobson for the kind gift of highly purified EcoRI.
This work was supported by the Intramural Research Program of the National Institutes of Health, NICHD (Eunice Kennedy Shriver National Institute of Child Health and Human Development).
Supporting Material
References
- 1.Gorman J., Greene E.C. Visualizing one-dimensional diffusion of proteins along DNA. Nat. Struct. Mol. Biol. 2008;15:768–774. doi: 10.1038/nsmb.1441. [DOI] [PubMed] [Google Scholar]
- 2.Halford S.E., Marko J.F. How do site-specific DNA-binding proteins find their targets? Nucleic Acids Res. 2004;32:3040–3052. doi: 10.1093/nar/gkh624. [DOI] [PMC free article] [PubMed] [Google Scholar]
- 3.Halford S.E. An end to 40 years of mistakes in DNA-protein association kinetics? Biochem. Soc. Trans. 2009;37:343–348. doi: 10.1042/BST0370343. [DOI] [PubMed] [Google Scholar]
- 4.Hu T., Shklovskii B.I. How does a protein search for the specific site on DNA: the role of disorder. Phys. Rev. E Stat. Nonlin. Soft Matter Phys. 2006;74:021903. doi: 10.1103/PhysRevE.74.021903. [DOI] [PubMed] [Google Scholar]
- 5.Kolomeisky A.B. Physics of protein-DNA interactions: mechanisms of facilitated target search. Phys. Chem. Chem. Phys. 2011;13:2088–2095. doi: 10.1039/c0cp01966f. [DOI] [PubMed] [Google Scholar]
- 6.Cherstvy A.G., Kolomeisky A.B., Kornyshev A.A. Protein—DNA interactions: reaching and recognizing the targets. J. Phys. Chem. B. 2008;112:4741–4750. doi: 10.1021/jp076432e. [DOI] [PubMed] [Google Scholar]
- 7.Gorman J., Plys A.J., Greene E.C. Visualizing one-dimensional diffusion of eukaryotic DNA repair factors along a chromatin lattice. Nat. Struct. Mol. Biol. 2010;17:932–938. doi: 10.1038/nsmb.1858. [DOI] [PMC free article] [PubMed] [Google Scholar]
- 8.Berg O.G., Winter R.B., von Hippel P.H. Diffusion-driven mechanisms of protein translocation on nucleic acids. 1. Models and theory. Biochemistry. 1981;20:6929–6948. doi: 10.1021/bi00527a028. [DOI] [PubMed] [Google Scholar]
- 9.Winter R.B., Berg O.G., von Hippel P.H. Diffusion-driven mechanisms of protein translocation on nucleic acids. 3. The Escherichia coli lac repressor—operator interaction: kinetic measurements and conclusions. Biochemistry. 1981;20:6961–6977. doi: 10.1021/bi00527a030. [DOI] [PubMed] [Google Scholar]
- 10.Garner M.M., Rau D.C. Water release associated with specific binding of gal repressor. EMBO J. 1995;14:1257–1263. doi: 10.1002/j.1460-2075.1995.tb07109.x. [DOI] [PMC free article] [PubMed] [Google Scholar]
- 11.Sidorova N.Y., Muradymov S., Rau D.C. Differences in hydration coupled to specific and nonspecific competitive binding and to specific DNA binding of the restriction endonuclease BamHI. J. Biol. Chem. 2006;281:35656–35666. doi: 10.1074/jbc.M608018200. [DOI] [PubMed] [Google Scholar]
- 12.Sidorova N.Y., Muradymov S., Rau D.C. Solution parameters modulating DNA binding specificity of the restriction endonuclease EcoRV. FEBS J. 2011;278:2713–2727. doi: 10.1111/j.1742-4658.2011.08198.x. [DOI] [PMC free article] [PubMed] [Google Scholar]
- 13.Winkler F.K., Banner D.W., Wilson K.S. The crystal structure of EcoRV endonuclease and of its complexes with cognate and non-cognate DNA fragments. EMBO J. 1993;12:1781–1795. doi: 10.2210/pdb4rve/pdb. [DOI] [PMC free article] [PubMed] [Google Scholar]
- 14.Viadiu H., Aggarwal A.K. Structure of BamHI bound to nonspecific DNA: a model for DNA sliding. Mol. Cell. 2000;5:889–895. doi: 10.1016/s1097-2765(00)80329-9. [DOI] [PubMed] [Google Scholar]
- 15.Newman M., Strzelecka T., Aggarwal A.K. Structure of Bam HI endonuclease bound to DNA: partial folding and unfolding on DNA binding. Science. 1995;269:656–663. doi: 10.1126/science.7624794. [DOI] [PubMed] [Google Scholar]
- 16.Rau D.C. Sequestered water and binding energy are coupled in complexes of lambda Cro repressor with non-consensus binding sequences. J. Mol. Biol. 2006;361:352–361. doi: 10.1016/j.jmb.2006.06.036. [DOI] [PubMed] [Google Scholar]
- 17.Sidorova N.Y., Rau D.C. Differences in water release for the binding of EcoRI to specific and nonspecific DNA sequences. Proc. Natl. Acad. Sci. USA. 1996;93:12272–12277. doi: 10.1073/pnas.93.22.12272. [DOI] [PMC free article] [PubMed] [Google Scholar]
- 18.Fried M.G., Crothers D.M. Kinetics and mechanism in the reaction of gene regulatory proteins with DNA. J. Mol. Biol. 1984;172:263–282. doi: 10.1016/s0022-2836(84)80026-1. [DOI] [PubMed] [Google Scholar]
- 19.Lieberman B.A., Nordeen S.K. DNA intersegment transfer, how steroid receptors search for a target site. J. Biol. Chem. 1997;272:1061–1068. doi: 10.1074/jbc.272.2.1061. [DOI] [PubMed] [Google Scholar]
- 20.Vuzman D., Azia A., Levy Y. Searching DNA via a “Monkey Bar” mechanism: the significance of disordered tails. J. Mol. Biol. 2010;396:674–684. doi: 10.1016/j.jmb.2009.11.056. [DOI] [PubMed] [Google Scholar]
- 21.Vuzman D., Polonsky M., Levy Y. Facilitated DNA search by multidomain transcription factors: cross talk via a flexible linker. Biophys. J. 2010;99:1202–1211. doi: 10.1016/j.bpj.2010.06.007. [DOI] [PMC free article] [PubMed] [Google Scholar]
- 22.Hu T., Shklovskii B.I. How a protein searches for its specific site on DNA: the role of intersegment transfer. Phys. Rev. E Stat. Nonlin. Soft Matter Phys. 2007;76:051909. doi: 10.1103/PhysRevE.76.051909. [DOI] [PubMed] [Google Scholar]
- 23.von Hippel P.H., Berg O.G. Facilitated target location in biological systems. J. Biol. Chem. 1989;264:675–678. [PubMed] [Google Scholar]
- 24.Doucleff M., Clore G.M. Global jumping and domain-specific intersegment transfer between DNA cognate sites of the multidomain transcription factor Oct-1. Proc. Natl. Acad. Sci. USA. 2008;105:13871–13876. doi: 10.1073/pnas.0805050105. [DOI] [PMC free article] [PubMed] [Google Scholar]
- 25.Iwahara J., Clore G.M. Direct observation of enhanced translocation of a homeodomain between DNA cognate sites by NMR exchange spectroscopy. J. Am. Chem. Soc. 2006;128:404–405. doi: 10.1021/ja056786o. [DOI] [PubMed] [Google Scholar]
- 26.Iwahara J., Zweckstetter M., Clore G.M. NMR structural and kinetic characterization of a homeodomain diffusing and hopping on nonspecific DNA. Proc. Natl. Acad. Sci. USA. 2006;103:15062–15067. doi: 10.1073/pnas.0605868103. [DOI] [PMC free article] [PubMed] [Google Scholar]
- 27.Takayama Y., Clore G.M. Interplay between minor and major groove-binding transcription factors Sox2 and Oct1 in translocation on DNA studied by paramagnetic and diamagnetic NMR. J. Biol. Chem. 2012;287:14349–14363. doi: 10.1074/jbc.M112.352864. [DOI] [PMC free article] [PubMed] [Google Scholar]
- 28.Zandarashvili L., Vuzman D., Iwahara J. Asymmetrical roles of zinc fingers in dynamic DNA-scanning process by the inducible transcription factor Egr-1. Proc. Natl. Acad. Sci. USA. 2012;109:E1724–E1732. doi: 10.1073/pnas.1121500109. [DOI] [PMC free article] [PubMed] [Google Scholar]
- 29.Sidorova N.Y., Rau D.C. Linkage of EcoRI dissociation from its specific DNA recognition site to water activity, salt concentration, and pH: separating their roles in specific and non-specific binding. J. Mol. Biol. 2001;310:801–816. doi: 10.1006/jmbi.2001.4781. [DOI] [PubMed] [Google Scholar]
- 30.Graham J.S., Johnson R.C., Marko J.F. Concentration-dependent exchange accelerates turnover of proteins bound to double-stranded DNA. Nucleic Acids Res. 2011;39:2249–2259. doi: 10.1093/nar/gkq1140. [DOI] [PMC free article] [PubMed] [Google Scholar]
- 31.Sidorova N.Y., Muradymov S., Rau D.C. Trapping DNA-protein binding reactions with neutral osmolytes for the analysis by gel mobility shift and self-cleavage assays. Nucleic Acids Res. 2005;33:5145–5155. doi: 10.1093/nar/gki808. [DOI] [PMC free article] [PubMed] [Google Scholar]
- 32.Rau D.C., Sidorova N.Y. Diffusion of the restriction nuclease EcoRI along DNA. J. Mol. Biol. 2010;395:408–416. doi: 10.1016/j.jmb.2009.10.049. [DOI] [PMC free article] [PubMed] [Google Scholar]
- 33.Sidorova N.Y., Rau D.C. Differences between EcoRI nonspecific and “star” sequence complexes revealed by osmotic stress. Biophys. J. 2004;87:2564–2576. doi: 10.1529/biophysj.104.042390. [DOI] [PMC free article] [PubMed] [Google Scholar]
- 34.Levitz P., Zinsmeister M., Poncelet O. Intermittent Brownian dynamics over a rigid strand: heavily tailed relocation statistics in a simple geometry. Phys. Rev. E Stat. Nonlin. Soft Matter Phys. 2008;78:030102. doi: 10.1103/PhysRevE.78.030102. [DOI] [PubMed] [Google Scholar]
- 35.DeSantis M.C., Li J.L., Wang Y.M. Protein sliding and hopping kinetics on DNA. Phys. Rev. E Stat. Nonlin. Soft Matter Phys. 2011;83:021907. doi: 10.1103/PhysRevE.83.021907. [DOI] [PMC free article] [PubMed] [Google Scholar]
- 36.Wright D.J., Jack W.E., Modrich P. The kinetic mechanism of EcoRI endonuclease. J. Biol. Chem. 1999;274:31896–31902. doi: 10.1074/jbc.274.45.31896. [DOI] [PubMed] [Google Scholar]
- 37.Wright D.J., King K., Modrich P. The negative charge of Glu-111 is required to activate the cleavage center of EcoRI endonuclease. J. Biol. Chem. 1989;264:11816–11821. [PubMed] [Google Scholar]
- 38.Alves J., Urbanke C., Pingoud A. Fluorescence stopped-flow kinetics of the cleavage of synthetic oligodeoxynucleotides by the EcoRI restriction endonuclease. Biochemistry. 1989;28:7879–7888. doi: 10.1021/bi00445a050. [DOI] [PubMed] [Google Scholar]
- 39.van den Broek B., Lomholt M.A., Wuite G.J. How DNA coiling enhances target localization by proteins. Proc. Natl. Acad. Sci. USA. 2008;105:15738–15742. doi: 10.1073/pnas.0804248105. [DOI] [PMC free article] [PubMed] [Google Scholar]
- 40.Lomholt M.A., van den Broek B., Metzler R. Facilitated diffusion with DNA coiling. Proc. Natl. Acad. Sci. USA. 2009;106:8204–8208. doi: 10.1073/pnas.0903293106. [DOI] [PMC free article] [PubMed] [Google Scholar]
Associated Data
This section collects any data citations, data availability statements, or supplementary materials included in this article.