

Abstract
It has been posited that a critical function of sleep is synaptic renormalization following a net increase in synaptic strength during wake. We hypothesized that wake would alter the resting-state functional organization of the brain and increase its metabolic cost. To test these hypotheses, two experiments were performed. In one, we obtained morning and evening resting-state functional MRI scans to assess changes in functional brain organization. In the second experiment, we obtained quantitative positron emission tomography measures of glucose and oxygen consumption to assess the cost of wake. We found selective changes in brain organization. Most prominently, bilateral medial temporal regions were locally connected in the morning but in the evening exhibited strong correlations with frontal and parietal brain regions involved in memory retrieval. We speculate that these changes may reflect aspects of memory consolidation recurring on a daily basis. Surprisingly, these changes in brain organization occurred without increases in brain metabolism.
Keywords: functional magnetic resonance imaging, functional connectivity, resting state, sleep, memory, consolidation, diurnal, circadian default mode network, positron emission tomography, metabolism
several hypotheses attempt to explain why we must sleep. One prominent idea is the synaptic homeostasis hypothesis, which suggests that a major function of sleep is the regulation of synaptic weights: over the course of a day, learning and experience cause an increase in the brain's synaptic density, which is pruned each night during sleep (Gilestro et al. 2009; Tononi and Cirelli 2003). An important corollary of this hypothesis is that an increase in synaptic density should boost the metabolic cost of brain function, because the majority of that cost originates in the synapses (for a recent review see Raichle and Mintun 2006). Despite an extant literature on quantitative measures of brain circulation and metabolism in relation to sleep in humans (Andersson et al. 1998; Boyle et al. 1994; Braun et al. 1997; Buchsbaum et al. 1989; Madsen et al. 1991a, 1991b; Mangold et al. 1955; Thomas et al. 2003) and laboratory animals (Kennedy et al. 1976; Reivich et al. 1968; Vyazovskiy et al. 2008), an adequate test of this cost-based hypothesis remains to be done.
Another hypothesized role of sleep, compatible with the synaptic homeostasis hypothesis, is that sleep facilitates efficient encoding and storage of memories (Walker and Stickgold 2004). Performance on newly learned material is improved following sleep, even in the absence of further practice (Karni et al. 1994; Marshall and Born 2007; Robertson et al. 2004). The experience of forming new episodic or procedural memories often induces electroencephalography (EEG) changes during sleep on the following night (De Koninck et al. 1989; Gais et al. 2002; Huber et al. 2004; Massimini et al. 2009). Over the course of months and years, both declarative and nondeclarative memories are consolidated from medial-temporal regions to neocortical areas (Squire and Alvarez 1995), a process linked to replay of neural activity during sleep (Foster and Wilson 2006; Lee and Wilson 2002; Skaggs and McNaughton 1996).
The accumulation of synaptic connections, in concert with the acquisition of unconsolidated information over the course of a day, would likely influence the way neurons and brain regions communicate with one another. One measure of the relationships between brain regions is resting-state functional connectivity obtained with magnetic resonance imaging (RS-fcMRI) (Biswal et al. 1995; Fox et al. 2005). This technique investigates shared variance in the spontaneous fluctuations of the blood oxygen level-dependent (BOLD) functional magnetic resonance imaging (fMRI) signal between distinct brain regions, generally either by calculating correlation coefficients or through independent component analysis (Zhang and Raichle 2010).
RS-fcMRI can serve as a sensitive marker for many alterations in brain function. For example, changes in RS-fcMRI have been documented as a consequence of many diseases (Zhang and Raichle 2010), under anesthesia (Martuzzi et al. 2010), following extended training (Lewis et al. 2009), and during task performance (Fransson 2006). Although two recent reports have indicated that default-mode network integrity is diminished during sleep deprivation (De Havas et al. 2011; Sämann et al. 2010) and that the functional connectivity between the hippocampal formation and the rest of the default-mode network varies during different stages of sleep (Andrade et al. 2011), neither study examined morning-evening variation in brain functional organization while subjects maintained a typical sleep schedule.
We used positron emission tomography (PET) and RS-fcMRI to investigate whether the cumulative effects of daily experiences (wake) are reflected in diurnal changes in relationships among brain regions and whether such changes are reflected in an increase in the consumption of oxygen and glucose, the primary sources of brain energy.
EXPERIMENTAL PROCEDURES
We assessed differences in brain metabolism and RS-fcMRI between morning and evening in a total of 34 young adult subjects. Extensive quality control, including sleep assessments and EEG monitoring, was performed to ensure that these subjects were healthy typical sleepers. PET measurements were compared on both a global and regional basis. RS-fcMRI was analyzed using both a set of 36 a priori regions of interest, as well as an iterative whole brain search technique (IDEA).
Sleep assessments.
Extensive measures were taken to ensure that our subjects were typical of the healthy population and did not suffer from severe sleep-related problems. In both the PET and fMRI studies, the Epworth Sleepiness Scale (ESS) and Pittsburgh Sleep Quality Index (PSQI) were used to evaluate subjects' sleep habits. Information was also collected from a sleep diary that was kept over a 1-wk period (6–8 days), with results confirmed by simultaneously acquired actigraphy. Results are shown in Table 1.
Table 1.
Subject sleep data
| PET |
fMRI |
||||
|---|---|---|---|---|---|
| Category | Mean ± SD | Range | Mean ± SD | Range | Norms |
| Total sleep time, h | 7.26 ± 0.53 | 6.72–8.25 | 6.97 ± 0.48 | 5.82–7.90 | 7–9 h |
| Owl/lark (MEQ) | 44.7 ± 4.8 | 35–56 | 50.0 ± 5.5 | 42–58 | Morning type: 59–86 Evening type: 16–41 |
| Sleep efficiency, % | 92.1 ± 2.2 | 87.3–95.4 | 88.7 ± 4.0 | 80.6–96.8 | >85 |
| PSQI | 3.70 ± 2.71 | 1–8 | 3.08 ± 1.35 | 0–5 | Test ranges 0–21; >5 indicates poor sleep quality |
| ESS | 6.10 ± 2.56 | 3–12 | 6.58 ± 2.69 | 2–11 | Test ranges 0–24; <10 is healthy |
| SWS, % | 8.2 ± 7.5 | 0–18.4 | 20 | ||
| REM, % | 20.0 ± 7.1 | 4.4–27.3 | 20 | ||
PET, positron emission tomography; fMRI, functional magnetic resonance imaging; MEQ, Morningness-Eveningness Questionnaire; PSQI, Pittsburgh Sleep Quality Index; ESS, Epsworth Sleepiness Scale; SWS, slow-wave sleep; REM, rapid eye movement sleep.
Subjects in the PET study were also monitored with overnight EEG. In the week before the PET scans, each subject spent one night in our sleep laboratory to become acclimated to sleeping in an unfamiliar environment. In the night between the evening PET scan and the morning PET scan, subjects spent a second night in the sleep laboratory. EEG measures were obtained and scored to quantify the amount of time spent in slow-wave sleep (SWS) and rapid eye movement (REM) sleep. These subjects were also monitored for apnea and hypopnea, evaluated using the apnea-hypopnea index (AHI).
Subjects fell within a normal range on most measures. One exception is the amount of time spent in SWS, which was about half the normal range. We attribute this to the laboratory environment; some subjects were probably not completely acclimated after a single night in the laboratory (Kingshott and Douglass 2000). These subjects were very likely normal sleepers in their own beds. We tested whether there was any relationship between individuals' SWS and global PET measures, and found no significant correlations.
Two subjects (1 each from the PET and fMRI studies) fell outside the normal range on the ESS. Their scores were 11 and 12, respectively, whereas the normal range is 0–10 on a scale of 0–24. One of these subjects also scored outside the normal range on the PSQI (a score of 8 on a scale of 0–21, with a normal range of 0–5). These scores are not indicative of severe sleep disturbances. Because we wanted to sample the typical population, in which mild sleepiness is not uncommon, we chose to retain the data from these subjects in our analyses.
fMRI subjects.
We obtained resting-state fMRI scans in 24 healthy young adults in the morning and the evening (15 male; ages 23–30 yr, mean age 25.9 yr). All subjects were right-handed native English speakers with no history of neurological or psychiatric disorder. All experiments were approved by the Institutional Review Board of Washington University Medical School, and each subject gave written informed consent. Handedness was assessed using the Edinburgh Handedness Inventory (Oldfield 1971). Subjects were scanned ∼1 h after their usual wake time and 2 h before their usual bed time. The order of the morning and evening scans was counterbalanced across subjects. Heavy caffeine drinkers (those who consumed more than 1 cup of coffee or equivalent per day) were also excluded, and subjects were asked to abstain from caffeine for 24 h before the first scan.
We took a number of steps to ensure we included only healthy normal sleepers in the experiment. Subjects were queried about their sleep habits using the PSQI (Buysse et al. 1989) and the ESS (Johns 1991). For the week preceding the scans, subjects wore an actigraph, a wristwatch-like accelerometer that monitored movement (American Sleep Disorders Association 1995). Actigraphy data were analyzed to ensure that subjects maintained normal sleeping patterns before the scan. All subjects' sleep patterns fell within a normal range (none exceeded 3SD from the mean on any measure), and no subjects were excluded on the basis of these data. The ESS showed no significant differences in sleepiness between morning and evening scans.
MRI acquisition.
Structural and functional scans were performed with a 3-Tesla Siemens TRIO MRI. Structural data included a high-resolution, axial T1-weighted magnetization-prepared gradient-echo (MP-RAGE) scan and a high-resolution T2-weighted fast spin-echo scan for definitive atlas transformation. Functional data were acquired using a gradient-echo, echo-planar sequence sensitive to BOLD contrast (echo time, 25 ms; flip angle, 90°; 4 × 4 × 5-mm voxels; field of view, 256 × 256; repetition time, 2.08 s; bandwidth, 2,605 Hz). Two runs with 150 frames each were performed.
Resting-state functional connectivity analysis.
Data were preprocessed using previously described techniques (Fox et al. 2009). This included a low-pass filter (0.1 Hz), spatial blur (Gaussian kernel, 6.2-mm full-width at half-maximum), and removal of nuisance regressors [signals from bilateral areas of white matter (cingulum; centered at ±32, −20, 30), lateral ventricles (±6, −10, 20), and whole brain; rotational and translational movement]. Average root-mean-squared movement across all subjects was 0.21 mm in the morning scans and 0.23 mm in the evening scans (P = 0.41). No subjects were excluded due to excessive movement. MR frames with excessive movement were excluded from consideration (those exhibiting movement-induced signal drop-off of more than 3 SD). Differences between morning and evening scans were assessed using an iterative data-driven algorithm (IDEA), as described below.
Iterative data-driven evolutionary algorithm.
We employed a recently published technique to identify functional connectivity relationships that are reliably different between morning and night (Shannon et al. 2011). This algorithm searches throughout the brain for regions whose functional connectivity patterns can be used to predict independent variables (in this case, morning/evening status). The principal difference between IDEA and other strategies aimed at the same objective (to identify RS-fcMRI features that discriminate between groups or across continuous variables; Dosenbach et al. 2010; Krishnan et al. 2010; Supekar et al. 2008; Yang et al. 2010) is that the set of regions used for prediction is iteratively updated.
Our previous work with this algorithm identified functional connectivity effects associated with impulsivity in juveniles, using a continuous measure of impulsivity as the independent variable of interest. Here we adapted the algorithm to compare morning and evening resting-state scans within subjects (i.e., using a paired, discrete, independent variable).
IDEA searches for regions whose functional connectivity is systematically altered in relation to the variable of interest. For example, a region would have strong predictive power if it very consistently showed high functional connectivity to the precuneus in the morning and low functional connectivity in the evening. Predictive power is computed quantitatively by creating a map of the paired t-statistic comparing a region's functional connectivity in the morning and in the night (see step 1 below).
The key principal underlying IDEA is that correlation is a symmetrical relation. Any region with predictive power must express this predictive power through its functional connectivity with at least one other region. Therefore, we may identify new predictive regions by locating peaks in the functional connectivity/independent variable maps. We then repeat this procedure on the new regions, generating further regions in an iterative fashion. IDEA depends on three distinct procedures: 1) a procedure to quantitatively evaluate a region's predictive power; 2) a procedure to identify new, potentially predictive regions by exploiting the symmetry property of correlation maps; and 3) a procedure to update the set of regions. These steps have been extensively described previously (Shannon et al. 2011). The algorithm is initialized by placing a number of regions into the testing set. Here, we used 36 “canonical” regions representing well-defined nodes in prominent brain networks, including the default-mode, dorsal-attention, executive-control, salience, visual, auditory, and motor networks (Raichle 2011). Critically, the entorhinal regions ultimately identified as highly predictive were not included in this initial set. Steps 1–3 are then iterated.
Predicting morning/evening status from functional connectivity.
The predictive ability of IDEA was tested using a leave-one-out cross-validation scheme. IDEA was run using data from 23 of the 24 subjects. Using the regions identified by IDEA, we generated a predictive model relating functional connectivity measurements to morning/evening status. We input data from the left-out subject into the model and evaluated its accuracy. Below we describe the predictive model using pseudocode:
For each left-out subject indexed by j {
-Run IDEA.
- -For each identified region indexed by i {-Voxelwise compute the map ti(x,y,z), the paired t-test of morning/evening status on functional connectivity. Subject this map to cluster-based thresholding as described above, yielding a binary significance map wi. Thus the value of a voxel in wi is 1 if the absolute value of the voxel's t-statistic is greater than 3 and it is contiguous with at least 9 other voxels above threshold; otherwise it is 0.-Compute the morning-minus-evening difference map Δi for region i using data from the left-in 23 subjects.-Compute the morning-minus-evening difference map δi for region i using data from the left-out subject.-Evaluate the similarity between Δi and δi within significant voxels as follows:where the integral is taken over the volume of the image. If Yj is positive, the model has correctly predicted the morning/evening status of the left-out subject's two scans. If it is negative, it is incorrect.
}
}
Predictions were generated and tested for each left-out subject. Statistical significance was assessed using a chi-square test to compare the model's performance to chance performance of 50% accuracy.
PET subjects.
Ten subjects (5 female, ages 22–28 yr, mean age 22.5 yr) participated in the experiment. All subjects were right-handed native English speakers with no history of neurological or psychiatric disease. All experiments were approved by the Institutional Review Board of Washington University Medical School, and each subject gave written informed consent. Extensive prescreening and monitoring was performed to ensure that each subject was a healthy, typical sleeper who was fully rested on the day of the scans. Questionnaires (the PSQI, ESS, and Morningness-Eveningness Questionnaire) were administered to each subject. Each subject kept a sleep diary for 6–8 days before the scan, and diaries were confirmed with simultaneously acquired actigraphy. Subjects spent 2 nights in our sleep laboratory. The purpose of the first night was to acclimate the subjects to sleeping in an unfamiliar location; the second was to monitor their sleep cycles using EEG. Scans were performed at approximately 9:00 AM and 9:00 PM. All subjects were scanned first in the evening, second in the morning. During the intervening night, subjects slept in the sleep laboratory, with sleep stages monitored by continuously acquired EEG. Full results of these questionnaires and EEG overnights are available in Table 1.
PET acquisition.
PET imaging was performed using a Siemens ECAT HRplus 962 scanner. Two PET scanning sessions were performed on each subject, one in the evening (study visit day +1) and one in the morning (study visit day +2). Before each PET session, an antecubital intravenous catheter was placed in the arm for tracer injection and blood sampling for glucose levels. Each PET session lasted ∼3 h and consisted of seven PET scans and two transmission scans. The first transmission scan was acquired before any PET scans. Before the first PET scan, subjects were asked to inhale 40–75 mCi of radioactive carbon monoxide. Before the second PET scan, subjects were asked to inhale 40–75 mCi of radioactive oxygen. Before the third PET scan, subjects were injected with 25–50 mCi of radioactive water. The fourth to sixth PET scans were repetitions of the first to third scans. A second transmission scan was then acquired. For the seventh PET scan, a measurement of cerebral metabolic rate of glucose (CMRGlu) was initiated with an ∼20-s bolus intravenous injection of 5 mCi of [18F]fluorodeoxyglucose (FDG), immediately followed by a concomitant 60-min dynamic scan. Before the injection of FDG, a blood sample was withdrawn for measurement of glucose. A second blood sample was withdrawn ∼30 min from the start of the FDG scan. All scans were obtained in the resting state; subjects were asked to lay quietly with their eyes open. Subject motion was minimized by fitting a thermoplastic mask over the face. Investigators spoke to subjects briefly between each scan and at 15-min intervals during the FDG scan to ensure the subjects had not fallen asleep.
PET analysis.
The arterial input function (AIF) was estimated noninvasively by sampling activity in the carotid artery (Su et al. 2010, 2012). MP-RAGE and time-of-flight magnetic resonance angiography (TOF-MRA) images were coregistered to PET data and used to identify the petrous portion of the internal carotid artery. Regional activity for each PET image was extracted for a region of interest (ROI) representing the artery and a separate ROI immediately surrounding the arterial ROI. A two-tissue mixture model (artery and background) was assumed in the vicinity of the artery, and a linear system equation was solved to estimate the AIF.
In the above equation, aa, ab, ba, and bb are recovery and spillover coefficients defined on the basis of scanner point-spread function (customized to each radioactive tracer) and the artery/background segmentation. Ma and Mb are the measured PET signals in the arterial ROI and background ROI, respectively. The equation is solved for Ca and Cb, the concentrations of radioactive tracer in the artery and background tissue, respectively.
This estimate of AIF was then used in conjunction with standard techniques to calculate absolute measures of cerebral blood flow (CBF), cerebral blood volume (CBV), cerebral metabolic rate of oxygen (CMRO2) (Videen et al. 1987), and CMRGlu (Lucignani 1993). CBF was measured with a 40-s emission image (derived from a 120-s dynamic scan) after rapid injection of 25–50 mCi of [15O]water in saline (Raichle et al. 1983; Videen et al. 1987). CBV was measured with a 5-min emission scan beginning 2 min after brief inhalation of 40–75 mCi of [15O]carbon monoxide in room air (Martin et al. 1987; Videen et al. 1987). CMRO2 was measured with a 40-s emission scan (derived from a 120-s dynamic scan) after brief inhalation of 40–75 mCi of [15O]oxygen in room air (Mintun et al. 1984; Videen et al. 1987). Recirculating [15O]water of metabolism was measured and accounted for using the technique of Iida et al. (1993). Parametric images of net FDG trapping were created by application of the Patlak graphical method (Patlak and Blasberg 1985; Patlak et al. 1983). The noninvasively calculated AIF, derived from a linear-mixture model, was used in place of arterial blood sampling. Time-activity curves were then analyzed in the standard manner. Because calculation of FDG trapping was based on whole blood time-radioactivity data and not plasma activity, we calculated glucose concentration of whole blood as the mean of the plasma samples times [1 − (0.30 × hematocrit)] (Dillon 1965). Implicit in these calculations is the assumption that there exists rapid equilibration between plasma and intraerythrocyte glucose. This has been demonstrated for human blood (Lefevre and McGinnis 1960; Murphy 1960).
Quantitatively accurate estimates of CMRGlu from FDG uptake require the lumped constant correction factor, since glucose and fluorodeoxyglucose are transported and metabolized to different degrees. There is controversy over the correct value for the lumped constant in normal brain. Measured values range from 0.52 to 0.886 and are to some extent dependent on the exact method used to compute net FDG uptake (Hasselbalch et al. 1993, 1998; Reivich et al. 1985; Spence et al. 1998). The precise value of the lumped constant used for the experiments that we propose is not important, since it is a linear scaling factor applied to all the FDG trapping data and thus will not affect the statistical tests. We only assume that it is constant for the experimental conditions that we study. Since the lumped constant changes appreciably only in tumors or under conditions when glucose transport across the blood-brain barrier approaches the metabolic rate (such as ischemia and hypoglycemia), this is a reasonable assumption (Ball et al. 1988; Crane et al. 1981; Nakai et al. 1987; Spence et al. 1998). For these reasons we arbitrarily set the lumped constant to 1.0 in the calculation of regional and temporal changes in CMRGlu.
We have assessed regional differences in resting CMRO2, CMRGlu, and aerobic glycolysis in a manner independent of whole brain quantitative measures (Vaishnavi et al. 2010). This strategy differs somewhat from that originally described in which absolute rates for CMRGlu and CMRO2 were determined (Mintun et al. 1984; Videen et al. 1987). For each subject, measures of CBF, CBV, CMRO2, and CMRGlu were aligned to each other and then to the subjects' MRI scans. The realigned data were then transformed to atlas space using in-house software and scaled to a whole brain mean of 1 (local-to-global ratio as in Raichle et al. 2001). Our atlas-representative target image represents Talairach space as defined by Mazziotta et al. (1995). The ratio of oxygen to glucose consumption (OGI) was computed by a voxelwise division of CMRO2 by CMRGlu to compute a local-to-global OGI. For comparison with traditional OGI measures, this ratio was scaled by 5.323 (Raichle et al. 1970).
Regional PET measurements.
We believe that the PET measurements obtained in this experiment are likely to be of use to other investigators. Thus we have included a spreadsheet in Supplemental Materials that contains all measurements for each subject, calculated regionally for each Brodmann area. (Supplemental data for this article is available at the Journal of Neurophysiology website.)
RESULTS
Functional connectivity.
In the first experiment we used RS-fcMRI to investigate whether the cumulative effect of daily experiences is reflected in morning and evening changes in relationships among brain regions. We obtained resting-state fMRI scans in a group of 24 healthy young adults in the morning and the evening. The order of acquisition was counterbalanced such that half the subjects were scanned first in the morning and then in the evening of the same day, and half were scanned first in the evening and then in the morning of the next day. Subjects were healthy normal sleepers, as verified by sleep diaries, actigraphy, and a battery of questionnaires.
Increases in synaptic strength over wake, as posited by the synaptic homeostasis hypothesis, might well be expected to result in systematic changes in functional connectivity. As an initial test of this hypothesis we used 36 regions representing nodes of several major brain networks and calculated the correlation between each pair of regions during morning scans and evening scans (Fig. 1). No system-wide changes were observed. Intranetwork functional connectivity, as well as positive and negative correlations between networks, appeared unchanged. Furthermore, no individual pair of regions showed significant morning-evening differences after correction for multiple comparisons.
Fig. 1.

Functional connectivity is largely unchanged between morning and evening. Cross-correlation matrices between 36 brain regions are shown for morning and evening scans. No significant differences were observed following correction for multiple comparisons. The location and center-of-mass coordinates for each region are listed at top right. These locations are displayed visually on an inflated brain at bottom right.
The 36 regions used in the above-described experiment represent important network nodes, but they cover only a fraction of the total brain volume. Therefore, we used a recently developed IDEA to search throughout the brain for regions exhibiting systematic differences in RS-fcMRI between morning and evening (Fig. 2). The operation of IDEA is described in detail in Shannon et al. (2011), as well as in experimental procedures. Briefly, it begins with the same set of 36 regions described above. For each region, it compares the scans of each subject to search for areas whose functional connectivity systematically increases or decreases between morning and evening. These areas are themselves possible sites of interest, so the algorithm investigates them in the same way it investigated the original 36 regions. Each region is rated for the extent to which its RS-fcMRI changes between scans. This process continues iteratively until the algorithm converges on the highest rated regions, i.e., those whose RS-fcMRI is most significantly altered between morning and evening.
Fig. 2.
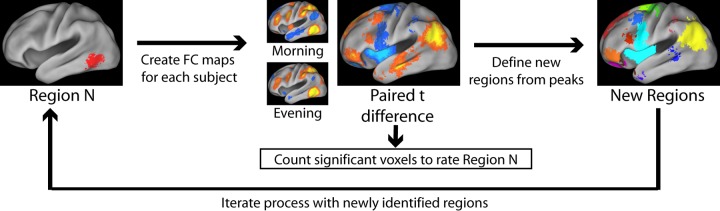
An iterative, data-driven evolutionary algorithm (IDEA) technique to identify changes in functional connectivity. We begin with a set of 36 regions, representing the major resting networks of the brain (see Fig. 1). For each region (“region N”), we perform a paired t-test to identify clusters of voxels whose correlation with the seed region differs between morning and evening. Each region is rated based on the number of significantly different voxels. Peaks on the morning-evening difference map represent areas that are themselves of interest. Regions are defined about these peaks and are rated and generate new regions in an iterative manner.
Our analysis identified two regions with strongly altered RS-fcMRI in the left and right medial temporal lobe (MTL; Fig. 3). It is noteworthy that these two regions are bilaterally symmetrical, even though IDEA provides no incentive or constraint to encourage symmetry. Functional connectivity patterns of the two regions, and their changes between morning and evening, were quite similar.
Fig. 3.

Functional connectivity of medial temporal lobe (MTL) changes between morning and night. MTL regions were identified in a search for circadian changes in functional connectivity. Correlations are largely local in the morning, whereas in the evening they extend to prefrontal and posterior parietal default-mode network regions.
In the morning, the regions in left and right MTL were primarily connected locally with correlations in contralateral MTL, the surrounding area, and the temporal poles, as well as negative correlations in the striatum bilaterally (Fig. 4).
Fig. 4.

Detailed map of MTL functional connectivity changes between morning and evening. Using the average signal from left and right MTL regions, we calculated correlation maps for morning and evening scans. A paired t-test, subjected to cluster-based thresholding, identifies differences between morning and evening. Transverse and sagittal views are shown; atlas coordinates are listed below each slice.
In the evening, the regions of the left and right MTL displayed functional connectivity with neocortical areas, including the retrosplenial cortex, and nearby posterior cingulate and precuneus, bilateral angular and supramarginal gyri, and dorsolateral and dorsomedial prefrontal cortex. The MTL also exhibited in the evening positive correlations with the pontine tegmentum and with bilateral basal ganglia, as well as negative correlations bilaterally with the anterior insula. The negative correlations with the striatum became positive correlations in the evening.
Strikingly, the neocortical regions to which MTL develops correlations in the evening are all closely involved in memory retrieval. Each consistently exhibits the retrieval success effect, in which activity in the regions is greater when subjects view previously experienced items compared with novel stimuli (Wagner et al. 2005). To confirm this overlap, we compared the map of morning/evening RS-fcMRI differences to a meta-analysis of fMRI memory studies investigating the retrieval success effect (Fig. 5). The overlap is remarkable, including medial and lateral parietal cortex as well as dorsolateral prefrontal and dorsomedial prefrontal regions. Moreover, we note that the anterior insula bilaterally are also often recruited during memory retrieval. Most consistently, their activity increases when subjects attempt to retrieve the source of a memory, successfully or unsuccessfully (Dobbins et al. 2003; Lundstrom et al. 2005).
Fig. 5.
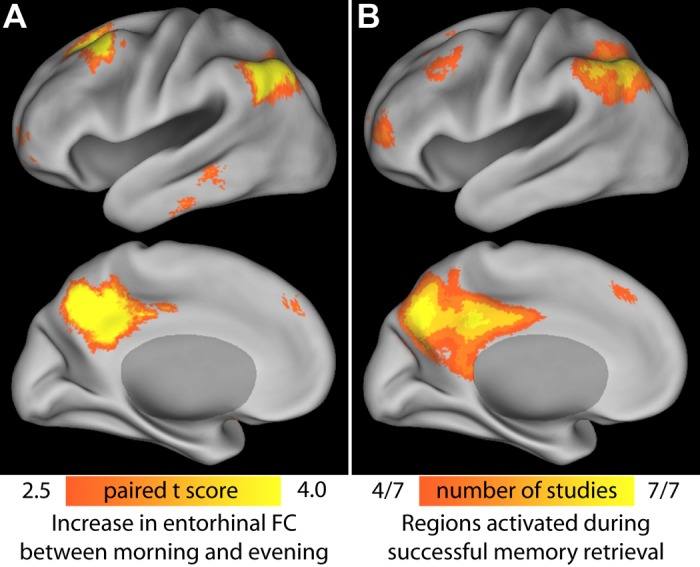
Overlap between MTL morning and evening changes in functional connectivity with regions recruited during memory retrieval. A: average increase in correlation between morning and evening for left and right MTL. The left hemisphere is displayed; right hemisphere exhibits a very similar pattern. B: meta-analysis of 7 memory retrieval experiments. The retrieval success effect (greater activity for old items compared with novel stimuli during a recognition-memory task) was mapped in 7 different experiments. Voxels significant at P < 0.001 in 4 or more of those experiments are shown. [Adapted from Wagner et al. 2005, Fig. 1.]
Statistical validation.
The iterative approach used in this study employs a very large number of comparisons to arrive at a final set of regions. It was therefore important to assess the reliability of the algorithm. To that end, we used leave-one-out cross-validation to test whether our method could predict the morning/evening status of scans from individuals whose data did not contribute to the generated model (Hastie et al. 2009). We repeated our analysis 24 times, each time leaving out a different subject's morning and evening scans. We used the algorithm to make a prediction for which of the two left-out scans was performed in the evening and which was performed in the morning. This strategy addresses the issue of multiple comparisons: if the results that have been found on 23 subjects are indeed false positives due to multiple comparisons, then the morning/evening prediction from the left-out subject's scan data will show only chance accuracy.
Our predictions fared far above chance. This operation correctly identified the morning and evening scans in 21 of 24 instances (χ2 = 13.5; P < 0.001). This, in combination with the bilateral symmetry of the MTL regions, as well as the identification of meaningful sets of memory-related regions, indicates that the algorithm uncovered real information about the brain. The algorithm was also quite consistent in its results. In all 24 instances, our algorithm identified the right MTL region as the region with the most altered RS-fcMRI; in 20 instances, it identified the left MTL region as the second most altered region.
One of the free parameters of IDEA is the number of regions contributing to the model. We evaluated the model's accuracy using 1 to 10 regions (Fig. 6). Accuracy was highest with just 1 region at 87.5% and still significantly above chance with 2 regions at 70.8%. In each of the 24 leave-one-out instances, right entorhinal cortex was identified as the most predictive region; in 20 instances, left entorhinal cortex was the second most predictive region.
Fig. 6.
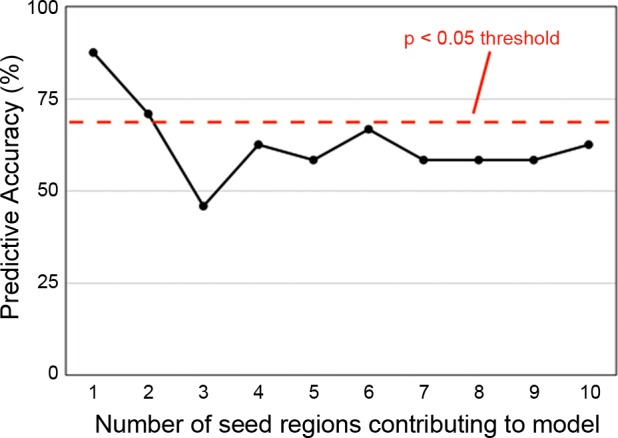
Dependence of prediction accuracy on selection of regions of interest (ROIs) used to compute the prediction. The IDEA algorithm identifies many regions sorted by decreasing power to discriminate morning vs. evening status. The plot shows the effect of including progressively more ROIs from the sorted list. Predictive accuracy peaked with a single region (right entorhinal cortex) and remained above chance with a second region (left entorhinal cortex).
We have chosen to focus our discussion on entorhinal cortex because no other regions appear to contribute accuracy to the model. We discuss both left and right regions, rather than exclusively right, because we believe this reflects the underlying biology of the system. The model's accuracy is lower with the left region included, but the anatomic location of the left region is closely symmetrical with the right, and it displays very similar patterns of functional connectivity. The symmetry of the predictive seeds as well as the associated morning vs. evening difference maps are unlikely to be a result of random chance.
Brain metabolism.
To assess daily variation in brain metabolic costs, we obtained PET measurements in a second group of 10 subjects in the morning and in the evening. We verified with sleep diaries and questionnaire that subjects were healthy normal sleepers. Subjects slept 2 nights in the laboratory before the scans; their sleep patterns were monitored with EEG. We obtained scans using 15O2, H215O, C15O, and FDG. These allowed us to calculate several measures of brain metabolism, including CBF and CBV, CMRGlu and CMRO2, oxygen-extraction fraction (OEF), and OGI (for a detailed review of these methods see Vaishnavi et al. 2010). To improve signal-to-noise ratio, each scan employing a 15O-labeled tracer was performed twice. With these measurements, we quantified global metabolic rates using a recently developed image-based algorithm to determine the arterial input function (Su et al. 2010, 2012). We also calculated maps of local-to-global ratios using techniques developed in our laboratory (Vaishnavi et al. 2010).
Somewhat to our surprise, the cost of brain function as measured by oxygen utilization (the most direct measurement of ATP use available with PET) and glucose consumption (a measure of both aerobic glycolysis and oxidative phosphorylation) was unchanged between morning and evening (Fig. 7A). Paired t-tests across the 10 subjects indicated that none of the measures were significantly different. Local-to-global ratios also revealed no difference between morning and evening. We performed voxelwise paired t-tests for CBF, CMRGlu, and CMRO2. No significant differences were observed. Using standard confidence interval analysis, we can estimate with 95% confidence that the CBF change was between −7% and +8%, the change in glucose uptake was between −18% and +10%, and the change in oxygen consumption was between −17% and +7%. These confidence intervals are far smaller than the consistent variations seen between different brain regions (Fig. 7, B–D). They are also far smaller than activity-related changes, which can range as high as a 68% increase in CBF (Ito et al. 2001).
Fig. 7.

Measures of brain metabolism in morning and evening. A: metabolic measures from whole brain samples. Cerebral blood flow (CBF; ml·g−1·min−1), oxygen extraction fraction (OEF; %), cerebral blood volume (CBV; ml/100 g), cerebral metabolic rate of oxygen (CMRO2; μmol·100 g−1·min−1), cerebral metabolic rate of glucose (CMRglu; μmol·100 g−1·min−1), and the oxygen-glucose index (OGI; unitless) were calculated for each subject's morning and evening scans. Each measure is displayed following normalization to the morning mean (i.e., both morning and evening values were divided by the morning values); this mean is shown at the top of the graph. Paired t-tests revealed no significant differences between morning and evening on any measure. B–D: local-to-global ratios of CMRglu (B), CMRO2 (C), and CBF (D) are plotted on atlas brain surfaces. The color scale applies to all 3 measures. Although substantial regional variation is apparent, each measure is quite similar between morning and evening.
Acquiring quantitative measurements of CMRO2 and CMRGlu together in the same subjects permitted us to calculate global as well as regional levels of aerobic glycolysis (i.e., that fraction of glucose metabolized by the brain outside of oxidative phosphorylation). Because of the important role played by aerobic glycolysis in cellular biosynthesis and viability (Lunt and Vander Heiden 2011), this was a measurement of particular interest to us. Again, we found no differences between morning and evening in our subjects.
Finally, we tested whether the notable changes in the functional connectivity of left and right MTL and neocortex (experiment 1) were associated with any metabolic changes. We performed a post hoc analysis to test whether MTL or any of the frontal and parietal neocortical areas described above exhibited any changes in any of the PET measures of metabolism between morning and evening. No changes for any region for any measure were significant following multiple comparison correction.
DISCUSSION
Functional connectivity.
Our data reveal that medial temporal lobe functional connectivity changes dramatically over a normal daily period of wake. These bilateral changes in MTL functional connectivity are likely related, at least in part, to memory function.
MTL has been extensively characterized as critical in the storage and retrieval of memories (Squire et al. 2004). The prefrontal and posterior parietal regions have received less attention, but they are also associated with memory retrieval (Konishi et al. 2000). fMRI studies of memory retrieval have consistently found that these regions show greater activity in response to previously experienced items compared with novel stimuli (Konishi et al. 2000; Shannon and Buckner 2004; Vann et al. 2009). Some subregions show greater activity for recollective retrieval compared with familiarity-based recognition (Donaldson and Buckner 1999).
Moreover, evidence indicates that MTL's functional connectivity with neocortical memory regions is reduced during sleep. In a comparison of evening wakefulness, stage 1 sleep, stage 2 sleep, and SWS, MTL functional connectivity with other default-mode network regions was reduced as subjects transitioned to deeper sleep stages (Andrade et al. 2011). In addition, a psychophysical interaction (PPI) analysis revealed that this functional connectivity was stronger during sleep spindles. Spindles are believed to represent an electrical signature of mechanisms involved in memory consolidation (Gais et al. 2002; Schabus et al. 2004). This sleep-related reduction in functional connectivity dovetails with results from the PET literature, which indicate that MTL blood flow increases during REM sleep (Braun et al. 1998; Maquet et al. 1996) and decreases during SWS (Andersson et al. 1998; Braun et al. 1998). These findings hint at a complex nocturnal process by which MTL functional connectivity transitions between its evening and morning states.
Although somewhat more challenging to interpret than the changes in resting-state functional connectivity between MTL and cerebral cortex, two other changes in the functional connectivity of MTL between morning and evening deserve comment. These include changes in the striatum bilaterally and the brain stem.
In the morning, the striatum was anticorrelated with the MTL bilaterally. In the evening, this relationship had changed to a positive correlation. Such a change would be consistent with the putative role of the striatum, and basal ganglia more generally, in the procedural aspects of learning (e.g., see Debas et al. 2010; Mattfeld and Stark 2011). That procedural as well as declarative aspects of memory and learning constitute the experiences of wake seems very likely.
In the brain stem, highlighted in the difference images (morning vs. evening; Fig. 4) there appeared a significant increase in functional connectivity between the MTL and the periaquaductal region of the pons that is clearly shown on both the horizontal and sagittal images. A noteworthy component of this region is the locus coeruleus, which is active during wakefulness and reduces its firing during sleep (Cirelli and Tononi 2004). It has been posited that its role during wakefulness is to modulate neuronal gene transcription in favor of synaptic potentiation and to counteract cellular stress (Cirelli and Tononi 2004). Although we are not able to confirm that the changes we observe are actually in the locus coeruleus given the resolution of our scanner (Astafiev et al. 2010), this observation has alerted us to the work of others (Cirelli and Tononi 2004), suggesting that the changes we observe in functional connectivity between MTL, the cerebral cortex, and the striatum between morning and evening may well be facilitated by activity within brain stem nuclei such as the locus coeruleus.
Our results, in combination with those of Andrade et al. (2011), give us a picture of a full day of MTL functional connectivity. MTL is primarily locally correlated in the morning but exhibits neocortical, striatal, and brain stem correlations in the evening. As sleep progresses, the functional connectivity returns to a morning-like pattern. One exciting, though speculative, possibility is that the evening MTL functional connectivity arises as subjects accumulate experiences and memories throughout the day and recedes as those memories are consolidated during sleep.
This finding contributes to a small but growing body of evidence indicating that functional connectivity relationships are not constant but vary over the course of minutes (Chang and Glover 2010) and hours (Park et al. 2012), even in the absence of experimental intervention. Whereas previous reports characterize mainly stochastic variability (i.e., variation that occurs without apparent relationship to other variables), the present report documents a systematic change between morning and evening. Interestingly, Park et al. (2012) anticipated our results to some extent, identifying a hippocampal network as showing “high dynamicity,” although they did not investigate morning-evening effects.
Both stochastic and systematic variability have practical consequences with regard to the study of functional connectivity. Investigators using functional connectivity as a clue to structural connectivity should be aware that their results may vary depending on the time of day a scan is performed. For example, functional connectivity between posterior parietal and medial temporal regions has been reported previously (Greicius et al. 2003; Vincent et al. 2006). If the scans for that study had been obtained exclusively in the morning, the data may have indicated a different conclusion.
Finally, sleep disturbances are a prominent feature of many disorders, including depression and Alzheimer's disease. If the circadian changes in MTL functional connectivity observed here are biomarkers of healthy sleep, they may be useful in furthering our understanding the neurobiological significance of the sleep disturbances in these diseases.
Metabolism.
Synaptic activity accounts for the largest fraction of the brain's enormous energy budget (for a review see Raichle and Mintun 2006). Because functional connectivity likely depends on synaptic efficacy and number, changes in functional connectivity and, hence, synaptic efficacy and/or number during wake of the type we found in experiment 1 might be expected to have an effect on brain metabolism. Somewhat surprisingly, we found no evidence for an increase in global or regional metabolism between morning and evening in a group of 10 healthy young adults in whom we documented normal sleep-wake cycles during the week preceding our study as well as the night between our measurements of brain circulation and metabolism. To put our findings into perspective, it is important to consider two things: first, the work of others, and second, the scope of metabolism, which includes not only the generation of energy but also biosynthesis. First, we turn to a brief summary of extant work on brain metabolism related to sleep and wake.
Beginning with the first quantitative study of brain circulation and metabolism prior to sleep in humans (Mangold et al. 1955),1 there have been a total of six additional studies in humans that we know of (Boyle et al. 1994; Braun et al. 1997; Buchsbaum et al. 1989; Madsen et al. 1991a, 1991b; Thomas et al. 2000), one in monkeys (Kennedy et al. 1982), one in cats (Reivich et al. 1968), and one in mice (Vyazovskiy et al. 2008). We will restrict our comments to the quantitative studies in humans because they are most relevant to our results.
Only one study has been performed in humans before and after a night's sleep. Braun et al. (1997) measured regional and global cerebral blood flow with PET before, during, and after sleep in a group of sleep-deprived but otherwise normal young adults. In these individuals blood flow was 54 ml·g−1·min−1 in the evening before sleep, a value significantly higher (17%) than that obtained the following morning. However, it should be noted that the value they obtained in the evening was within the range of normal values obtained in humans without regard to the time of day (e.g., see Kety and Schmidt 1948; Powers et al. 2007; Raichle et al. 1970). The authors suggested this difference could be due to increases in blood flow due to sleep deprivation or a decrease brought about by intervening “recovery sleep” (or both). Our data in well-rested subjects (49 ml·g−1·min−1) would suggest that sleep deprivation did not have a significant influence on the evening blood flow.
Three other studies in humans prior to sleep (Boyle et al. 1994; Madsen et al. 1991b, 1991c) support the above conclusion. As in the study by Braun et al. (1997), the subjects in the study by Boyle et al. had been sleep deprived at the time of the evening measurement, but sleep deprivation was not employed in the two studies by Madsen and colleagues. Boyle et al. observed a presleep blood flow of 50 ml·g−1·min−1. In the two studies by Madsen and colleagues in non-sleep-deprived subjects (1991b, 1991c), the presleep values were 58 and 57, respectively. Thus, combining these results with our own data, it would appear that sleep deprivation does not explain the blood flow difference observed in the experiment by Braun et al. (1997). Further work is needed to explain the low value of blood flow in the morning observed by these investigators.
Our measurements of oxygen consumption and glucose utilization, which show identical values for morning and evening, are within the range of evening values observed in those studies in which metabolism was measured before sleep (Boyle et al. 1994; Buchsbaum et al. 1989; Madsen et al. 1991b, 1991c; Mangold et al. 1955; Thomas et al. 2000).2 It is important to emphasize that ours is the only study in which metabolism was measured both before and after sleep and revealed no changes globally or locally as the result of wake.
Before dismissing the role of brain metabolism in the synaptic events of wake (clearly demonstrated in our experiment 1), it is important to consider a broader vision of the role of metabolism in brain function. Traditionally, it has been tacitly assumed by most that the consumption of glucose and oxygen represents the brain's need for energy without consideration of possible additional roles. However, we know that glucose consumption exceeds that needed for oxidative phosphorylation by about 15% in the resting adult human (Powers et al. 2007; Raichle et al. 1970). This has traditionally been referred to as aerobic glycolysis (i.e., glucose consumption occurring in excess of that needed for oxidative phosphorylation in the presence of adequate tissue oxygenation). Furthermore, aerobic glycolysis is nonuniformly distributed in the brain, being high in the brain's default-mode network and prefrontal control systems and reduced in the cerebellum and medial temporal lobes (Vaishnavi SN, Vlassenko AG, Shannon BJ, Larson-Prior L, Snyder AZ, unpublished observations). Finally, aerobic glycolysis represents a far larger share of glucose utilization in the developing human brain (Altman et al. 1993; Chugani et al. 1987; Powers et al. 1998), which is consistent with the important role of aerobic glycolysis in biosynthesis (Lunt and Vander Heiden 2011).
Importantly, aerobic glycolysis may be involved in synaptic events associated with memory and learning. In a remarkable study by Madsen et al. (1995), they were able to show that aerobic glycolysis persists for close to an hour following the performance of a difficult cognitive task without any evidence of an increase in oxygen consumption or blood flow. This observation, coupled with the metabolic measurements we report herein (i.e., no change in aerobic glycolysis either globally or regionally between morning and evening), suggests that some of the metabolic consequences of synaptic growth and strengthening may be time limited within the period of wake. Obviously, more work needs to be done that emphasizes a more comprehensive view of glucose metabolism. The idea of “local sleep” during wake (Vyazovskiy et al. 2011) should also be considered.
GRANTS
This work was supported by National Institutes of Health Grants NS 006833, NS 048056, and MH 077967 and a grant from the James S. McDonnell Foundation.
DISCLOSURES
No conflicts of interest, financial or otherwise, are declared by the authors.
AUTHOR CONTRIBUTIONS
B.J.S., R.A.D., A.Z.S., and M.E.R. conception and design of research; B.J.S., R.A.D., A.G.V., L.J.L.-P., and T.S.N. performed experiments; B.J.S., Y.S., L.J.L.-P., and T.S.N. analyzed data; B.J.S., A.Z.S., and M.E.R. interpreted results of experiments; B.J.S. prepared figures; B.J.S. drafted manuscript; B.J.S., A.Z.S., and M.E.R. edited and revised manuscript; B.J.S., R.A.D., Y.S., A.G.V., L.J.L.-P., A.Z.S., and M.E.R. approved final version of manuscript.
Supplementary Material
Footnotes
We use the term “quantitative” to mean the actual molar quantities of glucose and oxygen consumed and the milliliters of blood delivered to the brain in flowing blood per unit of time.
It is noteworthy that in the study by Thomas and colleagues, glucose consumption actually declined in those subjects subjected to prolonged sleep deprivation.
REFERENCES
- Altman DI, Perlman JM, Volpe JJ, Powers WJ. Cerebral oxygen metabolism in newborns. Pediatrics 92: 99–104, 1993 [PubMed] [Google Scholar]
- American Sleep Disorders Association Practice parameters for the use of actigraphy in the clinical assessment of sleep disorders. Sleep 18: 285–287, 1995 [DOI] [PubMed] [Google Scholar]
- Andersson JLR, Onoe H, Hetta J, Lidstrom K, Valind S, Lilja A, Sundin A, Fasth KJ, Westerberg G, Broman JE, Watanabe Y, Långström B. Brain networks affected by synchronized sleep visualized by positron emission tomography. J Cereb Blood Flow Metab 18: 701–715, 1998 [DOI] [PubMed] [Google Scholar]
- Andrade KC, Spoormaker VI, Dresler M, Wehrle R, Holsboer F, Sämann PG, Czisch M. Sleep spindles and hippocampal functional connectivity in human NREM sleep. J Neurosci 31: 10331–10339, 2011 [DOI] [PMC free article] [PubMed] [Google Scholar]
- Astafiev SV, Snyder AZ, Shulman GL, Corbetta M. Comment on “Modafinil shifts human locus coeruleus to low-tonic, high-phasic activity during functional MRI” and “Homeostatic sleep pressure and responses to sustained attention in the suprachiasmatic area”. Science 328: 309, 2010 [DOI] [PMC free article] [PubMed] [Google Scholar]
- Ball S, Fox PT, Pardo JV, Raichle ME. Control state stability for PET brain imaging: rest versus task. Neurology 38, Suppl 1: 362, 1988 [Google Scholar]
- Biswal B, Yetkin FZ, Haughton VM, Hyde JS. Functional connectivity in the motor cortex of resting human brain using echo-planar MRI. Magn Reson Med 34: 537–541, 1995 [DOI] [PubMed] [Google Scholar]
- Boyle PJ, Scott JC, Krentz AJ, Nagy RJ, Comstock E, Hoffman C. Diminished brain glucose metabolism is a significant determinant for falling rates of systemic glucose utilization during sleep in normal humans. J Clin Invest 93: 529–535, 1994 [DOI] [PMC free article] [PubMed] [Google Scholar]
- Braun AR, Balkin TJ, Wesenten NJ, Carson RE, Varga M, Baldwin P, Selbie S, Belenky G, Herscovitch P. Regional cerebral blood flow throughout the sleep-wake cycle. An H215O PET study. Brain 120: 1173–1197, 1997 [DOI] [PubMed] [Google Scholar]
- Braun AR, Balkin TJ, Wesensten NJ, Gwadry F, Carson RD, Varga M, Baldwin P, Belenky G, Herscovitch P. Dissociated pattern of activity in visual cortices and their projections during human rapid eye movement sleep. Science 279: 91–95, 1998 [DOI] [PubMed] [Google Scholar]
- Buchsbaum MS, Gillin JC, Wu J, Hazlett E, Sicotte N, Dupont RM, Bunney WE., Jr Regional cerebral glucose metabolic rate in human sleep assessed by positron emission tomography. Life Sci 45: 1349–1356, 1989 [DOI] [PubMed] [Google Scholar]
- Buysse DJ, Reynolds CF, 3rd, Monk TH, Berman SR, Kupfer DJ. The Pittsburgh Sleep Quality Index: a new instrument for psychiatric practice and research. Psychiatry Res 28: 193–213, 1989 [DOI] [PubMed] [Google Scholar]
- Chang C, Glover GH. Time-frequency dynamics of resting-state brain connectivity measured with fMRI. Neuroimage 50: 81–98, 2010 [DOI] [PMC free article] [PubMed] [Google Scholar]
- Chugani HT, Phelps ME, Mazziotta JC. Positron emission tomography study of human brain functional development. Ann Neurol 22: 487–497, 1987 [DOI] [PubMed] [Google Scholar]
- Cirelli C, Tononi G. Locus ceruleus control of state-dependent gene expression. J Neurosci 24: 5410–5419, 2004 [DOI] [PMC free article] [PubMed] [Google Scholar]
- Crane PD, Pardridge WM, Braun LD, Nyerges AM, Oldendorf WH. The interaction of transport and metabolism on brain glucose utilization: a re-evaluation of the lumped constant. J Neurochem 36: 1601–1604, 1981 [DOI] [PubMed] [Google Scholar]
- Debas K, Carrier J, Orban P, Barakat M, Lungu O, Vanderwalle G, Hadj Tahar A, Bellec P, Karni A, Ungerleider LG, Benali H, Doyon J. Brain plasticity related to the consolidation of motor sequence learning and motor adaptation. Proc Natl Acad Sci USA 107: 17839–27844, 2010 [DOI] [PMC free article] [PubMed] [Google Scholar]
- De Havas JA, Parimal S, Soon CS, Chee MW. Sleep deprivation reduces default mode network connectivity and anti-correlation during rest and task performance. Neuroimage 59: 1745–1751, 2011 [DOI] [PubMed] [Google Scholar]
- De Koninck J, Lorrain D, Christ G, Proulx G, Coulombe D. Intensive language learning and increases in rapid eye movement sleep: evidence of a performance factor. Int J Psychophysiol 8: 43–47, 1989 [DOI] [PubMed] [Google Scholar]
- Dillon RS. Importance of the hematocrit in interpretation of blood sugar. Diabetes 14: 672–674, 1965 [DOI] [PubMed] [Google Scholar]
- Dobbins IG, Rice HJ, Wagner AD, Schacter DL. Memory orientation and success: separable neurocognitive components underlying episodic recognition. Neuropsychologia 41: 318–333, 2003 [DOI] [PubMed] [Google Scholar]
- Donaldson DI, Buckner RL. Trying versus succeeding: event-related designs dissociate memory processes. Neuron 22: 412–414, 1999 [DOI] [PubMed] [Google Scholar]
- Dosenbach NU, Nardos B, Cohen AL, Fair DA, Power JD, Church JA, Nelson SM, Wig GS, Vogel AC, Lessov-Schlaggar CN, Barnes KA, Dubis JW, Feczko E, Coalson RS, Pruett JR, Jr, Barch DM, Petersen SE, Schlaggar BL. Prediction of individual brain maturity using fMRI. Science 329: 1358–1361, 2010 [DOI] [PMC free article] [PubMed] [Google Scholar]
- Foster DJ, Wilson MA. Reverse replay of behavioural sequences in hippocampal place cells during the awake state. Nature 440: 680–683, 2006 [DOI] [PubMed] [Google Scholar]
- Fox MD, Snyder AZ, Vincent JL, Corbetta M, Van Essen DC, Raichle ME. The human brain is intrinsically organized into dynamic, anticorrelated functional networks. Proc Natl Acad Sci USA 102: 9673–9678, 2005 [DOI] [PMC free article] [PubMed] [Google Scholar]
- Fox MD, Zhang D, Snyder AZ, Raichle ME. The global signal and observed anticorrelated resting state brain networks. J Neurophysiol 101: 3270–3283, 2009 [DOI] [PMC free article] [PubMed] [Google Scholar]
- Fransson P. How default is the default mode of brain function? Further evidence from intrinsic BOLD signal fluctuations. Neuropsychologia 44: 2836–2845, 2006 [DOI] [PubMed] [Google Scholar]
- Gais S, Mölle M, Helms K, Born J. Learning-dependent increases in sleep spindle density. J Neurosci 22: 6830–6834, 2002 [DOI] [PMC free article] [PubMed] [Google Scholar]
- Gilestro GF, Tononi G, Cirelli C. Widespread changes in synaptic markers as a function of sleep and wakefulness in Drosophila. Science 324: 109–112, 2009 [DOI] [PMC free article] [PubMed] [Google Scholar]
- Greicius MD, Krasnow B, Reiss AL, Menon V. Functional connectivity in the resting brain: a network analysis of the default mode hypothesis. Proc Natl Acad Sci USA 100: 253–258, 2003 [DOI] [PMC free article] [PubMed] [Google Scholar]
- Hasselbalch SG, Knudsen GM, Holm S, Hageman LP, Jakobsen J, Paulson OB. Unidirectional clearance of D-glucose and FDG across the human blood-brain barrier: a re-evaluation of the lumped constant. Ann Nucl Med 7: S116–S117, 1993 [Google Scholar]
- Hasselbalch SG, Madsen PL, Knudsen GM, Holm S, Paulson OB. Calculation of the FDG lumped constant by simultaneous measurements of global glucose and FDG metabolism in humans. J Cereb Blood Flow Metab 18: 154–160, 1998 [DOI] [PubMed] [Google Scholar]
- Hastie T, Tibshirani R, Friedman J. The Elements of Statistical Learning: Data Mining, Inference, and Prediction (2nd ed.). New York: Springer, 2009 [Google Scholar]
- Huber R, Ghilardi MF, Massimini M, Tononi G. Local sleep learning. Nature 430: 78–81, 2004 [DOI] [PubMed] [Google Scholar]
- Iida H, Jones T, Miura S. Modeling approach to eliminate the need to separate arterial plasma in oxygen-15 inhalation positron emission tomography. J Nucl Med 34: 1333–1340, 1993 [PubMed] [Google Scholar]
- Ito H, Takahashi K, Hatazawa J, Kim SG, Kanno I. Changes in human regional cerebral blood flow and cerebral blood volume during visual stimulation measured by positron emission tomography. J Cereb Blood Flow Metab 21: 608–612, 2001 [DOI] [PubMed] [Google Scholar]
- Johns MW. A new method for measuring daytime sleepiness: the Epworth sleepiness scale. Sleep 14: 540–545, 1991 [DOI] [PubMed] [Google Scholar]
- Karni A, Tanne D, Rubenstein BS, Askenasy JJ, Sagi D. Dependence on REM sleep of overnight improvement of a perceptual skill. Science 265: 679–682, 1994 [DOI] [PubMed] [Google Scholar]
- Kennedy C, Des Rosiers MH, Sakurada O, Shinohara M, Reivich M, Jehle JW, Sokoloff L. Metabolic mapping of the primary visual system of the monkey by means of the autoradiographic [14C]deoxyglucose technique. Proc Natl Acad Sci USA 73: 4230–4234, 1976 [DOI] [PMC free article] [PubMed] [Google Scholar]
- Kety SS, Schmidt CF. The nitrous oxide method for the quantitative determination of cerebral blood flow in man: theory, procedure, and normal values. J Clin Invest 27: 476–483, 1948 [DOI] [PMC free article] [PubMed] [Google Scholar]
- Kingshott RN, Douglas NJ. The effect of in-laboratory polysomnography on sleep and objective daytime sleepiness. Sleep 23: 1–5, 2000 [PubMed] [Google Scholar]
- Konishi S, Wheeler ME, Donaldson DI, Buckner RL. Neural correlates of episodic retrieval success. Neuroimage 12: 276–286, 2000 [DOI] [PubMed] [Google Scholar]
- Krishnan A, Williams LJ, McIntosh AR, Abdi H. Partial Least Squares (PLS) methods for neuroimaging: a tutorial and review. Neuroimage 56: 455–475, 2010 [DOI] [PubMed] [Google Scholar]
- Lee AK, Wilson MA. Memory of sequential experience in the hippocampus during slow wave sleep. Neuron 36: 1183–1194, 2002 [DOI] [PubMed] [Google Scholar]
- Lefevre PG, McGinnis GF. Tracer exchange vs. net uptake of glucose through human red cell surface. New evidence for carrier-mediated diffusion. J Gen Physiol 44: 87–103, 1960 [DOI] [PMC free article] [PubMed] [Google Scholar]
- Lewis CM, Baldassarre A, Committeri G, Romani GL, Corbetta M. Learning sculpts the spontaneous activity of the resting human brain. Proc Natl Acad Sci USA 106: 17558–17563, 2009 [DOI] [PMC free article] [PubMed] [Google Scholar]
- Lucignani G, Schmidt KC, Moresco R, Striano G, Colombo F, Sokoloff L, Fazio F. Measurement of regional cerebral glucose utilization with fluorine-18-FDG and PET in heterogeneous tissues: theoretical considerations and practical procedure. J Nucl Med 34: 360–369, 1993 [PubMed] [Google Scholar]
- Lundstrom BN, Ingvar M, Petersson KM. The role of precuneus and left inferior frontal cortex during source memory episodic retrieval. Neuroimage 27: 824–834, 2005 [DOI] [PubMed] [Google Scholar]
- Lunt SY, Vander Heiden MG. Aerobic glycolysis: meeting the metabolic requirements of cell proliferation. Annu Rev Cell Dev Biol 27: 441–464, 2011 [DOI] [PubMed] [Google Scholar]
- Madsen PL, Hasselbalch SG, Hagemann LP, Olsen KS, Bülow J, Holm S, Wildschiødtz G, Paulson OB, Lassen NA. Persistent resetting of the cerebral oxygen/glucose uptake ratio by brain activation: evidence obtained with the Kety-Schmidt technique. J Cereb Blood Flow Metab 15: 485–491, 1995 [DOI] [PubMed] [Google Scholar]
- Madsen PL, Holm S, Vorstrup S, Friberg L, Lassen NA, Wildschiødtz G. Human regional cerebral blood flow during rapid-eye-movement sleep. J Cereb Blood Flow Metab 11: 502–507, 1991a [DOI] [PubMed] [Google Scholar]
- Madsen PL, Schmidt JF, Holm S, Vorstrup S, Lassen NA, Wildschiødtz G. Cerebral oxygen metabolism and cerebral blood flow in man during light sleep (stage 2). Brain Res 557: 217–220, 1991b [DOI] [PubMed] [Google Scholar]
- Madsen PL, Schmidt JF, Wildschiødtz G, Friberg L, Holm S, Vorstrup S, Lassen NA. Cerebral O2 metabolism and cerebral blood flow in humans during deep and rapid-eye-movement sleep. J Appl Physiol 70: 2597–2601, 1991c [DOI] [PubMed] [Google Scholar]
- Mangold R, Sokoloff L, Conner E, Kleinerman J, Therman PO, Kety SS. The effects of sleep and lack of sleep on the cerebral circulation and metabolism of normal young men. J Clin Invest 34: 1092–1100, 1955 [DOI] [PMC free article] [PubMed] [Google Scholar]
- Marshall L, Born J. The contribution of sleep to hippocampus-dependent memory consolidation. Trends Cogn Sci 11: 442–450, 2007 [DOI] [PubMed] [Google Scholar]
- Maquet P, Peters J, Aerts J, Delfiore G, Degueldre C, Luxen A, Franck G. Functional neuroanatomy of human rapid-eye-movement sleep and dreaming. Nature 383: 163–166, 1996 [DOI] [PubMed] [Google Scholar]
- Martin WR, Powers WJ, Raichle ME. Cerebral blood volume measured with inhaled C15O and positron emission tomography. J Cereb Blood Flow Metab 7: 421–426, 1987 [DOI] [PubMed] [Google Scholar]
- Martuzzi R, Ramani R, Qiu M, Rajeevan N, Constable RT. Functional connectivity and alterations in baseline brain state in humans. Neuroimage 49: 823–834, 2010 [DOI] [PMC free article] [PubMed] [Google Scholar]
- Massimini M, Tononi G, Huber R. Slow waves, synaptic plasticity, and information processing: insights from transcranial magnetic stimulation and high-density EEG experiments. Eur J Neurosci 29: 1761–1770, 2009 [DOI] [PMC free article] [PubMed] [Google Scholar]
- Mattfeld AT, Stark CE. Striatal and medial temporal lobe functional interactions during visuomotor associative learning. Cereb Cortex 21: 647–658, 2011 [DOI] [PMC free article] [PubMed] [Google Scholar]
- Mazziotta JC, Toga AW, Evans A, Fox P, Lancaster J. A probabilistic atlas of the human brain: theory, and rationale for its development. The International Consortium for Brain Mapping (ICBM). Neuroimage 2: 89–101, 1995 [DOI] [PubMed] [Google Scholar]
- Mintun MA, Raichle ME, Martin WR, Herscovitch P. Brain oxygen utilization measured with O-15 radiotracers and positron emission tomography. J Nucl Med 25: 177–187, 1984 [PubMed] [Google Scholar]
- Murphy JR. Erythrocyte metabolism. I. The equilibration of glucose-C14 between serum and erythrocytes. J Lab Clin Med 55: 281–285, 1960 [PubMed] [Google Scholar]
- Nakai H, Yamamoto YL, Diksic M, Matsuda H, Takara E, Meyer E, Redies C. Time-dependent changes of lumped and rate constants in the deoxyglucose method in experimental cerebral ischemia. J Cereb Blood Flow Metab 7: 640–648, 1987 [DOI] [PubMed] [Google Scholar]
- Oldfield RC. The assessment and analysis of handedness: the Edinburgh inventory. Neuropsychologia 9: 97–113, 1971 [DOI] [PubMed] [Google Scholar]
- Park B, Kim JI, Lee D, Jeong SO, Lee JD, Park HJ. Are brain networks stable during a 24-hour period? Neuroimage 59: 456–466, 2012 [DOI] [PubMed] [Google Scholar]
- Patlak CS, Blasberg RG. Graphical evaluation of blood-to-brain transfer constants from multiple-time uptake data. Generalizations. J Cereb Blood Flow Metab 5: 584–590, 1985 [DOI] [PubMed] [Google Scholar]
- Patlak CS, Blasberg RG, Fenstermacher JD. Graphical evaluation of blood-to-brain transfer constants for multiple-time uptake data. J Cereb Blood Flow Metab 3: 1–7, 1983 [DOI] [PubMed] [Google Scholar]
- Powers WJ, Rosenbaum JL, Dence CS, Markham J, Videen TO. Cerebral glucose transport, and metabolism in preterm human infants. J Cereb Blood Flow Metab 18: 632–638, 1998 [DOI] [PubMed] [Google Scholar]
- Powers WJ, Videen TO, Markham J, McGee-Minnich L, Antenor-Dorsey JV, Hershey T, Perlmutter JS. Selective defect of in vivo glycolysis in early Huntington's disease striatum. Proc Natl Acad Sci USA 104: 2945–2949, 2007 [DOI] [PMC free article] [PubMed] [Google Scholar]
- Raichle ME. The restless brain. Brain Connect 1: 3–12, 2011 [DOI] [PMC free article] [PubMed] [Google Scholar]
- Raichle ME, MacLeod AM, Snyder AZ, Powers WJ, Gusnard DA, Schulman GL. A default mode of brain function. Proc Natl Acad Sci USA 98: 676–682, 2001 [DOI] [PMC free article] [PubMed] [Google Scholar]
- Raichle ME, Martin WR, Herscovitch P, Mintun MA, Markham J. Brain blood flow measured with intravenous H215O. II. Implementation and validation. J Nucl Med 24: 790–798, 1983 [PubMed] [Google Scholar]
- Raichle ME, Mintun MA. Brain work and brain imaging. Annu Rev Neurosci 29: 449–476, 2006 [DOI] [PubMed] [Google Scholar]
- Raichle ME, Posner JB, Plum F. Cerebral blood flow during and after hyperventilation. Arch Neurol 23: 394–403, 1970 [DOI] [PubMed] [Google Scholar]
- Reivich M, Alavi A, Wolf A, Fowler J, Russell J, Arnett C, MacGregor RR, Shiue CY, Atkins H, Anand A, Dann R, Greenberg JH. Glucose metabolic rate kinetic model parameter determination in humans: the lumped constants and rate constants for [18F] fluorodeoxyglucose and [11C] deoxyglucose. J Cereb Blood Flow Metab 5: 179–192, 1985 [DOI] [PubMed] [Google Scholar]
- Reivich M, Isaacs G, Evarts E, Kety S. The effect of slow wave sleep and REM sleep on regional cerebral blood flow in cats. J Neurochem 15: 301–306, 1968 [DOI] [PubMed] [Google Scholar]
- Robertson EM, Pascual-Leone A, Press DZ. Awareness modifies the skill-learning benefits of sleep. Curr Biol 14: 208–212, 2004 [DOI] [PubMed] [Google Scholar]
- Sämann PG, Tully C, Spoormaker VI, Wetter TC, Holsboer F, Wehrle R, Czisch M. Increased sleep pressure reduces resting state functional connectivity. MAGMA 23: 375–389, 2010 [DOI] [PubMed] [Google Scholar]
- Schabus M, Gruber G, Parapatics S, Sauter C, Klösch G, Anderer P, Klimesch W, Saletu B, Zeitlhofer J. Sleep spindles and their significance for declarative memory consolidation. Sleep 27: 1479–1485, 2004 [DOI] [PubMed] [Google Scholar]
- Shannon BJ, Buckner RL. Functional-anatomic correlates of memory retrieval that suggest nontraditional processing roles for multiple distinct regions within posterior parietal cortex. J Neurosci 24: 10084–10092, 2004 [DOI] [PMC free article] [PubMed] [Google Scholar]
- Shannon BJ, Raichle ME, Snyder AZ, Fair DA, Mills KL, Zhang D, Bache K, Calhoun VD, Nigg JT, Nagel BJ, Stevens AA, Kiehl KA. Premotor functional connectivity predicts impulsivity in juvenile offenders. Proc Natl Acad Sci USA 108: 11241–11245, 2011 [DOI] [PMC free article] [PubMed] [Google Scholar]
- Skaggs WE, McNaughton BL. Replay of neuronal firing sequences in rat hippocampus during sleep following spatial experience. Science 271: 1870–1873, 1996 [DOI] [PubMed] [Google Scholar]
- Spence AM, Muzi M, Graham MM, O'Sullivan F, Krohn KA, Link JM, Lewellen TK, Lewellen B, Freeman SD, Berger MS, Ojemann GA. Glucose metabolism in human malignant gliomas measured quantitatively with PET, 1-[C-11] glucose and FDG: analysis of the FDG lumped constant. J Nucl Med 39: 440–448, 1998 [PubMed] [Google Scholar]
- Squire LR, Alvarez P. Retrograde amnesia and memory consolidation: a neurobiological perspective. Curr Opin Neurobiol 5: 169–177, 1995 [DOI] [PubMed] [Google Scholar]
- Squire LR, Stark CE, Clark RE. The medial temporal lobe. Annu Rev Neurosci 27: 279–306, 2004 [DOI] [PubMed] [Google Scholar]
- Su Y, Shoghi KI. Single-input-dual-output modeling of image-based input function estimation. Mol Imaging Biol 12: 286–294, 2010 [DOI] [PMC free article] [PubMed] [Google Scholar]
- Su Y, Arbelaez AM, Benzinger TLS, Snyder AZ, Vlassenko AG, Mintun MA, Raichle ME. Noninvasive estimation of the arterial input function in PET imaging of cerebral blood flow. J Cereb Blood Flow Metab. In press [DOI] [PMC free article] [PubMed] [Google Scholar]
- Supekar K, Menon V, Rubin D, Musen M, Greicius MD. Network analysis of intrinsic functional brain connectivity in Alzheimer's disease. PLoS Comput Biol 4: e1000100, 2008 [DOI] [PMC free article] [PubMed] [Google Scholar]
- Thomas M, Sing H, Belenky G, Holcomb H, Mayberg H, Dannals R, Wagner H, Thorne D, Popp K, Rowland L, Welsh A, Balwinski S, Redmond D. Neural basis of alertness and cognitive performance impairments during sleepiness. I. Effects of 24 h of sleep deprivation on waking human regional brain activity. J Sleep Res 9: 335–352, 2000 [DOI] [PubMed] [Google Scholar]
- Thomas M, Sing H, Belenky G, Holcomb H, Mayberg H, et al. Neural basis of alertness and cognitive performance impairments during sleepiness. II. Effects of 48 and 72 h of sleep deprivation on waking human regional brain activity. Thalamus Relat Syst 2: 199–229, 2003 [DOI] [PubMed] [Google Scholar]
- Tononi G, Cirelli C. Sleep and synaptic homeostasis: a hypothesis. Brain Res Bull 62: 143–150, 2003 [DOI] [PubMed] [Google Scholar]
- Vaishnavi SN, Vlassenko AG, Rundle MM, Snyder AZ, Mintun MA, Raichle ME. Regional aerobic glycolysis in the human brain. Proc Natl Acad Sci USA 107: 17757–17762, 2010 [DOI] [PMC free article] [PubMed] [Google Scholar]
- Vann SD, Aggleton JP, Maguire EA. What does the retrosplenial cortex do? Nat Rev Neurosci 10: 792–802, 2009 [DOI] [PubMed] [Google Scholar]
- Videen TO, Perlmutter JS, Herscovitch P, Raichle ME. Brain blood volume, flow, and oxygen utilization measured with 15O radiotracers and positron emission tomography: revised metabolic computations. J Cereb Blood Flow Metab 7: 513–516, 1987 [DOI] [PubMed] [Google Scholar]
- Vincent JL, Snyder AZ, Fox MD, Shannon BJ, Andrews JR, Raichle ME, Buckner RL. Coherent spontaneous activity identifies a hippocampal-parietal memory network. J Neurophysiol 96: 3517–3531, 2006 [DOI] [PubMed] [Google Scholar]
- Vyazovskiy VV, Cirelli C, Tononi G, Tobler I. Cortical metabolic rates as measured by 2-deoxyglucose-uptake are increased after waking and decreased after sleep in mice. Brain Res Bull 75: 591–597, 2008 [DOI] [PMC free article] [PubMed] [Google Scholar]
- Vyazovskiy VV, Olcese U, Hanlon EC, Nir Y, Cirelli C, Tononi G. Local sleep in awake rats. Nature 472: 443–447, 2011 [DOI] [PMC free article] [PubMed] [Google Scholar]
- Wagner AD, Shannon BJ, Kahn I, Buckner RL. Parietal lobe contributions to episodic memory retrieval. Trends Cogn Sci 9: 445–453, 2005 [DOI] [PubMed] [Google Scholar]
- Walker MP, Stickgold R. Sleep-dependent learning and memory consolidation. Neuron 44: 121–133, 2004 [DOI] [PubMed] [Google Scholar]
- Yang H, Liu J, Sui J, Pearlson G, Calhoun VD. A hybrid machine learning method for fusing fMRI and genetic data to classify schizophrenia. Front Hum Neurosci 25: 1–9, 2010 [DOI] [PMC free article] [PubMed] [Google Scholar]
- Zhang D, Raichle ME. Disease and the brain's dark energy. Nat Rev Neurol 6: 15–28, 2010 [DOI] [PubMed] [Google Scholar]
Associated Data
This section collects any data citations, data availability statements, or supplementary materials included in this article.