Abstract
Reliable identification of cis regulatory elements influencing transcription remains a challenging problem in molecular bioinformatics. This is especially true for enhancer elements which are often located hundreds of kilobases from the gene promoter. High resolution DNase hypersensitivity and connectivity profiling by the ENCODE consortium provides evidence of millions of interacting cis-acting elements in the human genome. This prior knowledge can be incorporated into genome-wide expression analyses, in the form of gene sets sharing regulatory sequence motifs in known DNase hypersensitivity peak regions. High proportions of enrichment among the most extreme differentially transcribed genes from controlled biological experiments may suggest novel hypotheses about signalling pathways. The utility of this approach is demonstrated with the reanalysis of a microarray-derived gene expression data set through the Gene Set Enrichment Analysis pipeline, uncovering new putative distal cis elements in the context of innate immunity. The DNase Hypersensitivity Connectivity informed Motif Enrichment in Gene Expression (DHC-MEGE) method described here has the advantage of identifying distal elements such as enhancers, which are often overlooked with standard promoter motif analysis.
Availability
The DHC-MEGE shell script can be obtained from Sourceforge https://sourceforge.net/projects/dhcmege/ and the generated GMT file is attached as supplementary data.
Keywords: DNAse hypersensitivity, motif enrichment, gene expression, enhancer, gene set enrichment analysis
Background
DNase hypersensitivity (DH) profiling enables the discovery of genomic regions where DNA is exposed to action by DNase [1]. Exposed DNA may presumably be accessed by other molecules, and so may be more likely to have functional cis regulatory elements. The ENCODE consortium have released genomewide DH profiles from a wide range of human cell lines, cataloging an estimated 2.9 million DH regions, providing a new reference resource for genomic bioinformatic studies [2]. Moreover, these DH maps have revealed significant connectivity of promoter and enhancer elements, with these interactions taking place over large distances (median distance=214 kbp) [2]. Motif Enrichment in the analysis of Gene Expression (MEGE) allows for the discovery of motifs, which are over-represented, in up- and down-regulated genes. These motifs can serve as a proxy for DNA-binding transcription factors (TFs) and other sequence-specific elements that regulate gene expression. Restricting MEGE to the immediate vicinity of known transcriptional start sites (TSS) ignores cis regulatory elements outside of the promoter, while other approaches using sequence conservation overlook cis elements which may be unique to a species [3, 4]. The MEGE method described here limits motif discovery to DH regions and takes advantage of the DH connectivity map provided by ENCODE, enabling the identification of long-range distal cis elements which potentially drive changes in expression [5]. Genes that share an exposed motif are collected into individual gene sets and can be appended to existing motif gene collections [6] and tested using conventional Gene Set Enrichment Analysis [7].
Methodology
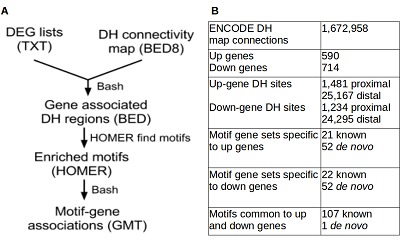
A schematic workflow of the DHC-MEGE program is shown in (Figure 1A). The DHC-MEGE program utilizes lists of up- and down-regulated gene symbols for motif analysis. It also requires a DH connectivity map in BED8 format, which describes the interaction between a promoter and distal elements together with the connection correlation coefficient. The human ENCODE DH connectivity map is accessible from EBI [5]. The program extracts the DH regions associated to the ‘up’ and ‘down’ gene expression sets. These BED regions are then searched for significantly enriched 8-20 nt sequence motifs with the Hypergeometric Optimization of Motif EnRichment program (HOMER) compared to the background genome sequence. HOMER initially utilises a library of known motifs, then performs de novo enrichment analysis for further enriched motifs and outputs these as a position weight matrix (PWM). Instances of these motifs are then counted in DH regions genome-wide, scored and sorted based upon their degree of sequence similarity to the HOMER PWM [8].
Figure 1.

(A) Schematic diagram of DHC-MEGE methodology of generating custom motif-gene association sets with the file format shown in brackets; (B) Statistics from an example analysis using a publicly-available microarray expression data set with a correlation threshold of 0.8, minimum sequence similarity score of 10 and maximum gene size of 1000.
Users are able to fine-tune the analysis by setting a DH site correlation threshold, gene set size as well as motif sequence similarity thresholds. Paths to input files and parameter settings are provided in a properly formatted configuration file. The output from DHC-MEGE is a list of gene sets in the GMT format. Because initial motif searching is restricted to sets of differentially expressed genes, the motifs identified will be unique for each experiment. Gene lists generated in the GMT format are accepted by the freely available Gene Set Enrichment Analysis (GSEA) software [7].
Utility to the biological community
Gene sets provide a convenient way to systematically summarise complex empirical biological information such as GSEA analysis modules for genome-wide profiling experiments. Motifs identified as significant from GSEA could represent the activation or repression of DNA binding factors that drive gene expression changes. The most significant advantage of this approach over current methods is the ability to identify long-range distal cis elements, which can only be achieved by incorporating chromatin connectivity maps. To demonstrate the utility DHC-MEGE, we have re-analysed a microarray expression data set investigating the effect of 2 hr lipopolysaccharide (LPS) treatment on the THP-1 immortal monocyte cell line (GEO: GSE32141) [9]. The publically available dataset was examined for differential expression with GEO2R. There were 590 up-regulated and 714 down-regulated array probes assigned to genes (nominal p≤0.01). We used the ENCODE human DH connectivity map with a correlation threshold of 0.8, a sequence similarity threshold of 10 and a maximum gene size set of 1000.
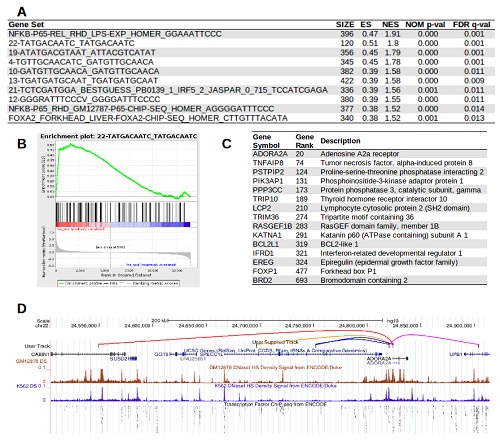
After motif identification and genome-wide screening, there were 105 de novo motif gene sets and 150 known motif gene sets (Figure 1B). Probes with a signal above the detection threshold and annotated with a valid RefSeq gene identifier were submitted to GSEA with the newly generated GMT files. GSEA identified 20 motifs to be enriched in the up-regulated genes (FDR adj p-value≤0.05), including known NF-κB motifs, but there were also several high-ranking de novo motifs such as TATGACAATC (Figure 2). The ADORA2A gene is the most highly upregulated gene associated to the TATGACAATC motif, with the motif occurring in a DH region 274 kbp upstream of the ADORA2A promoter DH site within a CABIN1 intron. This distal DH site (chr22:24549440-24549590) is bound by FOXA1 and USF-1 transcription factors, while USF-1 is also found at the ADORA2A promoter according to ChIP-seq profiling, suggesting that USF-1 might be an adapter protein in a chromatin loop [10]. The ADORA2A example also highlights the combinatorial contribution of distal elements, with the two ADORA2A promoters associated with regions containing FOXA2, GATA-IR3 and CTTACGTAAGTT elements that are significantly associated with up-regulated genes (FDR-adjusted p-values of 0.013, 0.22 and 0.047 respectively). This example highlights the biological complexity of long-range chromatin interactions that are overlooked by current promoter motif analysis tools.
Figure 2.

Example GSEA using DHC motif gene sets for gene expression analysis. The LPS-stimulated THP-1 cell microarray data is publically available [10]. (A) The top 10 ranked motif gene sets in up-regulated genes contains known and novel motifs (ranked by FDR-adj p-value). Abbreviations; SIZE, number of genes in the set detected in the experiment; ES, enrichment score; NES, normalised enrichment score; NOM p-val, nominal p-value; (B) Enrichment plot of the newly identified TATGACAATC motif gene set, showing the majority of genes associated with this motif are highly up-regulated; (C) List of the top 10 up-regulated genes associated with the TATGACAATC motif; (D) Example of long-range cis elements interacting with the ADORA2A promoter. The TATGACAATC motif is positioned in a distal DH peak 274 kbp upstream of the ADORA2A promoter DH peak (red line) in a CABIN1 intron. ADORA2A is also associated with GATA-IR3 (orange), CTTACGTAAGTT (blue), FOXA1 (pink) motifs that were significant in GSEA analysis (FDR<0.05).
Conclusion
The contribution of long-range chromatin interactions to the control of gene expression remains poorly understood, but this will improve as higher-resolution maps from chromatin conformation profiling experiments are integrated. Tools such as DHC-MEGE may also assist researchers understand the complex interplay between gene expression and epigenetic marks such as DNA methylation in disease.
Acknowledgments
The authors acknowledge support from the Juvenile Diabetes Research Foundation International (JDRF), the National Health and Medical Research Council (NHMRC), and the National Heart Foundation of Australia (NHF). AE-O is a Senior Research Fellow supported by the NHMRC. Supported in part by the Victorian Government's Operational Infrastructure Support Program.
Footnotes
Citation:Ziemann et al, Bioinformation 9(4): 212-215 (2013)
References
- 1.Crawford CE, et al. Genome Res. 2006;16:123. doi: 10.1101/gr.4074106. [DOI] [PMC free article] [PubMed] [Google Scholar]
- 2.Thurman RE, et al. Nature. 2012;489:75. doi: 10.1038/nature11232. [DOI] [PMC free article] [PubMed] [Google Scholar]
- 3.Xi H, et al. Genome Res. 2007;17:798. doi: 10.1101/gr.5754707. [DOI] [PMC free article] [PubMed] [Google Scholar]
- 4.Xie X, et al. Nature. 2005;434:338. doi: 10.1038/nature03441. [DOI] [PMC free article] [PubMed] [Google Scholar]
- 5. ftp://ftp.ebi.ac.uk/pub/
- 6. http://www.broadinstitute.org/gsea/msigdb/collections.jsp.
- 7.Subramanian A, et al. Proc Natl Acad Sci U S A. 2005;102:15545. doi: 10.1073/pnas.0506580102. [DOI] [PMC free article] [PubMed] [Google Scholar]
- 8.Heinz S, et al. Mol Cell. 2010;38:576. doi: 10.1016/j.molcel.2010.05.004. [DOI] [PMC free article] [PubMed] [Google Scholar]
- 9.Iglesias MJ, et al. PLoS One. 2012;7:e32306. doi: 10.1371/journal.pone.0032306. [DOI] [PMC free article] [PubMed] [Google Scholar]
- 10.ENCODE Project Consortium. Nature. 2012;489:57. [Google Scholar]


