

Abstract
Auditory-vocal interaction, the modulation of auditory sensory responses during vocal production, is an important but poorly understood neurophysiological phenomenon in nonhuman primates. This sensory-motor processing has important behavioral implications for self-monitoring during vocal production as well as feedback-mediated vocal control for both animals and humans. Previous studies in marmosets have shown that a large portion of neurons in the auditory cortex are suppressed during self-produced vocalization but have primarily focused on a single type of isolation vocalization. The present study expands previous analyses to compare auditory-vocal interaction of cortical responses between different types of vocalizations. We recorded neurons from the auditory cortex of unrestrained marmoset monkeys with implanted electrode arrays and showed that auditory-vocal interactions generalize across vocalization types. We found the following: 1) Vocal suppression and excitation are a general phenomenon, occurring for all four major vocalization types. 2) Within individual neurons, suppression was the more general response, occurring for multiple vocalization types, while excitation tended to be more specific to a single vocalization type. 3) A subset of neurons changed their responses between different types of vocalization, most often from strong suppression or excitation for one vocalization to unresponsive for another, and only rarely from suppression to excitation. 4) Differences in neural responses between vocalization types were weakly correlated with passive response properties, measured by playbacks of acoustic stimuli including recorded vocalizations. These results indicate that vocalization-induced modulation of the auditory cortex is a general phenomenon applicable to all vocalization types, but variations within individual neurons suggest possible vocalization-specific coding.
Keywords: auditory-vocal interaction, sensorimotor behavior, nonhuman primate, auditory cortex, vocalization
humans exhibit sophisticated neural mechanisms that continuously monitor our vocal output during speech. During both human speech and animal vocalization, self-produced vocal sounds propagate to the ears of intended listeners as well as to the ear of the speaker (Békèsy 1949). Continuous self-monitoring of this vocal feedback allows the detection and compensation of perceived vocal production errors (Burnett et al. 1998; Houde and Jordan 1998; Lane and Tranel 1971; Lee 1950; Levelt 1983; Lombard 1911). Similar feedback control has been seen in many animal species (Brumm et al. 2004; Leonardo and Konishi 1999; Schuller et al. 1974; Sinnott et al. 1975). Despite a long history of behavioral studies, the neural mechanisms of auditory self-monitoring during vocalization in the mammalian brain remain poorly understood.
Several studies of auditory-vocal interaction in humans have shown that activity in the auditory cortex is reduced during speech compared with passive listening. This attenuation has been demonstrated cortically with a variety of techniques, including MEG (Curio et al. 2000; Gunji et al. 2001; Heinks-Moldonado et al. 2006; Houde et al. 2002; Numminen and Curio 1999; Numminen et al. 1999), PET (Paus et al. 1996; Wise et al. 1999), EEG (Ford et al. 2001; Ford and Mathalon 2004; Heinks-Moldonado et al. 2005), fMRI (Christoffels et al. 2007; Fu et al. 2006; Hashimoto and Sakai 2003), and subdural electrocorticography (Crone et al. 2001; Flinker et al. 2010; Greenlee et al. 2011), but is largely absent from auditory-brain stem recordings (Houde et al. 2002). Limited intraoperative recording of cortical multiunits has also shown a mix of excitatory and inhibitory events in the human superior and middle temporal gyri (Creutzfeldt et al. 1989).
Previous recordings in nonhuman primates have shown that a majority of auditory cortex single neurons exhibit vocalization-induced suppression of neural firing, including both spontaneous and sound-evoked activity, during vocal production (Eliades and Wang 2003, 2005, 2008a; Müller-Preuss and Ploog 1981). This suppression, which begins several hundred milliseconds prior to the onset of vocalization (Eliades and Wang 2003), is thought to be inhibition originating from brain regions that initiate and control vocal production. Suppression of auditory cortical neural activity during vocal production contrasts sharply with more typical excitatory responses of cortical neurons in response to playback of recorded vocalizations. In addition to neurons showing vocal suppression, a smaller population of auditory cortical neurons exhibit vocalization-related excitation during vocal production. These vocalization-related modulations are not static but depend upon the acoustics of the vocalizations produced (Eliades and Wang 2005) as well as auditory feedback during vocalization (Eliades and Wang 2008a). This is particularly evident for suppressed neurons that exhibit sensitivity to vocal feedback alterations introduced by frequency shifts (Eliades and Wang 2008a) or during masking noise (Eliades and Wang 2012).
A major limitation of previous auditory-vocal studies in marmoset monkeys is that they primarily focused on a single type of vocalization despite the fact that marmosets produce a number of call types in captivity (Epple 1968; Pistorio et al. 2006). This is in contrast to sensory coding studies in nonhuman primates, where multiple vocalization exemplars and types are often compared (DiMattina and Wang 2006; Newman and Wolberg 1973; Rauschecker et al. 1995; Symmes 1981). Such a limitation has been a result of the difficulty in simultaneously recording both neural activity and vocal production, particularly for nonhuman primates, where vocalization is outside investigator control and severely attenuated by laboratory experimental conditions.
In our earlier studies of vocal modulations in auditory cortex, experiments were conducted in head-restrained animals housed in soundproof chambers with single-electrode recording techniques (e.g., Eliades and Wang 2003, 2005). Under such experimental conditions marmosets typically vocalized only one call type (an isolation call, “phee”). The present study reconfirms our earlier observations with chronically implanted multielectrode arrays in unrestrained marmosets in a behaviorally relevant environment of a large marmoset colony (Eliades and Wang 2008a, 2008b). Under this experimental condition, marmosets vocalize a wider range of call types. We further expand our earlier results by comparing auditory-vocal interactions between different classes of marmoset vocalizations, which was not possible in earlier studies with head-restrained animals. Finally, we examine the properties of auditory cortical neurons during self-produced vocalizations and attempt to explain similarities and differences in responses between different types of vocalizations. The results reported in the present study provide further support to the conclusion that auditory-vocal interaction in primate auditory cortex is a general phenomenon across vocalization types.
METHODS
Electrophysiological recordings.
Two marmoset monkeys (Callithrix jacchus) were each implanted bilaterally with multielectrode arrays (Warp-16, Neuralynx, Bozeman, MT), each of which contained 16 individually movable metal microelectrodes (impedances 2–4 MΩ). Full details of the electrode array design, characteristics, and recording, as well as the spike sorting procedure, have been published previously (Eliades and Wang 2008b). The auditory cortex was located with standard single-electrode techniques (Lu et al. 2001) prior to array placement. The left hemisphere was implanted first, followed a few weeks to months later by an implant in the right hemisphere, after which both arrays were recorded simultaneously. Postmortem histological examination showed all four arrays to span both primary auditory cortex as well as lateral and parabelt fields (Eliades and Wang 2008b).
Electrode signals were observed online to guide electrode movement and optimize neural signal quality. Typically, two electrode channels were monitored with online spike sorting (MSD, Alpha-Omega Engineering, Nazareth, Israel) during each experimental session in order to guide auditory stimulus selection. Digitized action potentials were sorted off-line with custom software and principal component-based clustering methods. Recorded neural units were later classified as either single unit or multiunit based on a cluster separability d′ ≥ 2, an action potential SNR ≥ 13 dB, and presence of a clear refractory period in the autocorrelogram. Multiunits were typically secondary signals recorded along with a single unit. A total of 2,705 units were recorded during these experiments, of which 1,603 were later classified as single units, and only these were included in the experimental results.
Vocal recordings and behavioral conditions.
Vocalizations were recorded with a directional microphone (AKG C1000S) placed ∼20 cm in front of the animals and then amplified (Symetrix SX202) and low-pass filtered to prevent aliasing (Frequency Devices, 24 kHz, 8-pole Butterworth). Vocal signals were digitized at a 50-kHz sampling rate (National Instruments PCI-6052E) and synchronized with neural recordings. Vocalizations were later extracted from the digitized microphone signals and manually classified into established marmoset call types (DiMattina and Wang 2006; Pistorio et al. 2006) on the basis of visual inspection of their spectrograms.
Simultaneous neural and vocal recordings were performed in either of two experimental conditions. Most experiments were conducted in the marmoset colony in order to increase the willingness of an animal to vocalize. The subject animal was placed within a portable three-walled sound attenuation booth for clearer vocal recordings but was still able to interact both visually and vocally with the rest of the animals (∼60) in the colony. The combination of a directional microphone and a sound attenuation booth significantly improved the quality of vocal recordings and reduced interference from overlapping colony sounds. A smaller number of sessions were antiphonal calling experiments (Miller and Wang 2006), where an animal vocalized interactively with a computer-controlled playback of recorded vocalizations from a conspecific animal. Antiphonal experiments were conducted with the animal in a laboratory soundproof chamber, but with the door ajar and a speaker located out of the animal's sight.
Vocal experiments were performed with the animal either seated in a primate chair or free roaming. Seated recordings, performed during earlier experiments, involved keeping the subject in the custom primate chair but releasing its head (“head free”) to reduce the amount of restraint and to increase its vocalization. Free-roaming experiments involved the use of a small cage within which the animal was allowed to move freely without restraint. Tether wires connected the electrode arrays to hardware located outside the cage. Full details of the free-roaming recording method used have been published previously (Eliades and Wang 2008b). Using the implanted electrode arrays and free-roaming methods, we were able to stably record units throughout a multihour experimental session. All experiments were conducted under guidelines and protocols approved by the Johns Hopkins University Animal Care and Use Committee.
Under these conditions the animals made a variety of vocalization types, including the four major marmoset call types (DiMattina and Wang 2006; Pistorio et al. 2006): phees, trillphees, trills, and twitters (Fig. 1). A few less common call types were also observed but not analyzed. Phees (Fig. 1A) are the loudest and longest marmoset vocalization, most commonly produced in situations of isolation or distant vocal communication. Trillphees (Fig. 1B) serve a behavioral role similar to that of phees and are acoustically similar except for a short period of sinusoidal frequency modulation at the start of the call. Trills (Fig. 1C) are generally softer and shorter sinusoidally modulated vocalizations made in more socially interactive contexts. Twitters (Fig. 1D) consist of multiple phrases of linear frequency modulation and are also produced in social contexts.
Fig. 1.

Examples of the 4 major marmoset vocalizations. Frequency-time spectrograms are shown for representative samples of the 4 major types of marmoset vocalization: phees (A), trillphees (B), trills (C), and twitters (D).
Auditory response characterization.
Prior to each vocal recording session, experiments began with presentation of acoustic stimuli to characterize the auditory tuning of units. Animals were seated in a custom primate chair, with their head restrained, within a soundproof chamber (Industrial Acoustics, Bronx, NY). Acoustic stimuli were delivered free-field through a speaker (B&W DM601) located 1 m in front of the animal. Auditory stimuli included both tone- and noise-based sounds to assess frequency tuning and rate-level responses. Tone stimuli consisted of randomly ordered 100-ms pips, separated by 500 ms, with frequencies generally spanning 1–32 kHz spaced at 10 tones/octave and SPLs spanning −10 to 80 dB in 10- to 20-dB intervals. Band-pass noise stimuli were presented similarly to tones but had 0.5-octave bandwidth and 5 stimuli/octave frequency spacing. Animals were also presented with multiple recorded vocalizations (“playback”) at different sound levels, including samples of an animal's own vocalizations (previously recorded from that animal) and conspecific vocalization samples (from other animals in the marmoset colony).
Data analysis.
Neural responses to individual vocalizations were calculated by comparing the firing rate before and during vocalizations. The response to each vocalization was quantified with a normalized rate metric, the vocal response modulation index (RMI), defined as
where Rvocal is the firing rate during vocalization and Rprevocal is the average rate before vocalization. An RMI of −1 indicated complete suppression of neural activity, and +1 indicated strongly driven vocalization responses, a low prevocal firing rate, or both. Prevocal activity was determined by randomly sampling the 4-s prevocal period with 1,000 vocalization-length windows and discarding the half with the greatest acoustic energy in the microphone signal (to minimize the effects of outside sounds). Vocalization responses that failed to elicit at least three spikes before or during the vocal period were excluded from analysis. The overall response of a neuron to a given vocalization call type was assessed by averaging the RMI from multiple vocalization responses, calculated individually for each such call type. Those units with sufficient vocal samples of a given call type (≥4) were tested statistically to determine the reliability of the observed responses (Wilcoxon signed-rank test, P < 0.01). Responses to vocal playback were similarly quantified.
To determine the timing and temporal patterns of vocalization-related neural activity, peristimulus time histograms (PSTHs) were calculated for individual call types, both at the level of individual units and for the entire sampled neural population. All PSTHs were derived from vocalization onset-aligned neural activity. Single-unit PSTHs were calculated with 25-ms bins and smoothed with a 4-sample moving average for display purposes. Population PSTHs were calculated individually for each unit with either suppressed (RMI ≤ −0.2) or excited (RMI ≥ 0.2) vocalization responses with 10-ms bins and then averaged across units. Vocal responses were required to be stationary (i.e., pre- and postvocal firing rates not significantly different) for inclusion in this calculation. The interval over which vocalization-related changes in neural activity were significant was determined from these population histograms by calculating a z score for each time point relative to a 2,000-ms window of prevocal activity. z Score values ≥3 SD were considered to be statistically significant modulations.
Comparisons between different vocalization call types for individual neurons were performed by calculating differences in RMI distributions in both a pairwise (2 call types) and a global (all call types) fashion. A minimum of four vocalization samples for a given call type was required for comparison. Statistical significance of call type differences was determined with Wilcoxon rank sum tests for neurons with only two call types and Kruskal-Wallis nonparametric ANOVAs with Bonferroni corrections for more than two call types. P values < 0.05 were considered statistically significant when comparing different call types. In some analyses, a d′-based measure (Green and Swets 1966) was used to quantify the significance of call type differences, defined as
where RA and RB are the mean vocal firing rates for vocalizations A and B and σ2 is the variance of each rate. When units were sampled with more than two call types, d′ measures were calculated individually for each call type pairing and then averaged. Two-dimensional population distributions were also used to summarize pairwise call type comparisons. These distributions were smoothed, for display purposes only, with a two-dimensional bicubic interpolation. Correlations between different parameters were calculated with Spearman nonparametric correlation coefficients.
Responses to passively presented auditory stimuli were separately analyzed and later compared to vocal call type differences. Frequency and rate-level tuning parameters were measured from tone responses (Lu et al. 2001; Wang et al. 2005). Tuning parameters for units not responding to tones were measured from band-pass or wideband noise responses. Unit center frequency (CF) was measured from the peak of the tuning curve measured close to threshold. Bandwidth (BW) was the width of the tuning curve peak, in octaves, measured at 50% of the peak firing rate. The peak SPL was calculated from rate-level curves measured near CF. The monotonicity index (Sadagopan and Wang 2008) was calculated as the ratio between the maximum firing rate and the firing rate at maximal SPL. Playback of recorded vocalizations was analyzed by RMI similarly to produced vocalizations.
RESULTS
Using chronically implanted electrode arrays (Eliades and Wang 2008b), we recorded 1,603 single units from the auditory cortices of two marmoset monkeys while the animals produced a large number of different vocalization call types. In our previous work (Eliades and Wang 2003, 2005), auditory cortex activities during vocalization were recorded while animals were restrained in a primate chair in a soundproof chamber. This experimental condition reduced the animals' willingness to vocalize, limiting the number and diversity of vocalizations sampled for each neuron. In those experiments, the animals almost exclusively produced isolation calls (phees).
In the present study, we overcome past problems by taking advantage of chronically implanted electrode arrays to reduce animals' restraints and by performing experiments in a more behaviorally appropriate environment, a large marmoset colony maintained by our laboratory. We recorded neural activity during vocalization with the animals either seated in a primate chair, but without head restraint, or moving freely within a cage. In contrast to recordings made in head-restrained animals, when recordings were conducted within the marmoset colony, allowing the animal to vocally interact with many other marmosets, the animals made a wider variety of vocalizations including both isolation and social call types such as phees, trillphees, trills, and twitters (Fig. 1). In addition to increased diversity of call types, the animals produced a much greater number of vocalizations than observed in our previous studies (Table 1), allowing more detailed characterization of vocalization-induced modulations on a unit-by-unit basis.
Table 1.
Total number of marmoset vocalizations recorded by call type
| Phee | 4,616 |
| Trillphee | 2,743 |
| Trill | 22,183 |
| 2,455 | |
| Other | 3,007 |
Vocalization-related modulations during phee calls.
Consistent with our previous observations, we found both vocalization-induced suppression and excitation during phees in single units recorded in the auditory cortex. Phees are the loudest, and longest, of the major marmoset call types, with intensities approaching or exceeding 100 dB SPL, and often consist of multiple phrases (DiMattina and Wang 2006). These are generally produced in conditions of social isolation (Miller and Wang 2006). A representative example is shown in Fig. 2A that illustrates both vocal suppression and the quality of neural recordings achieved with the implanted electrode arrays. Figure 2, B and C, show another representative unit that was strongly suppressed during a large number of phees (median RMI = −0.77; P < 0.001, signed rank), as can be seen in the raster (Fig. 2B) and PSTH (Fig. 2C) based on recordings made from this neuron during multiple phee calls, some of which had more than one phrase. This example also illustrates the previous observation that vocalization-induced suppression begins a few hundreds of milliseconds prior to the onset of vocal production, notable in the PSTH (Fig. 2C). Vocalization-related excitation was also observed in some units during phees when studied with the implanted electrode arrays, as shown by the representative example shown in Fig. 2D. Figure 2, E and F, illustrate another representative unit that was strongly excited during phee calls (RMI = 0.93; P < 0.001, signed rank), including multiple phees with more than one phrase.
Fig. 2.

Sample vocalization-related neural activity during phee calls. Examples are shown for units that were suppressed (A–C) and excited (D–F) during phees. A: simultaneously recorded vocal spectrogram (top) and extracellular neural recording trace (bottom) for a unit that exhibited vocalization-related suppression during phee vocalizations. Duration of vocalization is indicated by shaded box. B: raster plot for another example unit that was suppressed during a large number of phee vocalizations. Individual vocalization responses have been aligned by vocal onset for convenience (shaded). C: peristimulus time histogram (PSTH) of phee vocalization responses illustrated in B. Vocal onset is indicated by dashed red line. D: neural recording trace of a unit that exhibited vocalization-related excitation during phees. E and F: rasters (E) and a PSTH (F) for another example unit that was strongly excited by phee vocalizations.
We calculated population PSTHs for both vocalization-induced suppression and excitation for all phee samples after aligning their corresponding spike trains by vocal onset. Suppressed responses (RMI ≤ −0.2) showed a prominent decrease in the population average firing rate during vocalization before returning to baseline (Fig. 3A). The apparent slow return to prevocal levels was due to the high variability in phee duration and the large number of phee vocalizations with multiple phrases (i.e., Fig. 2E). The population PSTH also reveals the presence of prevocal suppression, beginning up to 750 ms before vocal onset. This prevocal suppression, though consistent with our previous observations (Eliades and Wang 2003), is less prominent in this larger data set. The population PSTH of excited vocalization responses (RMI ≥ 0.2) showed a sharp increase in firing immediately after vocal onset, followed by sustained neural activity (Fig. 3B). Although there is an indication of an increase in firing rate just before vocal onset, the average firing rate increase did not become statistically significant until immediately after vocal onset.
Fig. 3.

Population average PSTHs for suppressed and excited responses during phee vocalizations. Average PSTHs were calculated from onset-aligned neural activities after dividing the neural population into suppressed [response modulation index (RMI) ≤ −0.2] and excited (RMI ≥ 0.2) responses. A: population average PSTH for suppressed phee responses showing a large decrease in firing rate during vocalization. Vocal onset is indicated by dashed red line. Green bar (bottom) indicates duration of statistically significant (z score > 3) deviation from prevocal activity levels. The 2 dips in firing rate were due to multiphrased phees. Significant prevocal suppression was noted up to 750 ms before vocal onset. B: population average PSTH for excited responses. Unlike vocal suppression, excitation did not become significant until after vocal onset.
Vocalization-related modulations during trillphee calls.
The second major class of vocalizations we examined were trillphees, which contain elements of both trill and phee call types (Fig. 1B). Trillphees usually have durations similar to that of phees (DiMattina and Wang 2006). This type of vocalizations and their corresponding neural responses were not examined in our previous studies (Eliades and Wang 2003, 2005), in which marmosets vocalized phees nearly exclusively. Similar to what we have described for phee calls, both suppression and excitation were seen in auditory cortex when marmosets made trillphees. Figure 4A illustrates vocalization-induced suppression during a trillphee call recorded from a neuron. The exemplar unit in Fig. 4, B and C, exhibited consistent strong suppression during a large number of trillphees (median RMI = −0.86; P < 0.001, signed rank). The PSTH of this unit also exhibits prevocal suppression. Figure 4, D–F, illustrate the presence of vocalization-related excitation for trillphees in two units. The unit shown in Fig. 4, E and F, is strongly excited by self-produced trillphees (RMI = 0.75; P < 0.001, signed rank).
Fig. 4.

Sample vocalization-related neural activity during trillphee calls. Examples are shown for units that were suppressed (A–C) and excited (D–F) during trillphees. A: simultaneously recorded vocal spectrogram (top) and extracellular neural recording trace (bottom) for a unit that exhibited vocalization-related suppression during trillphee vocalizations. B: raster plot for another example unit that was suppressed during a large number of vocalizations. C: PSTH of the trillphee vocalization responses illustrated in B. D: neural recording trace of a unit that exhibited vocalization-related excitation during trillphees. E and F: rasters (E) and a PSTH (F) for another example unit that was strongly excited by trillphee vocalizations.
Population PSTHs for suppressed and excited trillphee responses (Fig. 5) were qualitatively similar to those for phees (Fig. 3). Suppressed responses showed a prominent decrease in firing rate during vocalization (Fig. 5A). Prevocal suppression was also present, though with a shorter duration than for phee responses, up to 200 ms before vocal onset. Also consistent with excitation during phees, trillphee excitation exhibited a prominent onset peak followed by sustained activity (Fig. 5B). Interestingly, prevocal activity increases for these responses were slightly more prominent than for phees, with intermittent periods of significance, but sustained increases in firing were not present until immediately after vocal onset.
Fig. 5.

Population average PSTHs for suppressed and excited responses during trillphee vocalizations. A: population average PSTH for suppressed trillphee responses (RMI ≤ −0.2) showing a large decrease in firing rate during vocalization. Prevocal suppression was noted but, unlike phees, did not become significant until 200 ms before vocal onset. B: population average PSTH for excited responses (RMI ≥ 0.2).
Vocalization-related modulations during trill calls.
Trill calls are primarily produced in social settings, like in the marmoset colony, and are the shortest and quietest (50–60 dB SPL) of the major call types produced by marmosets in captivity, typically between 0.2 and 0.5 s in duration (DiMattina and Wang 2006). Trill calls exhibit sinusoidal frequency and amplitude modulation (Fig. 1C). These calls were often produced in high numbers by each subject, allowing each unit to be studied for up to several hundreds of trills. As with the other major call types, both suppression and excitation were observed when marmosets produced trills. Figure 6, A–C, illustrate vocalization-induced suppression during trills in two units. The unit shown in Fig. 6, B and C, exhibited consistently suppressed responses during a large number of trills (median RMI = −0.48; P < 0.001, signed rank), although a prominent onset response was noted during many. Figure 6, D–F, illustrate examples of vocal excitation in two units during trills. The unit shown in Fig. 6, E and F, is strongly excited (RMI = 0.63; P < 0.001, signed rank).
Fig. 6.

Sample vocalization-related neural activity during trill calls. Examples are shown for units that were suppressed (A–C) and excited (D–F) during trills. A: simultaneously recorded vocal spectrogram (top) and extracellular neural recording trace (bottom) for a well-isolated unit that exhibited vocalization-related suppression during trill vocalizations. B: raster plot for another example unit that was suppressed during a large number of vocalizations. C: PSTH of the trill vocalization responses illustrated in B. D: neural recording trace of a unit that exhibited vocalization-related excitation during trills. E and F: rasters (E) and a PSTH (F) for another example unit that was strongly excited by trill vocalizations.
Population PSTHs for suppressed and excited trill responses (Fig. 7) were also similar to those for phees (Fig. 3), though with shorter durations. Suppressed responses showed a prominent decrease in firing during vocalization (Fig. 7A). Prevocal suppression was evident, extending up to ∼250 ms before vocal onset. Interestingly, the onset-related activity noted for phees and trillphees was not present in the average PSTH of trills. This was probably because of the shorter duration of trills, such that an onset response would contribute more to the calculation of a higher RMI, although it may also represent other differences such as vocal acoustics. Vocalization-related excitation during trills was also similar to that of the other call types (Fig. 7B). A gradual prevocal increase in firing was noted, similar to other calls, but lacking a specific deflection point seen for those calls. The statistical significance of this prevocal increase (260 ms) was likely related to a larger sample size of trills.
Fig. 7.

Population average PSTHs for suppressed and excited responses during trill vocalizations. A: population average PSTH for suppressed trill responses (RMI ≤ −0.2) showing a large decrease in firing rate during vocalization. Prevocal suppression was noted up to 300 ms before vocal onset. B: population average PSTH for excited responses (RMI ≥ 0.2).
Vocalization-related modulations during twitter calls.
Twitter calls consist of multiple short frequency-modulated phrases (Fig. 1D) and are primarily produced during vocal exchanges between marmosets in social contexts. Twitter calls were never observed for head-restrained animals in soundproof chambers in our previous studies (Eliades and Wang 2003, 2005). Duration of twitter calls is typically between 1 and 2 s. Auditory cortex exhibited both suppression and excitation during the production of twitter vocalizations. Figure 8, A–C, illustrate vocalization-induced suppression during twitters in two units. One example unit (Fig. 8, B and C) was consistently suppressed during twitters (median RMI −0.65; P < 0.001, signed rank). Discharges, when present, primarily occurred in the interphrase intervals of twitter calls. Figure 8, D–F, show examples of vocalization-related excitation during twitters. The example unit shown in Fig. 8, E and F, is strongly excited (RMI = 0.70; P < 0.001, signed rank). Close examination of the onset-aligned PSTH (Fig. 8F) shows phasic responses consistent with the multiple twitter phrases.
Fig. 8.

Sample vocalization-related neural activity during twitter calls. Examples are shown for units that were suppressed (A–C) and excited (D–F) during twitters. A: simultaneously recorded vocal spectrogram (top) and extracellular neural recording trace (bottom) for a unit that exhibited vocalization-related suppression during twitter vocalizations. B: raster plot for another example unit that was suppressed during a large number of vocalizations. C: PSTH of the twitter vocalization responses illustrated in B. D: neural recording trace of a unit that exhibited vocalization-related excitation during twitters. E and F: rasters (E) and a PSTH (F) for another example unit that was strongly excited by twitter vocalizations.
Population average PSTHs for suppressed and excited twitter responses (Fig. 9) were similar to those of other call types. Vocalization-induced suppressed responses were suggestive of prevocal suppression, but this was not a significant trend (Fig. 9A). Excited responses showed a prominent sharp onset immediately after vocal onset (Fig. 9B). Interestingly, both suppressed and excited responses exhibited some degrees of phasic responses, as can be seen from the PSTHs, particularly during the early part of the call. These correspond to the individual twitter phrases. The loss of the phrase-related activity during the latter half of the call was likely the result of variable phrase and interphrase durations, skewing the alignment of phrase onsets and the corresponding neural activities.
Fig. 9.

Population average PSTHs for suppressed and excited responses during twitter vocalizations. A: population average PSTH for suppressed twitter responses (RMI ≤ −0.2) showing a large decrease in firing rate during vocalization. The PSTH suggests prevocal suppression, but this was not statistically significant. B: population average PSTH for excited responses (RMI ≥ 0.2). Both suppressed and excited PSTHs show oscillations shortly after vocal onset that are suggestive of phasic responses related to the twitter vocalization phrases (see Fig 1D). This phasic response is not optimally reflected by an onset-aligned PSTH because of variability in phrase durations.
Prevalence of suppressed and excited neural populations across different call types.
In previous sections, we established the existence of both vocalization-induced suppression and excitation for each of the four major call types. There was a general consistency in vocalization-induced modulations among the four call types. We calculated the mean RMI for each of the recorded units individually and plot the results as distribution functions for each call type in Fig. 10. These mean RMIs formed a continuous distribution from completely suppressed (RMI = −1) to highly excited (RMI ∼ 1) for each call type. The results show a qualitatively similar trend, particularly the predominance of suppressed units, as seen in our previous studies (Eliades and Wang 2003). We previously showed that 74.6% of units were suppressed (RMI < 0) during phee vocalizations. Our present results show 70.8% suppressed units for phees, 76.8% for trillphees, 87.8% for trills, and 71.3% for twitters, respectively. Of these suppressed (RMI < 0) units, statistically significant suppression was present in many, but not all (P < 0.01; phee 72.1%, trillphee 52.3%, trill 76.2%, twitter 45.3%), because of either small sample sizes or high response variability. Other quantitative differences between the call type distributions were also present. While both phees and trillphees showed similar distributions (population mean RMI −0.22 ± 0.38 vs. −0.26 ± 0.39), trills showed overall more prevalent and stronger suppression (−0.35 ± 0.35). Twitters, on the other hand, showed a prevalence of suppressed units similar to that of phees, but the magnitude of that suppression was smaller (population mean RMI −0.16 ± 0.34). These population differences, though small, were statistically significant (P < 0.001, Kruskal-Wallis), particularly between trills or twitters and other call types, but not between phees and trillphees (P > 0.05).
Fig. 10.

Population distributions of vocal RMIs for individual units. Shown are cumulative distribution functions for mean RMIs calculated individually for each unit. Separate curves are plotted for each call type and show overall similar trends. Trills were more likely to be suppressed, and twitters less, than phees and trillphees. Depending on the call type, between 70% and 88% of units were suppressed (RMI < 0) during vocalization. +, Units with significant vocal modulations (N ≥ 4 calls, P < 0.01).
Careful examination of the PSTHs shown in Figs. 3, 5, 7, and 9 suggests differences in the prevocal firing rate between suppressed and excited responses as well as between different call types. The mean prevocal firing rates for all suppressed (RMI < −0.2) and excited (>0.2) neurons were 8.19 ± 9.00 and 6.52 ± 7.05 spikes/s (P < 0.001, rank sum). These rates suggest a small difference between these two groups of neurons, although the variances suggest large overlaps. The difference may also be due to detection bias, as suppression is more easily detectable with higher spontaneous/prevocal rates and excitation is more prominent with lower rates. A comparison of the prevocal firing rate between different call types showed a mean difference of 0.76 ± 4.84 spikes/s, suggesting little overall effect.
Comparison of vocal responses between call types within individual neurons.
Having shown the similarity and differences between vocalization-induced modulations between the different call types at the population level, we now examine how individual units behave during different vocalizations. An important issue is whether neurons exhibit consistent suppression or excitation across different call types. Because of the stability afforded by the chronically implanted electrode array, and the increased vocal diversity and frequency in the colony recording setting, we were able to compare the responses of the studied units during two or more vocalization types. Figure 11A illustrates an example where a marmoset produced a trill, waited briefly, and then produced a twitter. A simultaneously recorded unit was excited by the trill but suppressed by the twitter. Many units exhibited consistent vocal responses when marmosets produced multiple different call types, including both suppressed (Fig. 11B; P > 0.05, Kruskal-Wallis) and excited (Fig. 11C; P > 0.05) units. Other units responded differently to different call types, sometimes even switching their modulations from suppressed to excited. One example unit (Fig. 11D) was strongly suppressed during trills (RMI = −0.61) but was excited when the animal twittered (RMI = 0.32; P < 0.001, rank sum). Another unit (Fig. 11E) was suppressed during trillphees (RMI = −0.56) but became weakly excited during trills (RMI = 0.18; P < 0.001, rank sum).
Fig. 11.

Samples of individual units' responses to multiple call types. When multiple call types were vocalized while recording from stable single units, the responses were compared between the different vocalizations. A: sample spectrogram (top) and raw neural trace (bottom) of a unit sampled while the animal made a trill (green) and a twitter (red) in rapid succession. This unit was suppressed during the twitter but seemed to be excited by the preceding trill. B and C: vocal RMI distributions are shown for 2 units both of which showed consistent responses to the multiple call types, one consistently suppressed (B) and one consistently excited (C). N is the number of vocalizations of each call type, and the corresponding mean RMI is indicated. In contrast, some units like the sample in A exhibited opposite responses during different call types, as illustrated in D and E.
We compared vocal modulations between pairs of call types across a population of 1,288 units where at least two of the four vocalizations were sufficiently sampled for each unit. Figure 12A shows the joint probability distribution of this pairwise intraunit comparison. As suppression was the most common neural response observed for all call types, it is not surprising that the highest joint density was in the lower left quadrant (suppressed by both calls, 66.4% of pair comparisons), suggesting that most units responded similarly to different call types. This is particularly evident for highly suppressed units (Fig. 12A), those with one RMI close to −1, which rarely changed vocalization-related activity between call types. Only a few units switched from completely suppressed (RMI = −1) to strongly excited (RMI > 0.4). Vocal responses that changed between suppression and excitation were more prevalent among weakly suppressed units, those with RMIs close to 0. Overall, 27.6% of units changed their responses from suppressed (RMI < 0) during one call type to excited (RMI > 0) during another. A breakdown of this population into neurons that were suppressed (Fig. 12B, left) or excited (Fig. 12B, right) for at least one call type showed that suppressed neurons were more likely to remain suppressed for both call types, and less likely to switch to excited responses (21.0%), than excited units, which were far more likely to be suppressed for one of the call types (83.8%).
Fig. 12.

Comparison of call type differences within individual units across the population. A: a joint probability function is plotted comparing RMIs between pairs of call types (V1, V2). The highest density was for units weakly suppressed by both vocalizations. Overall, units suppressed by both call types, the bottom left quadrant, were most prevalent (66.4% of units). Units excited by both vocalizations (top right) accounted for 6.0% of units. Units switching behavior, those in the remaining 2 quadrants, account for 27.6% of units. B: probability functions are shown separately plotting the behavior of units suppressed (RMI < 0, left) or excited (RMI > 0, right) for at least 1 call type. The probability scale is the same as for A. Suppressed neurons were more likely to remain suppressed, while excited units were more likely to change behavior. Those units whose RMI changed were clustered near the zero RMI line for 1 call type, indicating that their vocal responses generally changed from suppressed or excited to unresponsive. C: a population distribution shows the distribution of RMI differences between call type pairs for individual units. Units whose RMI changed significantly (P < 0.05, Kruskal-Wallis) are shaded.
We quantified the difference in RMI between the call types individually for each unit (Fig. 12C). The median RMI difference between call types was 0.27. Of the 1,288 units sampled with multiple vocalizations, only 290 (22.8%) were found to have significant differences (P < 0.01, Kruskal-Wallis) in their response to the different call types. The median RMI difference for these units was 0.38, although the distribution for these units was qualitatively similar to that of the whole neural population (Fig. 12C).
We further compared RMI differences between specific pairs of call types (Fig. 13). These comparisons revealed some interesting similarities and differences. Phee and trillphees, for example, evoked relatively similar vocalization-induced modulations (Fig. 13A), with a mean RMI difference of −0.01 ± 0.37 (mean ± SD; P > 0.05, signed rank), not surprising given the acoustic similarity of the two calls. Other call type pairs exhibited greater population variance, with a standard deviation of 0.45 for phee-trill differences (Fig. 13B) and 0.47 for phee-twitter differences (Fig. 13C), indicative of larger overall differences between the calls' neural responses. Some call type differences also showed systematic bias. Phee responses, for example, were significantly less suppressed than responses to trills (Fig. 13B; phee-trill = 0.16 ± 0.45; P < 0.001, signed rank). Trilphees were similarly less suppressed than trills (Fig. 13D; 0.10 ± 0.41, P < 0.001). Twitters were less suppressed, and more excited, than other call types (Fig. 13, E–G). These pairwise intraunit comparisons (Fig. 13G) reflect closely the relative population responses for individual call types (Fig. 10), in which trills are more suppressed and twitters less suppressed than the other call types.
Fig. 13.

Paired comparison of call type differences within individual units separated by call type. A–F: unit RMI differences between call types are shown for each of the 6 possible vocalization combinations. Units with significant call type differences are shaded for illustration. Population means are indicated. Phees and trillphees (Trph) were most closely matched (A), while comparisons with twitters (Twit) (C, E, F) had large negative bias, indicating that twitter responses were less suppressed, or more excited, than other call types. G: population cumulative distribution function summarizing the distributions in A–F, with corresponding colors, for comparison.
Taking a step beyond pairwise comparisons between call types, we also examined the number of vocalizations in each unit that evoked significant suppression or excitation during vocal production. Units sampled with all four call types were generally significantly suppressed by between one and three vocalizations (1: 29.9%, 2: 31.2%, 3: 29.9%; Fig. 14A). Smaller numbers of units were significantly suppressed by all four types of vocalizations. In contrast, the vast majority of units were significantly excited by none of the vocalizations (83.1%; Fig. 14C), and only small numbers were excited by one, two, or three call types. Neurons significantly suppressed during at least one of the call types had a small probability of being excited by one or two of the other call types (10.4%; Fig. 14B), a chance that decreased for neurons suppressed by two or more call types (1.3%). Units with significant excitation during multiple (2 or more) types of vocalization were also unlikely to switch responses to suppressed (2.6%). These results, collectively, suggest that most auditory cortical units do not significantly change their vocalization-related behavior between different types of vocalizations. Those units that did switch their response tended to either change their degree of suppression or change between weak suppression and weak excitation between call types.
Fig. 14.

Comparison of significant vocalization responses within individual units to multiple call types. Units sampled with all 4 calls (N = 77) were examined to determine the number of call types evoking suppression or excitation. A: % of call types evoking significant vocalization-induced suppression. Most units were significantly suppressed (P < 0.01, rank sum) for 1–3 of the call types. Units significantly suppressed during all 4 call types were rare (1.3%). B: distribution comparing the number of significantly suppressed and excited vocal responses for individual units. C: distribution of units excited during multiple call types. Unlike suppression, significant excitation occurred only for a small number of call types; only 10.4% were significantly excited by a single call type and none for all 4. Most units were significantly suppressed by 2 or 3 call types and excited by none (59.8%). It was uncommon for units to exhibit a mix of significant suppression and excitation; only 11.7% of units were suppressed for one call type and excited for one other. Less than 4% of units were significantly suppressed or excited for at least 2 call types and then had the opposite behavior for a third vocalization. Units with no significant response for any call type were rare (2.6%).
Call type differences and auditory tuning properties of neurons.
One possible explanation for differences in a neuron's responses to different call types could be auditory response properties of the neuron. For example, a neuron with particular frequency tuning that overlapped the frequency spectrum of one vocalization, but not another, might respond differently between the two vocalizations. We therefore examined the frequency and sound-level tuning measured, using either tone or band-pass noise stimuli of the two groups of neurons, those that showed significant differences between multiple call types and others that did not (Fig. 15). The CFs of both groups were overlapping and spanned the entire range of marmoset hearing range (Fig. 15A). Neurons exhibiting call type differences showed a slightly higher median CF than those without, but this difference was not significant (P > 0.05, rank sum). The BWs of both groups were also highly overlapping (Fig. 15D), though slightly lower for neurons with significantly different responses between call types (P > 0.05, rank sum). A more detailed breakdown comparing individual call type pairs (Fig. 15, B and E) revealed that units with significant pair differences had largely overlapping distributions (CF: P > 0.05, BW: P = 0.053; Kruskal-Wallis). Some interesting individual differences were noted, however. Units that discriminated phee and trillphee, for example, had a lower median CF and higher BW than units that did not (2 vs. 4.6 kHz, 0.3 vs. 0.2 octaves), which might account for some of these call type differences, although both phees and trillphees have vocal frequencies much higher (7.39 vs. 7.32 kHz) than either median CF. Similarly, units that discriminated trillphees from twitters had a higher median CF (8.9 kHz) but smaller BW (0.1 octaves). A comparison of tuning and phee-trillphee responses (Fig. 15, C and F) showed no clear relationship between CF and the direction of call type differences. Comparisons for other call type pairs were similarly unrevealing. These results suggest that some, but not all, call type differences may be attributable to units' underlying frequency tuning.
Fig. 15.

Comparison of auditory tuning between units. Center frequency (CF, A–C) and frequency tuning peak bandwidth (BW, D–F) are compared between those units with significant and nonsignificant call type differences. Both distributions were overlapping. Significant units had slightly higher median CFs (6.50 vs. 4.59 kHz) and narrower median BWs (0.1 vs. 0.2 octaves), but neither difference was statistically significant (P > 0.05, rank sum). B and E: cumulative distribution functions are shown comparing tuning for units with significant differences between individual call type pairs (colors) and those that failed to distinguish any pairs (open bars). C and F: scatterplots comparing tuning and differences between phees and trillphees. Rate-level curves were calculated for all units based on tone, noise, or vocal playback responses at multiple sound levels. Distributions of the monotonicity index (G–I), the firing rate at maximum SPL divided by the peak response firing rate, and SPL of the peak response (J–L) are also shown. Median values for significant and nonsignificant units were 0.57 vs. 0.60 and 50 vs. 45 dB SPL. Neither difference was statistically significant (P > 0.05, rank sum). H and K: cumulative distribution functions comparing monotonicity and peak SPL for call pair differences. I and L: scatterplots comparing monotonicity and call type differences.
The rate-level tuning of units is another parameter that might account for intervocalization response differences, given the variations in vocalization loudness. Units with significant and nonsignificant differences between the different call types also had similar level tuning properties (Fig. 15, G–L). Rate-level curves were calculated for each unit and parameterized by their monotonicity index and peak SPL. The monotonicity index (Fig. 15G), the ratio between the maximum firing rate and the firing rate at maximal SPL, indicates the degree to which a unit's rate-level tuning is monotonic (>0.5) or nonmonotonic (<0.5) (Sadagopan and Wang 2008). Monotonicity index distributions were overlapping for both groups, with similar medians (0.57 vs. 0.6; P > 0.05, rank sum), indicating that both groups of units had a mix of monotonic and nonmonotonic sound level responses. The peak SPL (Fig. 15J), the level eliciting the best firing rate, was also similar between the two groups. Analysis by call type pairs (Fig. 15, H and K) showed overlapping distributions (P > 0.05, Kruskall-Wallis). Units discriminating trillphees from twitters tended to be slightly more monotonic (median monotonicity 0.8 vs. 0.57, peak SPL 70 vs. 45 dB), as were units discriminating phees from trillphees (0.6, peak 60 dB). Rate-level tuning was not clearly related to the direction of call type differences (Fig. 15, I and L). These results suggest that, as in the case of frequency tuning, basic amplitude tuning cannot account fully for the tendency of some units to discriminate between different call types during vocal production.
Comparison between responses to self-produced and passive playback of vocalizations.
We compared neural responses to self-produced vocalizations and those evoked by passive playback of recorded vocalizations in terms of the differences between call types. Many neurons exhibited similar call type differences in both vocal production and playback, while others showed different responses. Figure 16A illustrates one sample neuron that was suppressed for trills and excited for twitters during both vocalization (RMI difference 0.93; P < 0.001, rank sum) and playback (0.63; P < 0.001). A second sample neuron (Fig. 16B) showed no difference between call types during either production or playback (RMI difference 0.06, P > 0.05, vs. 0.07, P > 0.05, rank sum). A third neuron (Fig. 16C) showed call type differences during playback for some call types but no differences during vocalization (RMI difference 0.04, P > 0.05 vs. 0.18, P < 0.05, Kruskal-Wallis), illustrating the diversity of responses.
Fig. 16.
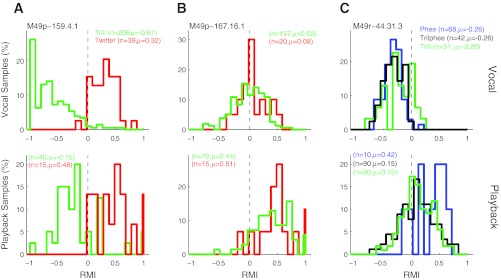
Samples of individual unit responses to multiple call types during vocal production and playback. Three sample units are shown comparing responses to multiple call types during vocal production (top) and playback of recorded vocal samples (bottom) presented while the animals sat quietly. A: a sample unit demonstrating differences between trills and twitters during both vocalization and playback. B: a unit showing no difference between call types during vocal production or playback. C: a third unit showing differences during playback but not during vocal production. Number of samples and mean vocal response are indicated for each unit.
To examine this diversity of responses, we further quantified the call type differences during playback. The distribution of the mean differences in responses to playback of the different call types is shown in Fig. 17A. The median of the playback RMI difference distribution is 0.20, smaller than that for self-produced vocalization (Fig. 12C, median 0.27; P < 0.001, rank sum). The playback responses for those units with significant call type differences during vocal production overlapped those units without vocal call type differences. Several units exhibited significant differences during vocal production with minimal differences during passive playback of the same call types (i.e., the shaded areas in Fig. 17A with small playback RMI differences). The playback RMI difference for the significant units, however, was slightly higher (median 0.25 vs. 0.20; P < 0.01, rank sum).
Fig. 17.

Comparison of playback and vocal production call type differences. A: population call type differences during passive vocal playback, quantified by a playback RMI difference. Units with significant call type differences during vocal production (shaded) overlapped nonsignificant units but had a higher median playback RMI difference (0.25 vs. 0.20; P < 0.01, rank sum). B: scatterplots showing direct comparisons between auditory and vocal RMI call type differences for each call type. These were weakly, but significantly (P < 0.001), correlated for all call types.
Overall, only 10.7% of neurons showed significant call type differences during both playback and self-produced vocalization; 33.4% showed differences in either one condition or the other, 19.8% only during production and 13.6% only during playback. Most neurons (55.9%) showed significant differences between call types in neither condition. Direct comparison of intercall RMI differences between playback and self-produced vocalizations (Fig. 17B) showed small but significant correlations (phee: r = 0.27; trillphee: r = 0.21; trill: r = 0.28; twitter: r = 0.28; P < 0.001). A more detailed comparison of vocalization and playback by paired call types also showed only weak correlations (phee-trillphee: r = 0.09; phee-trill: r = 0.31; phee-twitter: r = 0.23; trillphee-trill: r = 0.19; trillphee-twitter: r = 0.25; trill-twitter: r = 0.02). These results suggest that a small portion of response differences during vocal production may be attributable to underlying passive sensory tuning. However, the relatively small magnitudes of the correlations also indicate that most of the intercall differences during self-produced vocalizations cannot be so simply explained.
Neural responses to self-produced vocalizations and recording locations.
Finally, we examined the relationship between recording location and neuron call type specificity for self-produced vocalizations. The arrays used in these recordings contained four rows of electrodes, typically with two rows in primary cortex, another row in lateral belt, and a final row in parabelt auditory areas (Fig. 18, A and B). We compared vocal call type discriminability, expressed as a d′ measure, between the four rows (Fig. 18C) and found a broad distribution in all anatomic locations. There were, however, notable trends, with greater vocal discriminability in medial rows compared with more lateral rows. Units in the medial row had a median d′ of 0.75, with progressively more lateral rows 0.69, 0.62, and 0.57, respectively (P < 0.001, Kruskal-Wallis). We did not observe consistent trends in vocal discriminability based on cortical depth or hemisphere.
Fig. 18.

Anatomic location and call type differences. Multielectrode arrays used in these experiments were placed so that they ideally spanned both primary and nonprimary auditory cortex. Approximate locations of the arrays and electrode grid are illustrated in A and B. Two rows of electrodes generally fell within A1, while the third and fourth rows were within lateral belt (LB) and possibly parabelt (PB). R, rostal field. The vocal call type discriminabilty, expressed as a mean d′ function between different call types, was calculated for individual neurons and compared by electrode row (C). Medial rows had slightly higher discriminability than the more lateral rows, with d′ medians of 0.75, 0.69, 0.6, and 0.57, indicated by markers atop each distribution.
DISCUSSION
We have studied responses of a large number of single units in marmoset auditory cortex during self-produced vocalizations. We have shown that previously described vocalization-induced suppression in marmoset auditory cortex (Eliades and Wang 2003) is a general phenomenon that occurs during all recorded marmoset call types with roughly equal probability. Individual neurons, when recorded during multiple call types, show diverse properties. Most neurons did not change their vocalization-related activity when an animal made different vocalizations; however, a small number of neurons did exhibit such call type preferences. These differences may have been related to, but not fully accounted for by, the underlying auditory properties of these neurons. These findings further our understanding of auditory-vocal interaction in auditory cortex, with implications for feedback-mediated vocal control.
Auditory-vocal interaction as a general mechanism.
Perhaps the most important observation in this study is the generality of auditory-vocal interaction, in particular vocalization-induced suppression, across different marmoset call types. Previous work, both in our laboratory (Eliades and Wang 2003, 2005) and by others (Müller-Preuss and Ploog 1981), has focused on establishing the auditory-vocal interactions at the neural level, or on demonstrating relationship to vocal feedback (Eliades and Wang 2008a). While it was suggested that the interaction occurred during multiple call types, it is important that we now demonstrate this generalization. Monkeys, like humans, produce more than one type of vocalization. If auditory-vocal interaction is a truly general mechanism for dealing with self-generated communication sounds, it must occur for all types of vocalizations as shown here. Both vocalization-induced suppression and vocalization-related excitation occur for all four of the major marmoset call types, and the ratio of 70–75% of units exhibiting vocal suppression roughly holds for all these call types. These results are also reassuring that our previous observations about auditory-vocal interactions during phee vocalizations were not a special case, and broadly apply to all vocal production.
Many of our earlier observations about the details of auditory-vocal interaction also appear to generalize among the different call types studied. Vocalization-induced suppression during phees begins prior to the onset of vocal production, on the order of several hundred milliseconds (Eliades and Wang 2003). This result holds qualitatively true for the phees recorded here as well as the other three call types. Prevocal suppression was seen for phees, trillphees, trills, and, to a lesser extent, twitters. The duration and magnitude of this prevocal suppression were quantitatively different between the call types, likely related to both physiological differences, such as call duration and magnitude of maximum suppression, and other experimental biases, including the number of vocalizations produced. Interestingly, there were also notable differences in the prevocal suppression between the phees in these experiments and our previous observations. Here, the prevocal suppression did not reach the minimal firing rate until well after the vocal onset. The origin of this difference is unclear, though it may result from biased neuronal sampling related to the different microelectrode preparations. At the least, these differences suggest that auditory-vocal interactions are more diverse than previously appreciated and that not all vocalization-induced suppression is the same.
Generality of auditory-vocal interaction within individual neurons.
The observation of how individual neurons behave during different types of vocalizations also has important implications for our understanding of auditory-vocal mechanisms. Most neurons did not exhibit significant differences in their responses between different call types. Neurons that were suppressed for one call type were likely to be suppressed, to a varying degree, for the other calls. The small set of neurons that showed differences between call types were most likely to be strongly suppressed or excited for one vocalization and unresponsive, neither suppressed nor excited, for another. This was particularly evident for vocalization-related excitation, which tended to be significant for only a single call type. True qualitative shifts in vocalization responses, i.e., from significantly suppressed for one call type to significantly excited for another, were uncommon (<10%).
It is perhaps not surprising that most neurons, particularly suppressed neurons, respond more or less similarly to different types of vocalizations. The population ratio of suppression and excitation is preserved among the call types. The primary implication is that the same corollary discharge mechanism (Crapse and Summer 2008; Sperry 1950) proposed to underlie vocalization-induced suppression is active for a given neuron during the different calls. Quantitative differences in the degree of suppression could arise either from changes in the corollary discharge signal or, as previously suggested (Eliades and Wang 2005), from changes in auditory feedback arising from acoustic differences between the calls.
Another important observation was that vocalization-related excitation tended to be more specific than suppression. While most suppressed neurons were inhibited during two or three of the call types, the excited neurons tended to be excited during one of the vocalizations preferentially over the others. This is perhaps not surprising. Excited vocalization responses are likely sensory responses to feedback of the produced vocalization in neurons that are not suppressed by internal corollary discharge mechanisms, as evidenced by the timing of excitation and more constant responses during altered vocal feedback (i.e., Eliades and Wang 2008a). Most auditory cortical neurons respond to only a subset of vocalization stimuli during playback in a passively listening animal (Newman and Wolberg 1973; Rauschecker et al. 1995), particularly in lateral belt and parabelt areas. If excited vocal responses are, in fact, unmodulated sensory responses, then their call type selectivity should be predicted by passive playback selectivity. This is reinforced by the observation that the same neurons that discriminate between call types during vocalization also perform slightly better at discriminating (have higher RMI differences) between call types during passive playback.
Perhaps the most interesting neurons, however, were those that appeared to be suppressed during one type of vocalization and significantly excited during another. These constitute a minority of auditory cortical neurons whose existence suggests several possible mechanisms. The simplest mechanism one might propose is due to passive auditory tuning of the neurons. A neuron whose spectral receptive field encompassed the acoustics of one vocalization but not another should perform better at discriminating between the two. This was not obviously the case for vocalization-related neural responses. Both neurons that reliably discriminated between call types and those that did not had nearly identical distributions of frequency and level tuning. While there were differences in playback discrimination between call types, these were only weakly related to discrimination during vocalization.
Another possible mechanism follows a sparse or distributive coding paradigm (Hromadka et al. 2008; Olhausen and Field 2004). Individual neurons may only be involved in feedback monitoring for a subset of vocalizations and not for others. As a result, their vocalization-related inhibitory inputs might be active only during those call types, resulting in selective vocal inhibition. Such an explanation has appeal from a theoretic standpoint, in terms of computational efficiency; however, a similar theory for passive vocal perception, the idea of a “call detector” neuron, has been largely discredited (Symmes 1981). A final alternate mechanistic explanation can be related to the feedback processing function of auditory cortical neurons during vocalization. We have previously observed that some neurons are suppressed during a subset of phee vocalizations but are excited during other phees when an animal changed its vocal acoustics (Eliades and Wang 2005). Those observations, as well as these, may have resulted from neurons with baseline vocalization-induced suppression that is modified by vocal acoustic feedback. Such coding need not be limited to artificial changes in vocal feedback (Eliades and Wang 2008, 2012); it may also apply to the acoustic variations within and between call types. The weak relationship between playback and vocal production discrimination suggests that vocalization-induced suppression, which increases feedback sensitivity, may also be responsible for enhancing call type differences.
Anatomic correlates of call type discrimination during vocalization.
One final observation worthy of discussion is the influence of anatomic location upon vocalization-induced modulation for different call types. There was a subtle, but significant, increase in discriminability between the call types in the more medial areas of auditory cortex compared with more lateral areas. Previous work has suggested increased auditory stimulus selectivity in lateral and parabelt areas of monkey auditory cortex (Rauschecker et al. 1995; Tian et al. 2001). The apparent difference might be reconciled by the suggested hypothesis that call type differences during vocalization are due to acoustic feedback rather than high-order selectivity. Neurons in core areas of auditory cortex, likely A1, might perform better at discriminating differences in feedback acoustics because of their narrower spectral receptive fields (Rauschecker et al. 1995), particularly if such feedback sensitivity was enhanced by vocalization-induced suppression.
Mechanism of vocalization-induced suppression and auditory-vocal integration.
We have previously suggested (Eliades and Wang 2003) that suppression during vocalization results from internal modulatory signals, termed corollary discharges (Sperry 1950). These motor-associated signals, also sometimes termed efference copies, have been implicated in a variety of sensory-motor behaviors (Crapse and Summer 2008). One possible source for this corollary discharge is prefrontal cortical areas involved in vocal motor control. Anatomic and physiological connections between frontal areas and the superior temporal gyrus have been demonstrated in nonhuman primate species (Hackett et al. 1999; Romanski et al. 1999a, 1999b), and many of these areas exhibit vocal production-associated neural activity (Gemba et al. 1995). Recent immediate-early gene studies in marmosets demonstrate increased expression during antiphonal calling, a common auditory-vocal behavior, in prefrontal areas (Miller et al. 2010). Furthermore, emerging models of human speech motor control also implicate frontal-temporal connections in auditory self-monitoring using forward-model predictions of expected sensory feedback (Houde and Nagarajan 2011).
Mounting evidence also suggests that activity observed during vocalization at the single-neuron level reflects neither suppressive corollary discharges nor auditory feedback inputs alone, but rather an integration of the two. The degree of vocal suppression or excitation is determined by the relative weighting of these two inputs. We previously demonstrated that excited responses are interrupted by masking vocal feedback (Eliades and Wang 2012) and that these neurons also respond to outside sounds during vocalization (Eliades and Wang 2003), suggesting a vocal response resulting from passive sensory input with little suppression by internal signals. Suppressed neurons, on the other hand, are inhibited during vocalization but paradoxically actually exhibit increased sensitivity to artificial changes in vocal feedback (Behroozmand et al. 2009; Eliades and Wang 2008a, 2012), reflecting the combined inputs of both internal suppression and external excitation. The present work reinforces these observations, demonstrating that suppression is the more general phenomenon across vocalization while excitatory auditory input, like passive sound coding (Rauschecker et al. 1995), is more call type specific. The mechanism of this integration of auditory feedback and vocal motor signals remains a key question for future research.
GRANTS
This work was supported by National Institute on Deafness and Other Communication Disorders Grants DC-005808 and DC-008578 (X. Wang).
DISCLOSURES
No conflicts of interest, financial or otherwise, are declared by the author(s).
AUTHOR CONTRIBUTIONS
Author contributions: S.J.E. and X.W. conception and design of research; S.J.E. performed experiments; S.J.E. and X.W. analyzed data; S.J.E. and X.W. interpreted results of experiments; S.J.E. prepared figures; S.J.E. drafted manuscript; S.J.E. and X.W. edited and revised manuscript; S.J.E. and X.W. approved final version of manuscript.
ACKNOWLEDGMENTS
The authors thank A. Pistorio for assistance in animal care and training.
REFERENCES
- Behroozmand R, Karvelis L, Liu H, Larson CR. Vocalization-induced enhancement of the auditory cortex responsiveness during voice F0 feedback perturbation. Clin Neurophysiol 120: 1303–1312, 2009 [DOI] [PMC free article] [PubMed] [Google Scholar]
- Békèsy G. The structure of the middle ear and the hearing of one's own voice by bone conduction. J Acoust Soc Am 21: 217–232, 1949 [Google Scholar]
- Brumm H, Voss K, Kollmer I, Todt D. Acoustic communication in noise: regulation of call characteristics in a New World monkey. J Exp Biol 207: 443–448, 2004 [DOI] [PubMed] [Google Scholar]
- Burnett TA, Freedland MB, Larson CR, Hain TC. Voice F0 responses to manipulations in pitch feedback. J Acoust Soc Am 103: 3153–3161, 1998 [DOI] [PubMed] [Google Scholar]
- Christoffels IK, Formisano E, Schiller NO. Neural correlates of verbal feedback processing: an fMRI study employing overt speech. Hum Brain Mapp 28: 868–879, 2007 [DOI] [PMC free article] [PubMed] [Google Scholar]
- Crapse TB, Sommer MA. Corollary discharge circuits in the primate brain. Curr Opin Neurobiol 18: 552–557, 2008 [DOI] [PMC free article] [PubMed] [Google Scholar]
- Creutzfeldt O, Ojemann G, Lettich E. Neuronal activity in the human lateral temporal lobe. II. Responses to the subjects own voice. Exp Brain Res 77: 476–489, 1989 [DOI] [PubMed] [Google Scholar]
- Crone NE, Hao L, Hart J, Jr, Boatman D, Lesser RP, Irizarry R, Gordon B. Electrocorticographic gamma activity during word production in spoken and sign language. Neurology 57: 2045–2053, 2001 [DOI] [PubMed] [Google Scholar]
- Curio G, Neuloh G, Numminen J, Jousmaki V, Hari R. Speaking modifies voice-evoked activity in the human auditory cortex. Hum Brain Mapp 9: 183–191, 2000 [DOI] [PMC free article] [PubMed] [Google Scholar]
- DiMattina C, Wang X. Virtual vocalization stimuli for investigating neural representations of species-specific vocalizations. J Neurophysiol 95: 1244–1262, 2006 [DOI] [PubMed] [Google Scholar]
- Eliades SJ, Wang X. Sensory-motor interaction in the primate auditory cortex during self-initiated vocalizations. J Neurophysiol 89: 2194–2207, 2003 [DOI] [PubMed] [Google Scholar]
- Eliades SJ, Wang X. Dynamics of auditory-vocal interaction in monkey auditory cortex. Cereb Cortex 15: 1510–1523, 2005 [DOI] [PubMed] [Google Scholar]
- Eliades SJ, Wang X. Neural substrates of vocalization feedback monitoring in primate auditory cortex. Nature 453: 1102–1106, 2008a [DOI] [PubMed] [Google Scholar]
- Eliades SJ, Wang X. Chronic multi-electrode neural recording in free-roaming monkeys. J Neurosci Methods 172: 201–214, 2008b [DOI] [PMC free article] [PubMed] [Google Scholar]
- Eliades SJ, Wang X. Neural correlates of the Lombard effect in primate auditory cortex. J Neurosci 32: 10737–10748, 2012 [DOI] [PMC free article] [PubMed] [Google Scholar]
- Epple G. Comparative studies on vocalization in marmoset monkeys (Hapalidae). Folia Primatol (Basel) 8: 1–40, 1968 [DOI] [PubMed] [Google Scholar]
- Flinker A, Chang EF, Kirsch HE, Barbaro NM, Crone NE, Knight RT. Single-trial speech suppression of auditory cortex activity in humans. J Neurosci 30: 16643–16650, 2010 [DOI] [PMC free article] [PubMed] [Google Scholar]
- Ford JM, Mathalon DH. Electrophysiological evidence of corollary discharge dysfunction in schizophrenia during talking and thinking. J Psychiatr Res 38: 37–46, 2004 [DOI] [PubMed] [Google Scholar]
- Ford JM, Mathalon DH, Heinks T, Kalba S, Faustman WO, Roth WT. Neurophysiological evidence of corollary discharge dysfunction in schizophrenia. Am J Psychiatry 158: 2069–2071, 2001 [DOI] [PubMed] [Google Scholar]
- Fu CH, Vythelingum GN, Brammer MJ, Williams SC, Amaro E, Jr, Andrew CM, Yaguez L, van Haren NE, Matsumoto K, McGuire PK. An fMRI study of verbal self-monitoring: neural correlates of auditory verbal feedback. Cereb Cortex 16: 969–977, 2006 [DOI] [PubMed] [Google Scholar]
- Gemba H, Miki N, Sasaki K. Cortical field potentials preceding vocalization and influences of cerebellar hemispherectomy upon them in monkeys. Brain Res 697: 143–151, 1995 [DOI] [PubMed] [Google Scholar]
- Green DM, Swets JA. Signal Detection Theory and Psychophysics. New York: Wiley, 1966 [Google Scholar]
- Greenlee JD, Jackson AW, Chen F, Larson CR, Oya H, Kawasaki H, Chen H, Howard MA. Human auditory cortical activation during self-vocalization. PLoS One 6: e14744, 2011 [DOI] [PMC free article] [PubMed] [Google Scholar]
- Gunji A, Hoshiyama M, Kakigi R. Auditory response following vocalization: a magnetoencephalographic study. Clin Neurophysiol 112: 514–520, 2001 [DOI] [PubMed] [Google Scholar]
- Hackett TA, Stepniewska I, Kaas JH. Prefrontal connections of the parabelt auditory cortex in macaque monkeys. Brain Res 817: 45–58, 1999 [DOI] [PubMed] [Google Scholar]
- Hashimoto Y, Sakai KL. Brain activations during conscious self-monitoring of speech production with delayed auditory feedback: an fMRI study. Hum Brain Mapp 20: 22–28, 2003 [DOI] [PMC free article] [PubMed] [Google Scholar]
- Heinks-Maldonado TH, Mathalon DH, Gray M, Ford JM. Fine-tuning of auditory cortex during speech production. Psychophysiology 42: 180–190, 2005 [DOI] [PubMed] [Google Scholar]
- Heinks-Maldonado TH, Nagarajan SS, Houde JF. Magnetoencephalographic evidence for a precise forward model in speech production. Neuroreport 17: 1375–1379, 2006 [DOI] [PMC free article] [PubMed] [Google Scholar]
- Houde JF, Jordan MI. Sensorimotor adaptation in speech production. Science 279: 1213–1216, 1998 [DOI] [PubMed] [Google Scholar]
- Houde JF, Nagarajan SS, Sekihara K, Merzenich MM. Modulation of the auditory cortex during speech: an MEG study. J Cogn Neurosci 14: 1125–1138, 2002 [DOI] [PubMed] [Google Scholar]
- Houde JF, Nagarajan SS. Speech production as state feedback control. Front Hum Neurosci 5: 82, 2011 [DOI] [PMC free article] [PubMed] [Google Scholar]
- Hromadka T, Deweese MR, Zador AM. Sparse representation of sounds in the unanesthetized auditory cortex. PLoS Biol 6: e16, 2008 [DOI] [PMC free article] [PubMed] [Google Scholar]
- Lane H, Tranel B. The Lombard sign and the role of hearing in speech. J Speech Hear Res 14: 677–709, 1971 [Google Scholar]
- Lee BS. Effects of delayed speech feedback. J Acoust Soc Am 22: 824–826, 1950 [Google Scholar]
- Leonardo A, Konishi M. Decrystallization of adult birdsong by perturbation of auditory feedback. Nature 399: 466–470, 1999 [DOI] [PubMed] [Google Scholar]
- Levelt WJ. Monitoring and self-repair in speech. Cognition 14: 41–104, 1983 [DOI] [PubMed] [Google Scholar]
- Lombard E. Le signe de l'elevation de la voix. Ann Maladies Oreille Larynx 37: 101–119, 1911 [Google Scholar]
- Lu T, Liang L, Wang X. Neural representations of temporally asymmetric stimuli in the auditory cortex of awake primates. J Neurophysiol 85: 2364–2380, 2001 [DOI] [PubMed] [Google Scholar]
- Miller CT, Dimauro A, Pistorio A, Hendry S, Wang X. Vocalization induced cFos expression in marmoset cortex. Front Integr Neurosci 4: 128, 2010 [DOI] [PMC free article] [PubMed] [Google Scholar]
- Miller CT, Wang X. Sensory-motor interactions modulate a primate vocal behavior: antiphonal calling in common marmosets. J Comp Physiol A Neuroethol Sens Neural Behav Physiol 192: 27–38, 2006 [DOI] [PubMed] [Google Scholar]
- Müller-Preuss P, Ploog D. Inhibition of auditory cortical neurons during phonation. Brain Res 215: 61–76, 1981 [DOI] [PubMed] [Google Scholar]
- Newman JD, Wollberg Z. Multiple coding of species-specific vocalizations in the auditory cortex of squirrel monkeys. Brain Res 54: 287–304, 1973 [DOI] [PubMed] [Google Scholar]
- Numminen J, Curio G. Differential effects of overt, covert and replayed speech on vowel-evoked responses of the human auditory cortex. Neurosci Lett 272: 29–32, 1999 [DOI] [PubMed] [Google Scholar]
- Numminen J, Salmelin R, Hari R. Subject's own speech reduces reactivity of the human auditory cortex. Neurosci Lett 265: 119–122, 1999 [DOI] [PubMed] [Google Scholar]
- Olshausen BA, Field DJ. Sparse coding of sensory inputs. Curr Opin Neurobiol 14: 481–487, 2004 [DOI] [PubMed] [Google Scholar]
- Paus T, Perry DW, Zatorre RJ, Worsley KJ, Evans AC. Modulation of cerebral blood flow in the human auditory cortex during speech: role of motor-to-sensory discharges. Eur J Neurosci 8: 2236–2246, 1996 [DOI] [PubMed] [Google Scholar]
- Pistorio AL, Vintch B, Wang X. Acoustic analysis of vocal development in a New World primate, the common marmoset (Callithrix jacchus). J Acoust Soc Am 120: 1655–1670, 2006 [DOI] [PubMed] [Google Scholar]
- Rauschecker JP, Tian B, Hauser M. Processing of complex sounds in the macaque nonprimary auditory cortex. Science 268: 111–114, 1995 [DOI] [PubMed] [Google Scholar]
- Romanski LM, Bates JF, Goldman-Rakic PS. Auditory belt and parabelt projections to the prefrontal cortex in the rhesus monkey. J Comp Neurol 403: 141–157, 1999 [DOI] [PubMed] [Google Scholar]
- Romanski LM, Tian B, Fritz J, Mishkin M, Goldman-Rakic PS, Rauschecker JP. Dual streams of auditory afferents target multiple domains in the primate prefrontal cortex. Nat Neurosci 2: 1131–1136, 1999 [DOI] [PMC free article] [PubMed] [Google Scholar]
- Sadagopan S, Wang X. Level invariant representation of sounds by populations of neurons in primary auditory cortex. J Neurosci 28: 3415–3426, 2008 [DOI] [PMC free article] [PubMed] [Google Scholar]
- Schuller G, Beuter K, Schnitzler HU. Response to frequency shifted artificial echoes in the bat Rhinolophus ferrumequinum. J Comp Physiol 89: 275–286, 1974 [Google Scholar]
- Sinnott JM, Stebbins WC, Moody DB. Regulation of voice amplitude by the monkey. J Acoust Soc Am 58: 412–414, 1975 [DOI] [PubMed] [Google Scholar]
- Sperry RW. Neural basis of the spontaneous optokinetic responses produced by visual inversion. J Comp Physiol Psychol 43: 482–489, 1950 [DOI] [PubMed] [Google Scholar]
- Symmes D. On the use of natural stimuli in neurophysiological studies of audition. Hear Res 4: 203–214, 1981 [DOI] [PubMed] [Google Scholar]
- Tian B, Reser D, Durham A, Kustov A, Rauschecker JP. Functional specialization in rhesus monkey auditory cortex. Science 292: 290–293, 2001 [DOI] [PubMed] [Google Scholar]
- Wang X, Lu T, Snider RK, Liang L. Sustained firing in auditory cortex evoked by preferred stimuli. Nature 435: 341–346, 2005 [DOI] [PubMed] [Google Scholar]
- Wise RJ, Greene J, Buchel C, Scott SK. Brain regions involved in articulation. Lancet 353: 1057–1061, 1999 [DOI] [PubMed] [Google Scholar]