Abstract
Monitoring trends in adolescent alcohol use over time is important for planning, allocation of resources, and evaluation of alcohol prevention and treatment programs. This article is an update of previously reported trends in adolescent alcohol use in the State of Hawai‘i utilizing data from the Centers for Disease Control and Prevention's Youth Risk Behavior Survey. Five alcohol use indicators were investigated between 2005 and 2011 including lifetime use, onset age, current use, binge drinking, and drinking on school property. Youth in Hawai‘i generally reported worse alcohol behaviors in 2009 compared to 2007 but better alcohol use behaviors were observed in 2011 compared to 2009. This trend was not observed on the national level and thus may represent changes unique to Hawai‘i. These apparent changes in alcohol use among adolescents highlight the need for resources and for continued surveillance.
Introduction
There are many negative effects of early onset drinking in adolescence including an increased likelihood of having problems in school, becoming involved in crimes, sustaining injuries, being in a motor vehicle crash, and death.1–8 In addition, adolescent drinking is associated with an increased probability of problem drinking later in life. Early onset drinking before age 15 increases the risk of alcohol dependence by four times compared to those who delayed drinking until at least age 21.9 The US Surgeon General has declared alcohol as the preferred substance used among adolescents, exceeding tobacco or illicit drugs.10 In 2011, the prevalence of 30 day alcohol use among adolescents in Hawai‘i was lower compared to youth in the United States (29.1% vs 38.7%, respectively).11 In addition, the prevalence of youth binge drinking, defined for youth as having 5 or more drinks on a single occasion, in the past 30 days was lower in 2011 among Hawai‘i's youth compared to the United States (15.4% vs 21.9%, respectively). However, the prevalence of binge drinking among adults in Hawai‘i in 2009 was higher compared to adults in the United States (21.5% vs 18.3%, respectively).12
The Healthy People 2020 objectives include goals of increasing the proportion of adolescents never using substances, including alcohol, tobacco, and other illicit drugs, increasing the proportion of students who disapprove of and perceive great risk in using substances, decreasing the proportion of adolescents engaging in binge drinking, and decreasing the number of deaths attributable to alcohol.13 Therefore, it is important to understand the trends in alcohol use among adolescents in order to tailor and evaluate alcohol prevention programs. The Youth Risk Behavior Surveillance System (YRBSS) monitors health risk behaviors among adolescents in the United States. The YRBSS focuses on six types of risk behaviors contributing to morbidity and mortality among adolescents including violence and injury causing behaviors, tobacco use, physical inactivity, unhealthy dietary behaviors, sexual behaviors, and alcohol and other drug use. The YRBSS data is collected from schools around the United States in local, state, and national surveys. This data can be used in many ways to track the health behaviors of adolescents, including alcohol use, to identify new trends in risk behaviors and to monitor progress of prevention programs.14
Alcohol use among adolescents in the State of Hawai‘i has been previously investigated using data from the Hawai‘i State Youth Risk Behavior Survey (YRBS) from 1993 to 2007.15 Trends were examined for five alcohol use indicators including lifetime use, onset age, current or recent use, binge drinking, and drinking on school property for Hawai‘i adolescents in the 9th through 12th grade. Decreasing trends in all alcohol use indicators over time were revealed for all grade levels except the 12th grade. Significant overall decreasing trends were observed for “ever having tried alcohol” as well as for “having one's first drink of alcohol before the age of 13.” Among 9th graders, the prevalence of binge drinking, drinking in the past 30 days prior to the survey, and drinking on school property also significantly decreased from 1993 and 2007. There were no significant decreases in the prevalence of any of the five alcohol use indicators among students in the 12th grade. In contrast, a significant increase in drinking on school property between 1993 and 2007 was reported among 12th graders in Hawai‘i. These results indicate a positive change in alcohol use behaviors among the majority of Hawai‘i's youth between 1993 and 2007 and suggest that alcohol prevention efforts may have been largely successful, especially among younger youth.
Continuous monitoring of adolescent alcohol use is important to understand trends and improve prevention programs. There have been previously reported observed changes over time in adolescent alcohol use in Hawai‘i. These observed changes highlight the need for continued surveillance and analysis of adolescent alcohol use. This article presents recent data from 2009 and 2011 as an update to the previously reported trends. This data is valuable for the continued tracking of adolescent alcohol use in Hawai‘i.
Methods
Data Collection
The YRBS is a biennial, nationwide survey of adolescents, grades 9–12, administered by the Centers for Disease Control and Prevention (CDC) as part of the YRBSS. The self-reported survey has been administered in public schools in Hawai‘i since 1991. The YRBS measures the prevalence of a variety of risk factors, including alcohol use and factors relating to alcohol use. A comprehensive description of YRBS procedures is reported elsewhere.16 Data were collected for the YRBS in Hawai‘i among public school students in 2005 (N = 1,662), 2007 (N = 1,191), 2009 (N = 1,511), and 2011 (N = 4,329).17 The response rates (number of surveys returned) were at least 60% for each year, which is a CDC requirement for the data to be weighted. The national YRBS was collected among public and private school students in 2005 (N = 13,917), 2007 (N = 14,041), 2009 (N = 16,410) and 2011 (N = 15,425).18
Measures
The questions used across 2005, 2007, 2009, and 2011 were: (1) During your life, on how many days have you had at least one drink of alcohol, other than a few sips?; (2) How old were you when you had your first drink of alcohol other than a few sips?; (3) During the past 30 days, on how many days did you have at least one drink of alcohol?; (4) During the past 30 days, on how many days did you have at least five or more alcoholic drinks in a row?; and, (5) During the past 30 days, on how many days did you have at least one drink of alcohol on school property? Responses to the five questions were used to create outcome variables as follows:
Lifetime use: those who have had at least one drink of alcohol on at least one day during their life versus those who have not; Onset age: those who had their first drink of alcohol before age 13 versus those who had their first drink at age 13 or later;
Current use: those who had at least one drink of alcohol on at least one day during the 30 days before the survey versus those who had not drunk during the previous 30 days.
Binge drinking: those who had five or more drinks of alcohol in a row, that is, within a couple of hours, on at least one day during the 30 days before the survey versus those who had not.
Drinking on school property: those who drank at least one drink of alcohol on school property on at least one day during the 30 days before the survey versus those who had not.
Data Analysis
The YRBS website, Youth Online, supported by the Division of Adolescent and School Health at the CDC, offers an online interactive analysis tool of survey results stratified by region, survey year, and demographic characteristics.19 For analysis, this interactive tool was used to compare results from all four survey years in Hawai‘i and to compare Hawai‘i results to national data. Data was stratified by grade level and sex, and comparisons were made for the time period from 2005 to 2011. Comparisons were also made by ethnicity, using YRBS data from the Hawai‘i Health Data Warehouse.17 Data on alcohol behaviors from the 2005, 2007, 2009, and 2011 surveys were compared in order to determine trends over time for the state of Hawai‘i. Confidence intervals were compared to determine statistically significant changes. Institutional review board approval was granted by the University of Hawai‘i at Manoa.
Results
Hawai‘i State and National Trends (Table 1)
Table 1.
State of Hawai‘i and National Trends
| Hawai‘i | ||||
| Percentage (95% CI) | ||||
| Indicator | 2005 | 2007 | 2009 | 2011 |
| Ever Drank | 64.8† (60.2–69.0) | 58.7† (52.6–64.6) | 68.6* (65.3–73.3) | 55.8**† (52.6–59.1) |
| Drink Before Age 13 | 27.3 (23.7–31.3) | 21.0 (17.6–24.9) | 28.6*† (25.2–32.4) | 19.2** (18.0–20.5) |
| Current Drinker | 34.8† (30.8–38.9) | 29.1† (23.7–35.3) | 37.8 (32.0–44.0) | 29.1† (25.8–32.3) |
| Binge Drinking | 18.8† (15.6–22.4) | 14.9† (10.3–20.9) | 22.4 (18.2–27.3) | 15.4**† (13.6–17.1) |
| Drinking on School Property | 8.8 (7.0–10.9) | 6.0 (4.4–8.2) | 7.9† (5.6–11.0) | 5.0 (4.2–5.9) |
| United States | ||||
| Percentage (95% CI) | ||||
| Indicator | 2005 | 2007 | 2009 | 2011 |
| Ever Drank | 74.3 (71.0–77.4) | 75.0 (72.4–77.4) | 72.5 (70.6–74.3) | 70.8 (69.0–72.5) |
| Drink Before Age 13 | 25.6 (23.8–27.4) | 23.8 (21.9–25.7) | 21.1 (19.6–22.6) | 20.5 (19.2–21.8) |
| Current Drinker | 43.3 (40.5–46.1) | 44.7 (42.4–47.0) | 41.8 (40.2–43.4) | 38.7 (37.2–40.3) |
| Binge Drinking | 25.5 (23.3–27.9) | 26.0 (24.0–28.0) | 24.2 (22.6–25.9) | 21.9 (21.0–22.8) |
| Drinking on School Property | 4.3 (3.7–4.9) | 4.1 (3.5–4.8) | 4.5 (3.9–5.1) | 5.1 (4.5–5.8) |
Statistically significant change from 2007 to 2009.
Statistically significant change from 2009 to 2011.
Statistically significant difference between United States and Hawai‘i in sample year.
Overall, the prevalence of reported adolescent alcohol use in the State of Hawai‘i was significantly lower compared to the United States in 2005, 2007, and 2011 for lifetime alcohol use, current alcohol use, and binge drinking. However, the prevalence of having drunk before the age of 13 among adolescents in Hawai‘i was significantly higher compared to the United States in 2009 (28.6% and 21.1%, respectively). In addition, the prevalence of drinking on school property was significantly higher in Hawai‘i compared to the United States in 2005 and 2009 (8.8% and 7.9%, versus 4.3% and 4.5%, respectively). The prevalence of lifetime alcohol use and drinking before the age of 13 among Hawai‘i's adolescents increased in 2009 compared to 2007 but then decreased in 2011. The prevalence of binge drinking among youth also decreased from 2009 to 2011 in the state of Hawai‘i (22.4% and 15.4%, respectively). These trends were not observed on the national level. The prevalence of alcohol use among United States adolescents remained fairly constant between 2005 and 2011 across all five alcohol use indicators.
Lifetime use (Figures 1A and 1B)
Figure 1 A.
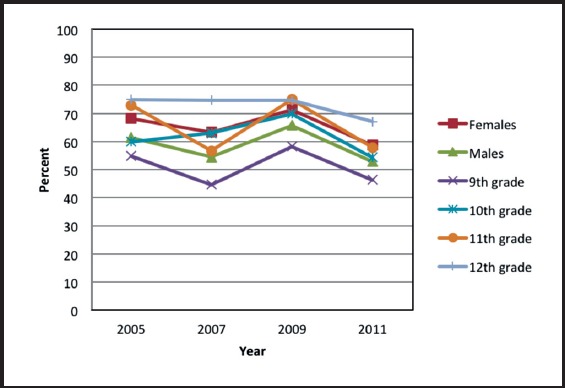
Lifetime Alcohol Use: Percentage of students reporting having at least one drink of alcohol in their life by gender and grade level.
Figure 1 B.
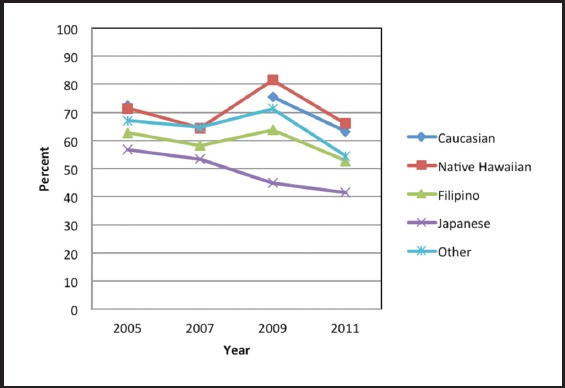
Lifetime Alcohol Use: Percentage of students reporting having at least one drink of alcohol in their life by ethnicity.
*Note on tables: Missing data points indicate un-reportable prevalence measure.
The overall decreasing trend of lifetime alcohol use appeared to reverse in 2009 among both males and females and students in the 9th and 11th grades. However, in 2011, the apparent increase in lifetime alcohol use was no longer observed among Hawai‘i's adolescents. The lifetime prevalence of alcohol use was significantly lower in 2011 compared to 2009 among both males (65.9% and 53.0%, respectively) and females (71.5% and 58.7%, respectively) and students in the 10th and 11th grades. Among students in the 12th grade, the lifetime prevalence of alcohol use remained fairly constant from 2005 to 2011.
The lifetime prevalence of alcohol use among adolescents in Hawai‘i showed a similar trend from 2005 to 2011 among the different ethnicity groups except for Japanese. The prevalence of alcohol use was significantly higher in 2009 compared to 2007 for students reporting Native Hawaiian ethnicity (64.4% and 81.6%, respectively). However, the prevalence of lifetime alcohol use decreased from 2009 to 2011 for Native Hawaiian, Caucasian, and “Other” youth. Among students reporting Japanese ethnicity, the prevalence of lifetime alcohol appeared to follow a decreasing trend from 2005 to 2011.
Onset age (Figures 2A and 2B)
Figure 2 A.
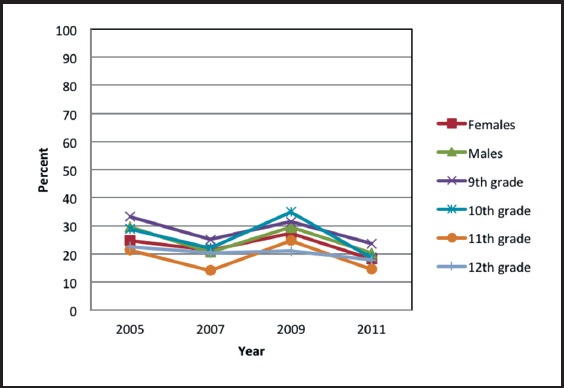
Onset Age: Percentage of students reporting ever drinking alcohol before age 13 by gender and grade level.
Figure 2 B.
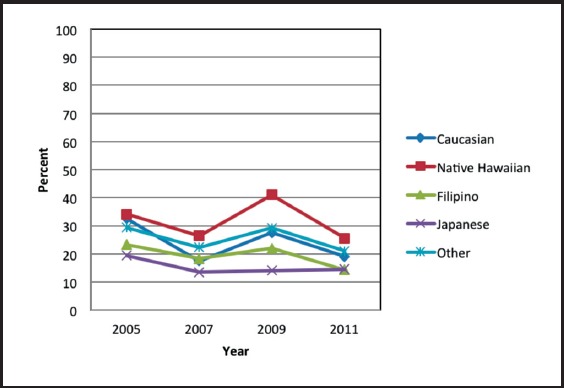
Onset Age: Percentage of students reporting ever drinking alcohol before age 13 by ethnicity.
The proportion of students who reported their first drink of alcohol before age 13 appeared to increase from 2007 to 2009 after an apparent decrease from 2005 to 2007 among both males and females and among all grade levels except the 12th grade. However, in 2011, this apparent increase was no longer observed. In 2011, the proportion of students reporting their first drink of alcohol before age 13 was significantly lower compared to 2009 among males (20.3% and 29.4%, respectively) and females (18.2% and 27.6%, respectively) and among students in the 10th and 11th grades. Among students in the 12th grade, the proportion of students reporting having their first drink of alcohol before age 13 remained fairly constant.
A similar trend was observed in the proportion of students who reported their first drink of alcohol before age 13 among all ethnicities except for Japanese. The proportion of students who reported drinking before the age of 13 was higher in 2009 compared to 2011 among students reporting Native Hawaiian and “Other” ethnicities. Among Japanese youth, the proportion of students who reported their first drink of alcohol before the age of 13 remained fairly constant in 2007, 2009, and 2011 (13.5%, 14.1%, and 14.6%, respectively). Students reporting Native Hawaiian ethnicity had the highest proportion of reported drinkers before the age of 13 from 2005 to 2011 among all ethnicities (34.1%, 26.5%, 41.1%, and 25.6%, respectively).
Current use (Figures 3A and 3B)
Figure 3 A.
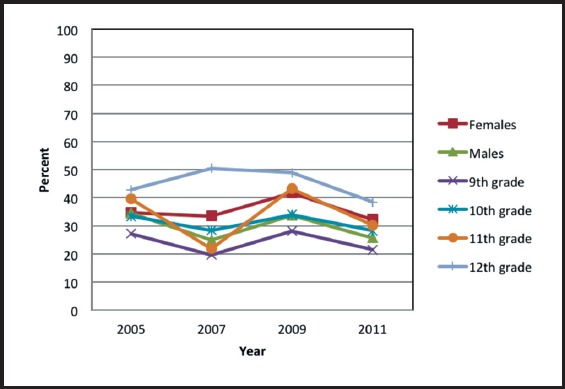
Current Alcohol Use: Percentage of students reporting having at least one drink of alcohol in the 30 days before the survey by gender and grade level.
Figure 3 B.
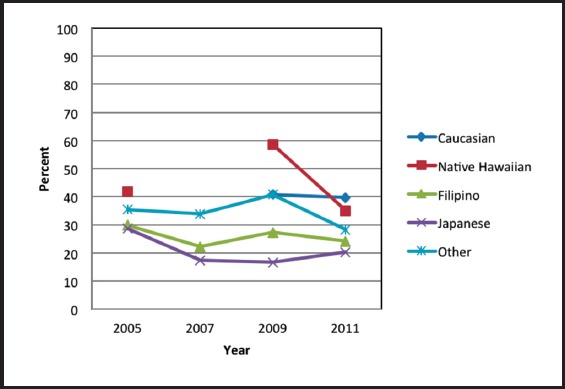
Current Alcohol Use: Percentage of students reporting having at least one drink of alcohol in the 30 days before the survey by ethnicity.
No trend line is drawn for Caucasian and Native Hawaiian ethnicities due to unreportable data in 2007. Data point for Caucasian in 2005 is underneath Native Hawaiian data point.
The prevalence of current alcohol use appeared to increase from 2007 to 2009 after an apparent decrease from 2005 to 2007 among both males and females and students in the 9th, 10th, and 11th grades. However, in 2011, this increase appeared to be reversed among Hawai‘i's youth. Among 11th graders, there was a significant decrease in the prevalence of current alcohol use from 2005 to 2007 (39.5% and 21.8%, respectively) followed by a significant increase in the prevalence of current alcohol use from 2007 to 2009 (21.8% and 43.3%, respectively). Students in the 12th grade reported fairly constant current alcohol use in 2007 and 2009 (50.5% and 48.9%, respectively).
The prevalence of current alcohol use was significantly lower in 2011 compared to 2009 among students reporting Native Hawaiian and “Other” ethnicities. In contrast, students reporting Caucasian ethnicity had a fairly constant prevalence of current alcohol use in 2005, 2009, and 2011 (41.7%, 40.8%, and 39.6%, respectively) with no data reported in 2007. Students reporting Japanese ethnicity had an apparent decrease in the prevalence of current alcohol use from 2005 to 2007 (28.6% and 17.3%, respectively) and a fairly constant prevalence of current alcohol use in from 2007 to 2011.
Binge drinking (Figures 4A and 4B)
Figure 4 A.
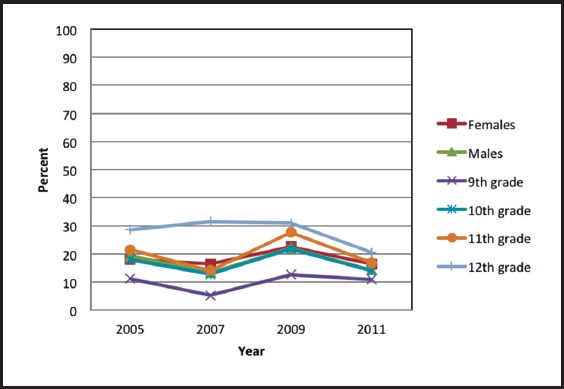
Binge Drinking: Percentage of students reporting having five or more alcoholic drinks in a row on at least one day in the 30 days before the survey by gender and grade level.
Figure 4 B.
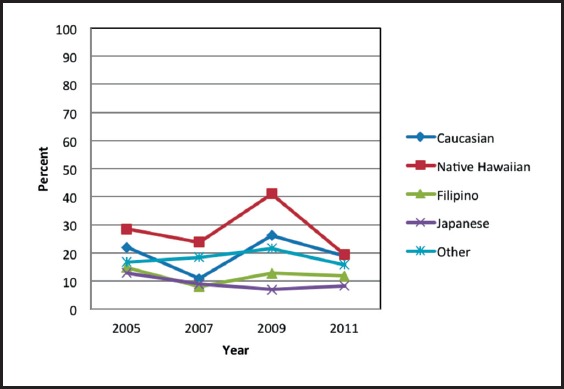
Binge Drinking: Percentage of students reporting having five or more alcoholic drinks in a row on at least one day in the 30 days before the survey by ethnicity.
Among Hawai‘i's adolescents, the prevalence of binge drinking followed a similar trend among both males and females and students in the 9th through 11th grade. The overall decreasing trend appeared to reverse in 2009 among all students except those in the 12th grade. However, this apparent increase was only observed in 2009. The prevalence of binge drinking significantly decreased in 2011 compared to 2009 among males (22.2% and 14.3%, respectively). Students in the 12th grade reported a fairly constant prevalence of binge drinking in 2005, 2007, and 2009 with an apparent decrease in binge drinking prevalence in 2011 (28.6%, 31.6%, 30.9%, and 20.5%, respectively).
A similar trend in the prevalence of binge drinking was reported among Native Hawaiian, Caucasian, and Filipino youth. An apparent increase in binge drinking prevalence was observed among all ethnicities except Japanese in 2009. In 2011, this apparent increase was no longer observed. Among students reporting Native Hawaiian ethnicity, the prevalence of binge drinking was significantly lower in 2011 compared to 2009 (19.5% and 41.1%, respectively). A fairly constant prevalence of binge drinking in 2007, 2009, and 2011 was seen for students reporting Japanese ethnicity (8.9%, 6.9%, and 8.2%, respectively). An overall increasing trend was observed among students reporting “Other” ethnicity from 2005 to 2009.
Drinking on school property (Figures 5A and 5B)
Figure 5 A.
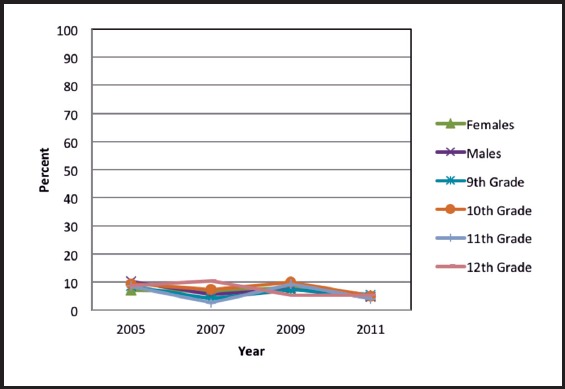
Drinking on School Property: Percentage of students reporting having at least one drink of alcohol on school property in the 30 days before the survey by gender and grade level.
Figure 5 B.
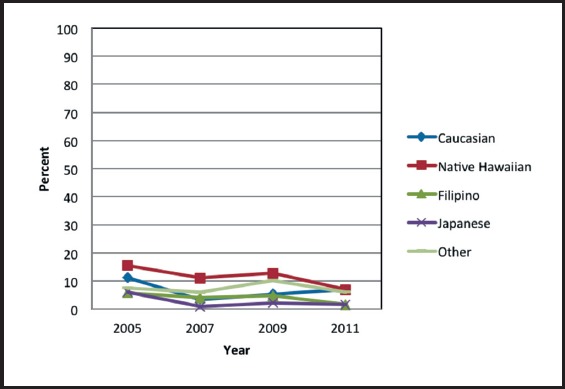
Drinking on School Property: Percentage of students reporting having at least one drink of alcohol on school property in the 30 days before the survey by ethnicity.
A similar trend in the prevalence of drinking on school property was observed among Hawai‘i's adolescents except those in the 12th grade. An apparent increase in the prevalence of drinking on school property from 2007 to 2009 was observed among both males and females and students in the 9th through 11th grades. However, this apparent increase was not observed in 2011. Among students in the 11th grade, the prevalence of drinking on school property increased significantly from 2007 to 2009 (2.6% and 9.3%. respectively). However, in 2011, the prevalence of drinking on school property decreased significantly among students in the 11th grade. Among students in the 12th grade, an opposite trend was observed with an apparent decrease in the prevalence of drinking on school property in 2009 compared to 2007 (5.2% and 10.5%, respectively).
A similar trend in the prevalence of drinking on school property was observed among all ethnicities except Caucasian. The prevalence of drinking on school property appeared to increase in 2009 compared to 2007 among all ethnicities. In 2011, the prevalence of drinking on school property appeared to decrease among Native Hawaiian, Filipino, Japanese, and “Other” ethnicities. In contrast, the prevalence of drinking on school property appeared to have an increasing trend in 2007, 2009, and 2011 among Caucasian youth (3.4%, 5.3%, and 6.9%, respectively). Students reporting Native Hawaiian ethnicity had the highest prevalence of drinking on school property (15.5%, 11.1%, 12.8%, and 6.8%, respectively).
Discussion
Hawai‘i State and National Drinking Prevalence
Overall, adolescents in Hawai‘i tend to report better alcohol use behaviors compared to the US youth except for drinking before the age of 13 and drinking on school property. A possible reason for this may be the open architecture of Hawai‘i schools, the shared use of public school and public park facilities, and the common access to school grounds for recreational purposes outside of regular school hours in Hawai‘i. This may blur the lines between school and public property which may not be the case on the mainland where access to facilities may be more closely regulated. Compared to US youth, adolescents in Hawai‘i fared worse for drinking before the age of 13 in 2009 and for drinking on school property in 2005 and 2009. However, in 2005, 2007, and 2011, Hawai‘i's youth were less likely to report ever drinking, current drinking, and binge drinking. There are many possible contributing factors to the observed changes between Hawai‘i and the United States including ethnic and cultural differences and local environment. Differences in adolescent alcohol consumption behaviors have been observed in ethnic and culturally diverse areas.20 Asian youth tend to report fewer alcohol consumption behaviors compared to Pacific Islander and White youth. The complex and diverse ethnic and cultural makeup of Hawai‘i's youth may contribute to the observed dissimilarities in alcohol use between Hawai‘i and the United States However, the exact reasons for the differences in specific alcohol use indicators between Hawai‘i and the United States is unknown.
In 2009, students in Hawai‘i were more likely to report ever drinking and drinking before the age of 13 compared to 2007. However, in 2011, Hawai‘i's youth were less likely to report ever drinking, drinking before the age of 13, and binge drinking compared to 2009. These trends were not observed on the national level. In the United States, the prevalence of alcohol use remained fairly constant between 2005 and 2011. The reasons why adolescents in Hawai‘i reported worse underage drinking behaviors in 2009 compared to 2007 are not clear. There are numerous possible reasons for this change, although none have been investigated. In 2007, the United States experienced an economic downturn which may have affected drinking patterns.21 It has been shown that alcohol consumption is positively associated with various life stresses, including job loss or economic struggles.22 However, the whole nation endured economic downturn in 2007, but the upward trend in adolescent drinking prevalence was only seen for Hawai‘i and not at the national level. Economic downturn may also affect funding for prevention programs. Decreased funding for prevention programs may result in higher drinking risk behaviors among adolescents. One source of funding for underage drinking prevention in Hawai‘i in 2007 was the Strategic Prevention Framework-State Incentive Grant. However, many programs were in the beginning stages of implementation and their impact on underage drinking may not be seen right away. The recent improvement in the economy, and the progression of prevention programs, may have influenced the better underage drinking behaviors observed in 2011. The YRBS survey is revised before each data collection period to represent the current interests and needs of the nation and of each participating region. Revision, addition or deletion of survey questions may influence the ability to track trends in risk behaviors over time. However, the reported alcohol use indicator survey questions have been consistently asked in each survey period from 2005 to 2011. In addition, sampling and data collection methods for the YRBS are consistent over the survey periods. Thus any changes in the YRBS questionnaire should not affect the reported adolescent alcohol use trends.17
Trends in Prevalence of Drinking
Similar trends in drinking behaviors were observed among both males and females and among students in the 9th through 11th grades. A decreasing trend in alcohol use behaviors among Hawai‘i's adolescents from 1997 to 2007 has been previously reported.15 This decreasing trend appeared to be reversed in 2009 in most alcohol use indicators among males and females and students in the 9th through 11th grades. However, this apparent increase in alcohol use was only observed for one assessment period and was not observed in 2011. Students tended to report better alcohol use behaviors in 2011 compared to 2009. Previously mentioned factors such as changes in the economy and underage drinking prevention programs may have influenced these trends in adolescent alcohol use in Hawai‘i.
Students in the 12th grade generally reported more consistent levels of alcohol use between 2005 and 2011 compared to students in the 9th through 11th grades. These results suggest that older adolescents (12th grade) may react differently compared to younger adolescents (9th – 11th grade) with respect to alcohol use trends over time. In regards to ethnicity, similar trends in drinking behaviors were generally observed for all ethnicities except for Japanese. Alcohol use behaviors among students reporting Japanese ethnicity generally improved between 2005 and 2011. Japanese students may have different alcohol use trends due to cultural and biological differences. A biological mechanism found in some persons of Asian ancestry causes flushing of the face with alcohol consumption. This trait may cause Asians to drink less than persons of other ethnicities.23, 24 Additionally, ethnic differences have been observed in family factors, including parental involvement and family structure, associated with alcohol use behaviors among Asian American youth.25
Strengths and Limitations
The YRBS is a large national, state, and metropolitan school district level survey which allows for tracking of the prevalence of youth risk behaviors over time. The data is useful to examine alcohol use among Hawai‘i's adolescents. This data allows for comparisons both within the State of Hawai‘i between ethnicities, grade levels, and genders, and also between state and national level data. Significant changes in prevalence measures can be examined through 95% confidence intervals provided by the CDC. However, sample sizes vary from year to year in YRBS data collection. Relatively smaller sample sizes in 2005, 2007 and 2009 compared to 2011 may have influenced the ability to detect significant differences within the apparent trends in adolescent drinking behaviors. In addition, the data from the YRBS relies on self- reporting of alcohol risk behaviors leading to possible over or under reporting. The data for Hawai‘i is collected only among public school students and is not generalizable to all adolescents in the state or in the United States. Students attending private school, who are home-schooled or who do not attend school, and who may have different alcohol risk behaviors than those attending public school are not included in data collection. Furthermore, small sample size among certain groups may lead to missing data values as the YRBS does not report subgroup findings if the sample size is less than 100 students.16
Recommendations
The data from the Hawai‘i State YRBS revealed that adolescent alcohol use varies over time. Thus, it is important to continue to monitor and track adolescent alcohol use behaviors. In addition, adolescent alcohol use trends in Hawai‘i were not comparable to US trends. It is especially important to continue to track alcohol use among youth in Hawai‘i. Further research is suggested to investigate the possible causes of the trends in adolescent alcohol behaviors. It is recommended that there be an ongoing effort to examine recent trends in adolescent alcohol use in Hawai‘i. This information is valuable in the planning and evaluation of alcohol prevention programs and for informing policy. Specifically, it is warranted to provide increased resources to adolescent alcohol prevention efforts in order to encourage better alcohol behaviors among Hawai‘i's adolescents.
Acknowledgement
Support for this manuscript made possible through funding from the Hawai'i SPF-SIG grant, Alcohol and Drug Abuse Division, State Department of Health.
Conflict of Interest
None of the authors report a conflict of interest.
References
- 1.Buchmann AF, Schmid B, Blomeyer D, et al. Impact of age at first drink on vulnerability to alcohol-related problems: Testing the marker hypothesis in a prospective study of young adults. Journal of Psychiatric Research. 2009;43(15):1205–1212. doi: 10.1016/j.jpsychires.2009.02.006. [DOI] [PubMed] [Google Scholar]
- 2.Grant BF, Dawson DA. Age at onset of alcohol use and its association with DSM-IV alcohol abuse and dependence: results from the National Longitudinal Alcohol Epidemiologic Survey. Journal of Substance Abuse. 1997;9:103–110. doi: 10.1016/s0899-3289(97)90009-2. [DOI] [PubMed] [Google Scholar]
- 3.Hawkins JD, Graham JW, Maguin E, Abbott R, Hill KG, Catalano RF. Exploring the effects of age of alcohol use initiation and psychosocial risk factors on subsequent alcohol misuse. Journal of Studies on Alcohol. 1997;58(3):280. doi: 10.15288/jsa.1997.58.280. [DOI] [PMC free article] [PubMed] [Google Scholar]
- 4.Hingson RW, Heeren T, Winter MR. Age at drinking onset and alcohol dependence: age at onset, duration, and severity. Archives of Pediatrics and Adolescent Medicine. 2006;160(7):739. doi: 10.1001/archpedi.160.7.739. [DOI] [PubMed] [Google Scholar]
- 5.Pitkanen T, Lyyra AL, Pulkkinen L. Age of onset of drinking and the use of alcohol in adulthood: a follow-up study from age 8–42 for females and males. Addiction. 2005;100(5):652–661. doi: 10.1111/j.1360-0443.2005.01053.x. [DOI] [PubMed] [Google Scholar]
- 6.Stueve A, O'Donnell LN. Early alcohol initiation and subsequent sexual and alcohol risk behaviors among urban youths. American Journal of Public Health. 2005;95(5):887. doi: 10.2105/AJPH.2003.026567. [DOI] [PMC free article] [PubMed] [Google Scholar]
- 7.Wells JE, Horwood LJ, Fergusson DM. Drinking patterns in mid-adolescence and psychosocial outcomes in late adolescence and early adulthood. Addiction. 2004;99(12):1529–1541. doi: 10.1111/j.1360-0443.2004.00918.x. [DOI] [PubMed] [Google Scholar]
- 8.York JL, Welte J, Hirsch J, Hoffman JH, Barnes G. Association of age at first drink with current alcohol drinking variables in a national general population sample. Alcoholism: Clinical and Experimental Research. 2004;28(9):1379–1387. doi: 10.1097/01.alc.0000139812.98173.a4. [DOI] [PubMed] [Google Scholar]
- 9.MacKay AP. Adolescent Health in the United States: Department for Health and Human Services, Centers for Disease Control and Prevention, National Center for Health Statistics. 2007. [Google Scholar]
- 10.U.S. Department of Health and Human Services, author. The Surgeon General's Call to Action to Prevent and Reduce Underage Drinking: A Guide to Action for Educators: U.S. Department of Health and Human Services, Office of the Surgeon General. 2007. [PubMed] [Google Scholar]
- 11.Centers for Disease Control and Prevention, author. Alcohol and Public Health. [January 2012]. http://www.cdc.gov/alcohol/index.htm.
- 12.Centers for Disease Control and Prevention, author. Chronic Disease Indicators. http://apps.nccd.cdc.gov/cdi/SearchResults.aspx?IndicatorIds=6,5,9,35,11,22,64,29,7,8,126&StateIds=46,12&StateNames=United%20States,Hawaii&FromPage=HomePage.
- 13.U.S. Department of Health and Human Services, author. Healthy People 2020 Summary of Objectives. [January 2012]. http://www.healthypeople.gov/2020/topicsobjectives2020/default.aspx.
- 14.Centers for Disease Control and Prevention, author. Adolescent and School Health. [March 2012]. http://www.cdc.gov/HealthyYouth/yrbs/index.htm.
- 15.Ta VM, Kittinger DS, Pham LA, Williams RJ, Eller LSN, Nigg CR. Trends in Alcohol Use among Hawai ‘i Adolescents. Hawaii Med J. 2010;69(7):167. [PMC free article] [PubMed] [Google Scholar]
- 16.Brener ND, Kann L, Kinchen SA, et al. Methodology of the youth risk behavior surveillance system. MMWR. Recommendations and Reports: Morbidity and Mortality Weekly Report. Recommendations and Reports/Centers for Disease Control. 2004;53(RR-12):1. [PubMed] [Google Scholar]
- 17.Hawaii Health Data Warehouse, author. YRBS Reports. [March 2012]. http://www.hhdw.org/cms/index.php?page=yrbss-reports.
- 18.Centers for Disease Control and Prevention, author. MMWR Surveillance Summaries. http://www.cdc.gov/healthyyouth/yrbs/publications.htm.
- 19.Centers for Disease Control and Prevention, author. Youth Online: Home Page. [March 2012]. http://apps.nccd.cdc.gov/yrbss/index.asp.
- 20.Wong MM, Klingle RS, Price RK. Alcohol, tobacco, and other drug use among Asian American and Pacific Islander adolescents in California and Hawaii. Addictive Behaviors. 2004;29(1):127–141. doi: 10.1016/s0306-4603(03)00079-0. [DOI] [PubMed] [Google Scholar]
- 21.Barrell R, Holland D. Fiscal and financial responses to the economic downturn. National Institute Economic Review. 2010;211(1):115–126. [Google Scholar]
- 22.Dee TS. Alcohol abuse and economic conditions: evidence from repeated cross-sections of individual level data. Health Economics. 2001;10(3):257–270. doi: 10.1002/hec.588. [DOI] [PubMed] [Google Scholar]
- 23.Johnson RC, Nagoshi CT. Asians, asian-americans and alcohol. Journal of Psychoactive Drugs. 1990;22(1):45–52. doi: 10.1080/02791072.1990.10472196. [DOI] [PubMed] [Google Scholar]
- 24.Tanaka F, Shiratori Y, Yokosuka O, Imazeki F, Tsukada Y, Omata M. Polymorphism of Alcohol-Metabolizing Genes Affects Drinking Behavior and Alcoholic Liver Disease in Japanese Men. Alcoholism: Clinical and Experimental Research. 1997;21(4):596–601. [PubMed] [Google Scholar]
- 25.Catalano RF, Morrison DM, Wells EA, Gillmore MR, Iritani B, Hawkins JD. Ethnic differences in family factors related to early drug initiation. Journal of Studies on Alcohol. 1992;53(3):208. doi: 10.15288/jsa.1992.53.208. [DOI] [PMC free article] [PubMed] [Google Scholar]


