Abstract
Background and Objective:
The incidence of coronary artery disease (CAD) is increasing in India. Recent data suggesting insulin resistance can predict cardiovascular disease independently of the other risk factors, such as hypertension, visceral obesity, or dyslipidemia, so a focus on the relation between acute coronary syndrome (ACS) and insulin resistance is relevant. Several studies addressing serum lipoprotein ratios as surrogates for insulin resistance have found promising results. We analyzed the association of lipoprotein ratios with the homeostatic model assessment of insulin resistance (HOMA-IR).
Methods:
One hundred non-diabetic patients with impaired fasting glucose admitted with a diagnosis of ACS were included in the study. Admission fasting glucose and insulin concentrations were measured. The HOMA-IR was used to calculate insulin resistance. The fasting serum total cholesterol (TC), triglycerides (TG), and high-density lipoprotein (HDL-C) levels are used to calculate following lipid ratios: TC/HDL-C and TG/HDL-C. The areas under the curves (AUC) of the receiver operating characteristic curves (ROC) were used to compare the power of these serum lipoprotein ratio markers.
Results:
Lipoprotein ratios were significantly higher in patients with HOMA Index >2 as compared to patients with Index <2. TG/HDL-C ratio and TC/HDL-C ratio were significantly correlated with HOMA-IR (P < 0.05) as obtained by Pearson's correlation analysis (r = 0.4459, P = 0.0012; r = 0.4815, P = 0.0004; r = 0.3993; P = 0.0041, respectively). The area under the ROC curve of the TG/HDL-C and TC/HDL-C ratios for predicting insulin resistance was 0.80 (95% CI, 0.67-0.93), 0.78 (95% CI, 0.65-0.91), respectively.
Conclusion:
A plasma TG/HDL-C ratio and TC/HDL-C ratio provide a simple means of identifying insulin resistant and can be used as the markers of insulin resistance and cardiovascular diseases risk in adult non-diabetic patients.
Keywords: Acute coronary syndrome, homeostatic model assessment of insulin resistance, insulin resistance, lipoprotein ratios
INTRODUCTION
The predilection of Indians to coronary artery disease (CAD) has been confirmed beyond doubt. Indian populations are more prone to develop CAD at a younger age. By the year 2015, India will have the largest CAD burden in the world. Recent data demonstrate that the condition of insulin resistance plays a primary role both in the pathogenesis of metabolic syndrome and in the prediction of cardiovascular events; thus, elevated fasting glucose and insulin resistance may be correlated positively with the incidence of cardiac events in patients with CAD, with or without a previous diagnosis of diabetes. Insulin resistance is defined as impaired sensitivity to the effects of insulin on whole body glucose utilization. Several studies have suggested that although insulin resistance is associated with traditional risk factors, it may influence independently the progression of coronary atherosclerotic plaques in asymptomatic patients, also in virtue of the correlation with the endothelial dysfunction. The syndrome of insulin resistance appears to be a significant risk factor for coronary events. Plasma triglycerides (TG), high-density lipoprotein (HDL-C), and total cholesterol (TC) are independently associated with insulin resistance, insulin level, and are independent predictors of cardiovascular disease (CVD). The availability of relatively simple measures to identify apparently healthy people who are sufficiently insulin resistant to be at increased risk of developing type 2 diabetes, cardiovascular disease, and the numerous other clinical syndromes that occur with increased frequency in insulin-resistant persons would be of significant clinical benefit.
We investigated the possibility to use the ratios of the levels of TG/HDL-C and TC/HDL-C as surrogates for the estimation of insulin levels and insulin resistance in non-diabetic ACS patients. We also address the issue of considering serum lipoprotein ratios as markers for the identification of individuals with insulin resistance and at increased risk for cardiovascular diseases.
MATERIALS AND METHODS
One hundred patients admitted to the department of cardiology at Medical College, Kolkata with a diagnosis of acute coronary syndromes (ACSs) (ST elevation acute myocardial infarction or unstable angina/non-ST elevation myocardial infarction) without any history of previous diabetes mellitus were taken in this study. The study was done for 1 year from April 2010 to March 2011. Eligibility criteria were clinical history of ACS accompanied by at least one of the following: electrocardiographic changes consistent with ACSs, serial increases in biochemical markers of cardiac necrosis (creatine kinase MB, creatine phosphokinase, or troponin T). Fasting blood samples were collected for the analysis of all routine investigations including blood sugar, serum insulin levels, lipid profiles, and hsCRP levels. Patients with fasting blood sugar level between 100 and 126 mg/dl were included in the study. All participants who had a positive history of diabetes or currently had a fasting glucose concentration ≥126 mg/dl were excluded. For the various laboratory parameters, the following methods were used:
Blood sugar was estimated by GOD/POD method. TG was estimated by photometric technology using glucose oxidase-peroxidase method. HDL-C was measured by polyethylene glycol (PEG) precipitation method. TC/HDL-C ratio was calculated by dividing TC by HDL-C and TG/HDL-C ratio was calculated by dividing TG by HDL-C. A TG/HDL-C ratio of >3.5 and a TC/HDL-C ratio >4.5 were used as cut-off points to identify patients with insulin resistance. Serum fasting insulin levels were measured on fasting samples of serum by Monobind Insulin Microplate ELISA test. It is an immunoenzymometric assay and is intended to be used for quantitative determination of insulin levels in human serum. The assay sensitivity was found to be 0.75 μIU/mL. As per the system guidelines, the normal insulin value for non-diabetic adult is 0.7-9 μIU/mL. Insulin resistance by this method is defined as fasting insulin concentration of >9 μIU/mL. Although proinsulin cross react with most competitive insulin assays, there is less than 1% cross reaction found with proinsulin using Monobind Insulin Microplate ELISA. From these variables, a simple index of insulin resistance, i.e., homeostatic model assessment-insulin resistance (HOMA-IR) was calculated as:

where I0 is fasting insulin level and G0 is fasting glucose level and 405 is a constant.
HOMA index is defined according to the Matthews’ formula[1]: fasting insulin (μIU/mL) × fasting glucose (mmol/L)/22.5. Hemolyzed blood samples were excluded because of the presence of inactivating insulin enzymes.
Patients with HOMA-IR >2 were defined as having insulin resistance. Subjects with HOMA-IR <2 were defined as insulin sensitive group. The categorical variables are expressed as number of patients and compared across groups using Chi-Square test for independence of attributes. Continuous variables have been expressed as mean ± standard deviation compared across the two groups using unpaired t-test. Pearson's correlation coefficient was used to capture the extent of linear association between continuous variables. The area under the receiver-operating characteristic (ROC) curve was used to examine the predictive value of TG/HDL-C and TC/HDL-C ratios for insulin resistance (HOMA >2). Values for the area under the ROC curve of 0.5, ≥0.7 but <0.8, ≥0.8 but <0.9, and ≥0.9 have been suggested as reflecting the following levels of discrimination: none, acceptable, excellent, and outstanding. The statistical software SPSS version 16 has been used for the analysis. An alpha level of 5% has been taken, i.e., if any P value is less than 0.05 it has been considered significant.
RESULTS AND ANALYSIS
In this study, we observed 100 patients with ACS. Out of 100 patients with ACSs, 70 patients had STEMI and 30 had UA/NSTEMI. There were 78 male patients and 22 female patients in our study population. The mean age of our population was 56.3 ± 9.95 years. The mean age of male and female patients was 56 ± 9.84 and 57.39 ± 10.24, respectively.
Admission blood sugar and insulin concentrations were available for 50 patients admitted with chest pain who were non-diabetic and had an admission glucose concentration between 100 and 126 mg/dl.
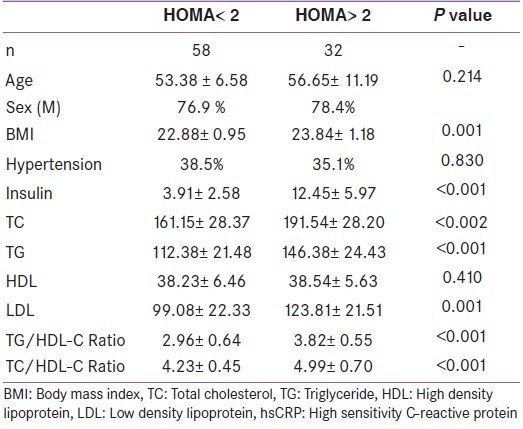
By the criteria defined above, the index admission was retrospectively classified into two cohorts, HOMA-IR >2 (n = 32 patients) and HOMA-IR <2 (n = 58 patients). The baseline demographic variables for these cohorts shown in Table 1.
Table 1.
Baseline demographic variables

The relationship between the lipid ratios and the surrogate measure of insulin resistance (HOMA) was assessed within the two groups: Elevated HOMA and low HOMA (HOMA <2). Lipid ratios were significantly higher in individuals with HOMA >2 as compared to subjects with HOMA <2, which represents the control group (P = <0.001).
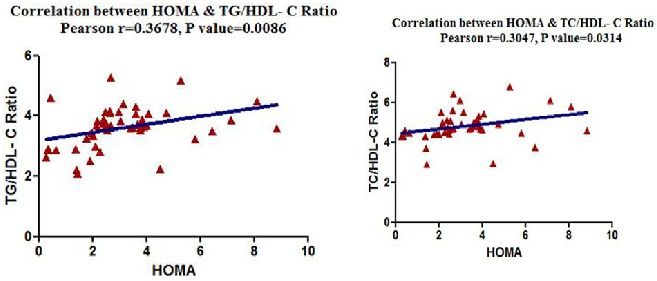
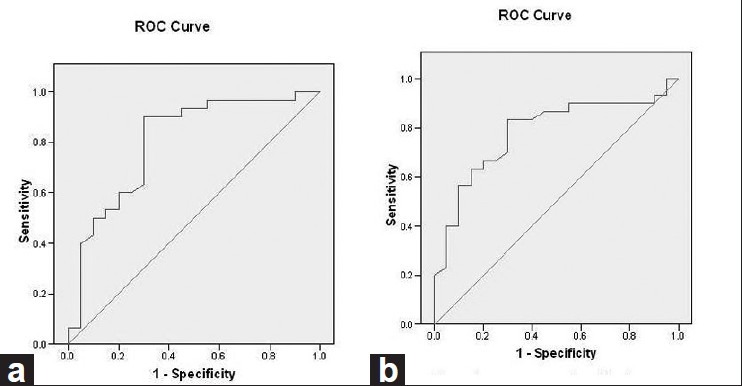
When Pearson's correlation coefficient was used to capture the extent of linear association between HOMA and other possible marker of IR like lipid ratios, both the lipid ratios (TG/HDL-C and TC/HDL-C) showed significant positive correlation with HOMA-IR [Figure 1]. Significant correlation was also observed between fasting insulin and TG/HDL-C ratio (r = 0.35, P = 0.01). BMI showed positive correlation both with HOMA-IR (r = 0.12, P = 0.412) and TG/HDL-C ratio (r = 0.34, P = 0.01). The correlation was noted to be significant in the latter. The areas under the curves (AUC) of the ROC curves were used for prediction of lipid ratios as markers for insulin resistance (HOMA-IR) in non-diabetic ACS patients. The AUC which were obtained with the TG/HDL-C and TC/HDL-C ratios indicates that these ratios are reliable markers for estimating the insulin resistance (HOMA-IR) in this study [Table 2, Figure 2].
Figure 1.

(a) Correlation of HOMA-IR with TG/HDL-C, (b) correlation of HOMA-IR with TC/HDL-C
Table 2.
AUC with the TG/HDL-C and TC/ HDL-C ratios

Figure 2.

(a) ROC with the TG/HDL-C ratios, (b) ROC with the TC/HDL-C ratios
DISCUSSION
We have studied 100 patients of ACS admitted at Medical College, Kolkata during the period of our study (April 2010-March 2011). This study was conducted to investigate the potential role of a simple insulin resistance index, i.e., HOMA-IR in identifying insulin resistance in non-diabetic patients admitted with ACSs. HOMA-IR is a useful surrogate index of insulin resistance in both healthy and diabetic subjects. To implement the HOMA-IR method successfully, it is important to define specific cut-points for the race or age of the studied population. In our study, patients with HOMA-IR cut-off value of >2 were classified as insulin resistant. Patients with HOMA-IR <2 were defined as insulin sensitive group. Sinha et al.'s study also used the same. In a recent study by Kim-Dorner et al.,[2] insulin resistance was defined by HOMA-IR of at least 2.5.
Despite the wide use of HOMA-IR, no consensus has been reached regarding the HOMA-IR cut-off value for identifying subjects with IR. Radikova et al.[3] selected the 75th percentile of non-diabetic population for cut-off point of IR which corresponded with HOMA-IR values of 2.29. In our study, we have found lipoprotein ratios (TG/HDL-C and TC/HDL-C) were significantly higher in individuals with HOMA >2 as compared to subjects with HOMA <2, which represents the control group (P = <0.001). Both TG/HDL-C ratio and TC/HDL-C ratios were significantly correlated with HOMA-IR with the Spearman correlation analysis (r = 0.4459, P = 0.0012; r = 0.4815, P = 0.0004).
A recent study by Tangvarasittichai et al.[4] showed association of serum lipoprotein ratios with insulin resistance. In concordance with our results, they have found significant correlation (P < 0.05) of TC/HDL-C, TG/HDL-C, and Non-HDL-C, with insulin resistance (HOMA-IR), although in T2D patients. In the study by McLaughlin et al.,[5] a TG/HDL-C ratio ≥3.5 has been proposed as a cut-off value to predict the presence of insulin resistance. They found that this cut-off had high sensitivity (79%) and specificity (85%) in their study population and concluded that a plasma triglyceride/high-density lipoprotein cholesterol concentration ratio may provide a simple means of identifying insulin resistant, dyslipidemic patients who are likely to be at increased risk of cardiovascular disease. These studies also shown that TG/HDL-C is as close as fasting plasma insulin concentration with IR and could be used as an indicator of IR in clinical setting, as TG/HDL >3.5 is a strong indicator of the presence of IR. We have also followed this value to identify insulin-resistant patients in our study.
A recent study by Brehm et al. demonstrated that the TG/HDL-C ratio positively correlates with insulin resistance in obese non-diabetic individuals. They also suggested that the TG/HDL-C ratio may serve as a marker that is easy to determine and link insulin resistance and cardiovascular risk in non-diabetic individuals.
Jespersen et al in a cross sectional study among normal and overweight non-diabetic individuals showed that those with high value of TC/HDL-C were more resistant to insulin-stimulated glucose disposal. They had higher blood pressure, increased TG concentrations, and hyperinsulinemia, rendering these individuals at increased risk of coronary heart disease and possibly diabetes for reasons unrelated to cholesterol metabolism. In this study, a ratio of 4.6 in the high TC/HDL-C group represented an approximate two-fold increase in risk for CHD as compared to the low TC/HDL-C patients. We have used the cut-off value of 4.5 for TC/HDL-C ratio in our study. Kinosian et al. concluded that the TC/HDL ratio is a superior measure of risk for coronary heart disease compared with either TC or LDL cholesterol levels.
In a large, population-based study by Ingelsson et al., the overall performance of apo B:apo A-I ratio for prediction of CHD was comparable with that of traditional lipid ratios but did not offer incremental utility over TC:HDL-C. They support TC and HDL-C measurements instead of apo B or apo A-I in clinical practice. A recent study by Hadaegh et al. assessed lipid ratios for prediction of diabetes and also searched for appropriate cut-off values in a large population of non-diabetic subjects during 6 years follow-up. The TC/HDL-C and TG/HDL-C showed similar performance for diabetes prediction in men population; however, among women TG/HDL-C highlighted higher risk than TC/HDL-C, although there was no difference in discriminatory power. In this study, TC/HDL-C cut-off value of 5.3 was yielded in both genders to predict incident diabetes.
Although the use of TG and TG/HDL-C as surrogates for insulin resistance has been recommended, but it is important to note that the relationship between TG and TG/HDL-C with insulin may differ by ethnicity. hence, using TG and TG/HDL-C to predict insulin resistance would not be appropriate in certain populations.[4]
Several epidemiological studies demonstrated that the TC/HDL-C and the LDL-C/HDL-C ratios are better predictors of atherosclerosis and cardiovascular disease than any other single lipid marker. Likewise, the TG/HDL-C ratio was demonstrated to be as significant a predictor of cardiovascular disease as the two other lipid ratios. Consequently, it seems more clinically effective to use relatively simple metabolic markers such as TG/HDL-C concentration ratio in the effort to identify non-diabetic people at increased risk of developing future diabetes and adverse cardiovascular outcomes. Further controlled studies are needed to consider these parameters as markers for the identification of individuals with an increased risk for cardiovascular diseases.
CONCLUSIONS
In conclusion, our findings have clinical and public health implications. In clinical settings, the lipid ratio could be used as an indicator of insulin resistance. In large health surveys, it could be used to monitor trends in cardiovascular health in diverse populations. Our results add further support to the notion that TG/HDL-C and TG/HDL-C ratios may be a clinically simple and useful indicator for insulin resistance among non-diabetic adults regardless of race/ethnicity. The TC/HDL-C ratio and TG/HDL-C ratio are easily available to the clinician with every lipid profiles ordered, thus eliminating any additional costs. However, it is important to note that, if TG/HDL-C is to be used as surrogates for insulin resistance, then they predictability may differ by ethnicity. Future research is warranted to assess the predictive power of these lipid ratios for the type 2 diabetes, metabolic syndrome, or cardiovascular disease.
Footnotes
Source of Support: Nil
Conflict of Interest: None declared
REFERENCES
- 1.Matthews DR, Hosker JP, Rudenski AS, Naylor BA, Treacher DF, Turner RC. Homeostasis model assessment: Insulin resistance and beta-cell function from fasting plasma glucose and insulin concentrations in man. Diabetologia. 1985;28:412–9. doi: 10.1007/BF00280883. [DOI] [PubMed] [Google Scholar]
- 2.Kim-Dorner SJ, Deuster PA, Zeno SA, Remaley AT, Poth M. Should triglycerides and the triglycerides to high-density lipoprotein cholesterol ratio be used as surrogates for insulin resistance? Metabolism. 2010;59:299–304. doi: 10.1016/j.metabol.2009.07.027. [DOI] [PubMed] [Google Scholar]
- 3.Radikova Z, Koska J, Huckova M, Ksinantova L, Imrich R, Vigas M, et al. Insulin sensitivity indices: A proposal of cut-off points for simple identification of insulin-resistant subjects. Exp Clin Endocrinol Diabetes. 2006;114:249–56. doi: 10.1055/s-2006-924233. [DOI] [PubMed] [Google Scholar]
- 4.Tangvarasittichai S, Poonsub P, Tangvarasittichai O. Association of serum lipoprotein ratios with insulin resistance in type 2 diabetes mellitus. Indian J Med Res. 2010;131:641–8. [PubMed] [Google Scholar]
- 5.McLaughlin T, Reaven G, Abbasi F, Lamendola C, Saad M, Waters D, et al. Is there a simple way to identify insulin-resistant individuals at increased risk of cardiovascular disease? Am J Cardiol. 2005;96:399–404. doi: 10.1016/j.amjcard.2005.03.085. [DOI] [PubMed] [Google Scholar]


