Abstract.
Different types and sizes of micro- and nanoparticles have been synthesized and developed for numerous applications. It is crucial to characterize the particle sizes. Traditional dynamic light scattering, a predominant method used to characterize particle size, is unable to provide depth resolved information or imaging functions. Doppler variance optical coherence tomography (OCT) measures the spectral bandwidth of the Doppler frequency shift due to the Brownian motion of the particles utilizing the phase-resolved approach and can provide quantitative information about particle size. Spectral bandwidths of Doppler frequency shifts for various sized particles were quantified and were demonstrated to be inversely proportional to the diameter of the particles. The study demonstrates the phase-resolved Doppler variance spectral domain OCT technique has the potential to be used to investigate the properties of particles in highly scattering media.
Keywords: optical coherence tomography, optical Doppler tomography, spectral domain optical coherence tomography, Doppler variance, Brownian motion, gold nanoparticle
Various types of micro- and nanoparticles in different sizes have recently been employed in optical, electronic, and magnetic devices.1–7 Nanoparticles, which are in the same size range as biological macromolecules, proteins, and nucleic acids, have attracted much attention in biological and biomedical applications.8 Nanoparticles have been used for biosensing, cellular and in situ hybridization labeling, cell tagging and sorting, point-of-care diagnostics, kinetic and binding studies, imaging enhancement, and drug delivery.9 The physical and chemical properties of these particles have a strong correlation with the particle size.7 Currently, dynamic light scattering (DLS), which utilizes the intensity correlation function of scattered light, has been predominantly used to determine the size of micro- and nanoparticles.10 Recently, DLS has been further developed to extend its application to strongly scattering media.11–15 However, traditional DLS cannot provide imaging functions.10 Low coherence interferometry (LCI) assisted DLS has been developed based on slow time domain and spectral analyzing method, providing limited depth range with stationary11 or limited reference path length delay.12–14 Optical coherence tomography (OCT), a noninvasive and high resolution imaging modality, has been used to detect scattering signals from samples in real time utilizing Michelson’s interferometer principle.16–18 Differences in diffusion with micro- and nanoparticles were demonstrated by employing not only time domain-OCT but also spectral domain-OCT (SD-OCT) that is based on the power spectrum of the temporal fluctuations of the OCT magnitude.19 Phase-resolved Doppler OCT (PR-D-OCT) has been developed by combining OCT with Doppler velocimetry for blood flow imaging.20 We have further developed PR-D-OCT into phase-resolved Doppler variance OCT (PR-DV-OCT) and reported the applications of PR-DV-OCT for mapping vasculature as well as for quantifying transverse flow velocity.21 Interestingly, the Doppler variance method is not sensitive to bulk-motion, and the Doppler variance method can be used without correcting the bulk-motion, making it possible for in vivo imaging.22 Since the Brownian motion will broaden the spectral bandwidth of the Doppler frequency shift (Doppler bandwidth), PR-DV-OCT, which measures the Doppler bandwidth, will be affected by the Brownian motion and has a strong correlation with particle size.23 In this study, we report on quantification of particle size with a phase-resolved Doppler variance SD-OCT system. Spectral bandwidths of Doppler frequency shift for micro- and nanoparticles in various sizes were demonstrated to be inversely proportional to the diameter of the particles. This technique will be a testbed to explore the potential phase-resolved Doppler variance SD-OCT applications to study the properties of particles in highly scattering media.
Brownian movement is not due to external forces but results from the bombardment of the dispersed particles. The diffusion coefficient can be determined from the Einstein-Stokes equation and is represented by
| (1) |
where is Boltzmann’s constant (), is absolute temperature, is viscosity, and is the radius of the spherical particle.24 The spectral bandwidth () of the scattered light from particles has a Lorentz distribution with a half-width at half maximum (FWHM) of the spectrum25
| (2) |
The is defined in terms of the scattering geometry as
| (3) |
where is the refractive index, is the wavelength of the incident radiation in vacuum, and is the scattering angle. For a Gaussian optical beam, the full width at of maximum spectrum amplitude Doppler bandwidth () can be calculated as the inverse of the transit time by the particles passing through the focusing area:26
| (4) |
where is the flow velocity and is the effective waist diameter of the probe beam in the focal area, which represents the transit length of moving Brownian motion of particles.
The Doppler bandwidth can also be represented by the spectral bandwidth:21
| (5) |
For a Gaussian optical beam, standard deviation () and Doppler bandwidth have the following relationship:
| (6) |
By combining Eqs. (2), (5), and (6), can be represented by
| (7) |
The Doppler bandwidth can be represented by
| (8) |
Therefore, the Doppler bandwidth is linearly proportional to for the constant viscosity and temperature in a colloidal solution.
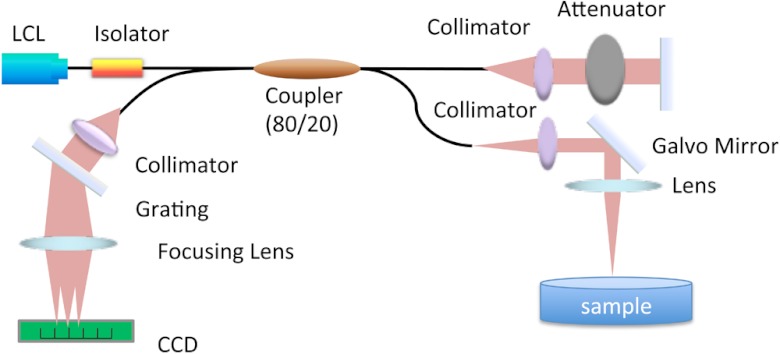
The schematic diagram of the SD-OCT system is shown in Fig. 1. The light source is a super luminescent diode (Superlum D890-HP, Russia) with a center wavelength of 890 nm and a FWHM of 150 nm. The laser output is split by an 80/20 coupler with 80% of the power directed to the reference arm and 20% to the sample arm. The interference signal was detected by a homemade high performance spectrometer with the CCD line scan camera operating at 20 kHz. The measured system sensitivity was 100 dB at zero imaging depth and dropped to 91 dB at 2 mm with the integration time of the CCD camera set at 50 μs. The axial and lateral resolutions of the system were 3.5 and 15 μm, respectively. The phase stability of the system was measured to be 0.48 milliradians. Two-dimensional and 3D images were achieved by using a 3D galvo scanner. DV-OCT imaging for each particle sample was acquired under the same conditions.
Fig. 1.
Schematic diagram of spectrometer-based Fourier domain optical coherence tomography system.
Polystyrene particles in various sizes (81, 202, 350, 485, and 752 nm in diameter) at an approximately 2.6% solid () in deionized (DI) water concentration (Polyscience, Inc., Warrington, Pennsylvania) were used without further modification. Gold nanoparticles (Au NPs) in different sizes (18, 33, 52, and 126 nm in diameter) were synthesized by following the published protocol with slight modifications.15,27 The mean diameter of Au NPs was characterized by using a DLS particle analyzer (Zetasizer Nano series- ZEN 3600, Malvern Instruments, Worcestershire, UK). The mean size of each particle sample was obtained from at least 10 repeated measurements and further compared with the observed morphology under a transmission electron microscopy. Concentrations of Au NPs in different sizes were calculated using the UV/vis spectroscopic method as reported previously.28 The concentrated Au NPs in sizes of 18, 33, 52, and 126 nm in diameter, respectively, by 30 min centrifugation at 13,200, 9,000, 8,000, and 4,000 rpm in room temperature were resuspended in DI water at a concentration of . Before the OCT imaging, all particles were sonicated for at least 20 s to be homogeneous. Then, one hundred microliters of colloidal solution of Au NPs and polystyrene particles were dropped in a 96 well plate and incubated at room temperature for 3 h to equilibrate the temperature to minimize the fluctuation of Brownian motion by temperature. Spectrometer-based Fourier domain OCT was used for DV-OCT imaging. Raw data was processed and quantified within a 200 by 50 pixels area under the vertex of the colloidal particle surface for 5 consecutive images and averaged with nonzero data containing pixels.
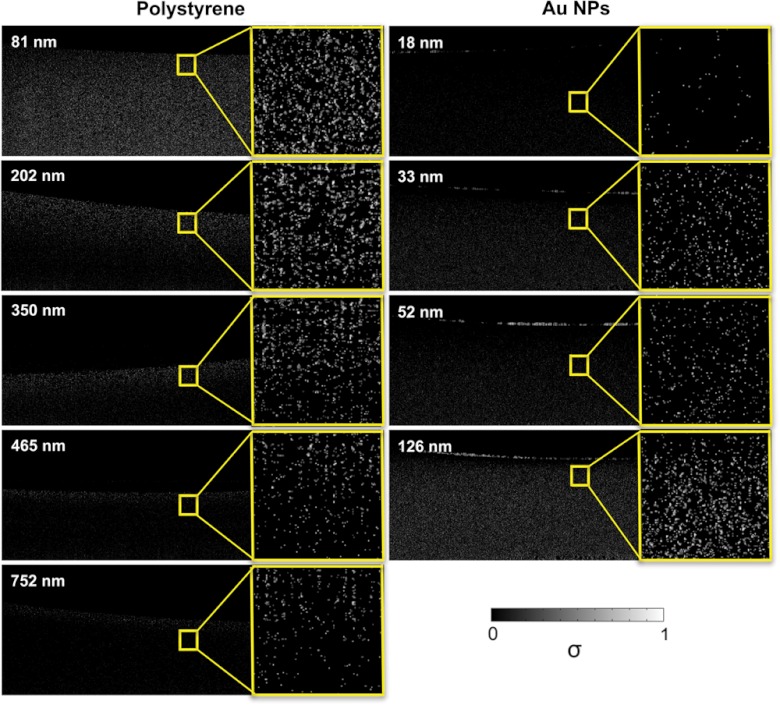
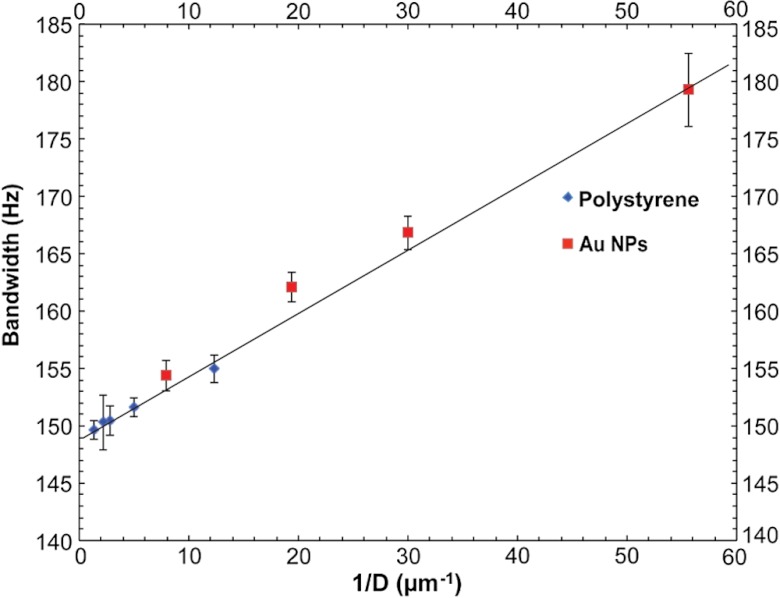
The amplitude of the DV-OCT signal per averaged pixels shown in Fig. 2 increased as the size of the particles decreased due to the faster Brownian motion for polystyrene particles, which is in good agreement with Eq. (8). The penetration depth decreased as the size of the polystyrene particle increased because of stronger scattering from larger particles. Au NPs of small sizes showed low frequency of pixel numbers in DV-OCT images because the scattering signal was much weaker for Au NPs of smaller sizes. However, each nonzero pixel of DV-OCT images of Au NPs showed a higher Doppler bandwidth in Au NPs of smaller sizes due to faster Brownian motion. The DV-OCT images of polystyrene and Au NPs were quantified by the averaged standard deviation of phase differences over 5 consecutive images. For each image, the standard deviation was calculated by averaging three distinct areas covering 200 by 50 nonzero data containing pixels. Interestingly, Fig. 3 shows that the Doppler bandwidth is inversely proportional to the particle diameter due to the size-dependent Brownian motion of particles at a constant temperature regardless of micro- and nanoparticles.
Fig. 2.
DV-OCT images for different sizes of polystyrene particles and gold nanoparticles (Au NPs); is the standard deviation of the Doppler spectrum.
Fig. 3.
PR-DV-OCT quantification with micro- and nanoparticles. The trend line shows a uniform linear correlation between the broadening spectral bandwidth of the Doppler frequency shift of particles and with .
In conclusion, various sizes of polystyrene and Au NPs were imaged with PR-DV-OCT, and the images were quantified in terms of Doppler bandwidth. The broadening spectral bandwidth of the Doppler frequency shift of particles is inversely proportional to the particle diameter. While the data presented is in the context of colloidal solution, the relationship between the bandwidth broadening of Doppler frequency and particle sizes can potentially serve as a framework to image and quantify micro- and nanoparticle-based optical contrast agents in highly scattering, biologically relevant media.
Acknowledgments
This work was supported by the National Institutes of Health (R01EB-10090, R01HL-105215, R01EY-021519, R01HL-103764, K25HL-102055, and P41EB-015890), Air Force Office of Scientific Research (FA9550-10-1-0538), World Class University program through the National Research Foundation of Korea funded by the Ministry of Education, Science and Technology, South Korea (R31-2008-000-20004-0), and the Beckman Laser Institute Endowment. Dr. Chen has a financial interest in OCT Medical Imaging Inc., which, however, did not support this work.
References
- 1.Petroski J. M., et al. , “Kinetically controlled growth and shape formation mechanism of platinum nanoparticles,” J. Phys. Chem. B. 102(18), 3316–3320 (1998). 10.1021/jp981030f [DOI] [Google Scholar]
- 2.Hulteen J. C., Martin C. R. J., “A general template-based method for the preparation of nanomaterials,” J. Mater. Chem. 7(7), 1075–1087 (1997). 10.1039/a700027h [DOI] [Google Scholar]
- 3.Yu Y., et al. , “Gold nanorods: electrochemical synthesis and optical properties,” J. Phys. Chem. B 101(34), 6661–6664 (1997). 10.1021/jp971656q [DOI] [Google Scholar]
- 4.van der Zande B. M. I., et al. , “Aqueous gold sols of rod-shaped particles,” J. Phys. Chem. B 101(6), 852–854 (1997). 10.1021/jp963348i [DOI] [Google Scholar]
- 5.Lisiecki I., Billoudet F., Pileni M. P., “Control of the shape and the size of copper metallic particles,” J. Phys. Chem. 100(10), 4160–4166 (1996). 10.1021/jp9523837 [DOI] [Google Scholar]
- 6.Ahmadi T. S., et al. , “Shape-controlled synthesis of colloidal platinum nanoparticles,” Science 272(5270), 1924–1925 (1996). 10.1126/science.272.5270.1924 [DOI] [PubMed] [Google Scholar]
- 7.Henglein A., “Physicochemical properties of small metal particles in solution: “microelectrode” reactions, chemisorption, composite metal particles, and the atom-to-metal transition,” J. Phys. Chem. 97(21), 5457–5471 (1993). 10.1021/j100123a004 [DOI] [Google Scholar]
- 8.Schmid G., Clusters and Colloids: from Theory to Applications, 1st ed., pp. 469–473, VCH, Weinheim, Germany: (1994). [Google Scholar]
- 9.Stuart D. A., et al. , “Biological applications of localised surface plasmonic phenomenae,” IEE Proc. Nanobiotechnol. 152(1), 13–32 (2005). 10.1049/ip-nbt:20045012 [DOI] [PubMed] [Google Scholar]
- 10.Berne B. J., Pecora R., Dynamic Light Scattering, 1st ed., pp. 105–109, A Wiley-Interscience Publication, New York: (1976). [Google Scholar]
- 11.Popescu G., Gogariu A., “Dynamic light scattering in localized coherence volumes,” Opt. Express 26(8), 551–553 (2001). 10.1364/OL.26.000551 [DOI] [PubMed] [Google Scholar]
- 12.Bizheva K. K., Siegel A. M., Boas D. A., “Path-length-resolved dynamic light scattering in highly scattering random media: the transition to diffusing wave spectroscopy,” Phys. Rev. E 58(6), 7664–7667 (1998). 10.1103/PhysRevE.58.7664 [DOI] [Google Scholar]
- 13.Petoukhova A. L., Steenbergen W., de Mul F. F., “Path-length distribution and path-length-resolved Doppler measurements of multiply scattered photons by use of low-coherence interferometry,” Opt. Lett. 26(19), 1492–1494 (2001). 10.1364/OL.26.001492 [DOI] [PubMed] [Google Scholar]
- 14.Boas D. A., Bizheva K. K., Siegel A. M., “Using dynamic low-coherence interferometry to image Brownian motion within highly scattering media,” Opt. Lett. 23(5), 319–321 (1998). 10.1364/OL.23.000319 [DOI] [PubMed] [Google Scholar]
- 15.Park Y., et al. , “Light scattering of human red blood cells during metabolic remodeling of the membrane,” J. Biomed. Opt. 16(1), 011013 (2011). 10.1117/1.3524509 [DOI] [PMC free article] [PubMed] [Google Scholar]
- 16.Kim C. S., et al. , “Enhanced detection of early-stage oral cancer in vivo by optical coherence tomography using multimodal delivery of gold nanoparticles,” J. Biomed. Opt. 14(3), 034008 (2009). 10.1117/1.3130323 [DOI] [PMC free article] [PubMed] [Google Scholar]
- 17.Ding Z., et al. , “High-resolution optical coherence tomography over a large depth range with an axicon lens,” Opt. Lett. 27(4), 243–245 (2002). 10.1364/OL.27.000243 [DOI] [PubMed] [Google Scholar]
- 18.Drexler W., “Ultrahigh-resolution optical coherence tomography,” J. Biomed. Opt. 9(1), 47–74 (2004). 10.1117/1.1629679 [DOI] [PubMed] [Google Scholar]
- 19.Kalkman J., Sprik R., van Leeuwen T. G., “Path-length-resolved diffusive particle dynamics in spectral-domain optical coherence tomography,” Phys. Rev. Lett. 105(19), 198302 (2010). 10.1103/PhysRevLett.105.198302 [DOI] [PubMed] [Google Scholar]
- 20.Zhao Y., et al. , “Phase resolved optical coherence tomography and optical Doppler tomography for imaging blood flow in human skin with fast-scanning speed and high velocity sensitivity,” Opt. Lett. 25(2), 114–116 (2000). 10.1364/OL.25.000114 [DOI] [PubMed] [Google Scholar]
- 21.Ren H., et al. , “Imaging and quantifying transverse flow velocity with the Doppler bandwidth in a phase-resolved functional optical coherence tomography,” Opt. Lett. 27(6), 409–411 (2002). 10.1364/OL.27.000409 [DOI] [PubMed] [Google Scholar]
- 22.Liu G., et al. , “Real-time bulk-motion-correction free Doppler variance optical coherence tomography for choroidal capillary vasculature imaging,” Opt. Express 19(4), 3657–3666 (2011). 10.1364/OE.19.003657 [DOI] [PMC free article] [PubMed] [Google Scholar]
- 23.Wax A., et al. , “Path-length-resolved dynamic light scattering: modeling the transition from single to diffusive scattering,” Appl. Opt. 40(24), 4222–4227 (2001). 10.1364/AO.40.004222 [DOI] [PubMed] [Google Scholar]
- 24.Weiser H. B., Inorganic Colloid Chemistry, 1st ed., pp. 60–65, John Wiley and Sons Inc., New York: (1933). [Google Scholar]
- 25.Brockhouse B. N., “Diffusive motions in liquids and neutron scattering,” Phys. Rev. Lett. 2(7), 287–289 (1959). 10.1103/PhysRevLett.2.287 [DOI] [Google Scholar]
- 26.Meng J., et al. , “Transit-time analysis based on delay-encoded beam shape for velocity vector quantification by spectral-domain Doppler optical coherence tomography,” Opt. Express 18(2), 1261–1270 (2010). 10.1364/OE.18.001261 [DOI] [PubMed] [Google Scholar]
- 27.Frens G., “Controlled nucletion for the regulation of the particle size in monodiperse gold suspensions,” Nature (London) Phys. Sci. 241, 20–22 (1973). 10.1038/physci241020a0 [DOI] [Google Scholar]
- 28.Haiss W., et al. , “Determination of size and concentration of gold nanoparticles from UV-vis spectra,” Anal. Chem. 79(11), 4215–4221 (2007). 10.1021/ac0702084 [DOI] [PubMed] [Google Scholar]


