

Abstract
Objective
Genetics plays a large role in atherosclerosis susceptibility in humans and mice. We attempted to confirm previously determined mouse atherosclerosis‐associated loci and use bioinformatics and transcriptomics to create a catalog of candidate atherosclerosis modifier genes at these loci.
Methods and Results
A strain intercross was performed between AKR and DBA/2 mice on the apoE−/− background generating 166 F2 progeny. Using the phenotype log10 of the aortic root lesion area, we identified 3 suggestive atherosclerosis quantitative trait loci (Ath QTLs). When combined with our prior strain intercross, we confirmed 3 significant Ath QTLs on chromosomes 2, 15, and 17, with combined logarithm of odds scores of 5.9, 5.3, and 5.6, respectively, which each met the genome‐wide 5% false discovery rate threshold. We identified all of the protein coding differences between these 2 mouse strains within the Ath QTL intervals. Microarray gene expression profiling was performed on macrophages and endothelial cells from this intercross to identify expression QTLs (eQTLs), the loci that are associated with variation in the expression levels of specific transcripts. Cross tissue eQTLs and macrophage eQTLs that replicated from a prior strain intercross were identified. These bioinformatic and eQTL analyses produced a comprehensive list of candidate genes that may be responsible for the Ath QTLs.
Conclusions
Replication studies for clinical traits as well as gene expression traits are worthwhile in identifying true versus false genetic associations. We have replicated 3 loci on mouse chromosomes 2, 15, and 17 that are associated with atherosclerosis. We have also identified protein coding differences and multiple replicated eQTLs, which may be useful in the identification of atherosclerosis modifier genes.
Keywords: atherosclerosis, genetics, transcriptomics
Introduction
Atherosclerosis is a complex disease with both environmental and genetic susceptibility components. The heritability of atherosclerotic coronary artery disease (CAD) in humans is evident from family history being a significant risk factor.1–2 In addition, genome‐wide association studies (GWAS) have identified multiple loci associated with CAD.3 However, these studies have a tremendous statistical burden to overcome to meet the threshold of genome‐wide significance, and thus much of the genetic contribution may underreported. Also, GWAS do not ascertain rare variants, and it is becoming increasingly clear that rare variants in aggregate can account for a significant portion of population variance for complex traits such as plasma triglycerides.4 Thus, there is still impetus to identify novel genes and pathways that play a role in atherosclerosis susceptibility. Genetics also plays a role in lesion development in mouse models of atherosclerosis, as different inbred strains have markedly different aortic lesion areas.5 Mouse models provide an opportunity to tease out the potential genetic modifiers for multigenic phenotypes. We have previously shown that AKR apoE−/− mice have ≈10‐fold smaller aortic root lesions compared with DBA/2 apoE−/− mice when fed a chow diet.5 A previous intercross between these 2 strains identified 2 significant and 4 suggestive quantitative trait loci (QTLs) for aortic root lesion area. Just as lesion area is a quantitative trait that can be used for gene mapping studies, gene expression levels can likewise be treated as a quantitative trait to map the expression QTLs (eQTLs), or the loci that control the expression of specific transcripts.6 We had previously performed an eQTL analysis using macrophages from the F2 cohort of the AKR apoE−/−×DBA/2 apoE−/− strain intercross.7 Here, we report atherosclerosis (Ath) QTL and eQTL findings from a second independent strain intercross of these same 2 strains.
We found that both significant Ath QTLs in the prior cross were replicated in the new cross, whereas only one of the prior suggestive Ath QTLs was replicated. We carefully excluded analysis of transcriptome data from microarray probes that contained strain‐specific sequence polymorphisms, and we still found robust replication of macrophage cis‐acting eQTLs between the prior and new crosses. We also observed many cis‐eQTLs that were conserved between macrophages and endothelial cells (ECs). However, trans‐acting eQTLs were not well replicated between the 2 crosses, leading us to believe that there is a high false‐positive rate for the identification of trans‐eQTLs. We compiled the lists of all protein coding differences between the AKR and DBA/2 strains, as well as the eQTLs, within the replicated Ath QTLs. These genes provide a comprehensive list of candidates that may be responsible for the observed Ath QTLs.
Methods
Mouse and Cell Studies
A DBA/2J apoE−/−×AKR/J apoE−/− reciprocal strain intercross was performed to generate an F1 cohort and the subsequent F2 cohort of 89 males and 77 females. The F2 mice were weaned at 21 days and placed on a chow diet. Mice were killed at 16 weeks of age. Femurs were collected from all mice, and the descending aortas were removed from males for culture of ECs as described later. Tail‐tip DNA was prepared from each F2 mouse by proteinase K digestion followed by ethanol precipitation. Lesion areas of the aortic root were quantified as previously described.8 Genotyping was performed using Illumina Golden Gate mouse genotyping arrays. Genotyping calls were made using Illumina Genome Studio software. In all, 599 informative markers between AKR and DBA/2 were used for QTL and eQTL analyses.
Bone marrow‐derived macrophages (BMMs) were derived as previously described.7 To obtain cultured ECs from the F2 mice, descending aortas were isolated, cut into 2‐mm sections, placed on top of matrigel‐coated plates, and grown to confluence (≈10 to 14 days) in DMEM supplemented as previously described.9 Cells were treated with dispase and passaged twice before RNA isolation. This protocol was successful in obtaining EC cultures in 48 of 89 attempts. RNA was isolated using Qiagen's total RNA kits and digested with DNase I for 12 minutes at room temperature to remove genomic DNA. RNA integrity was confirmed by agarose gel electrophoresis. cDNA was synthesized using Illumina protocols and reagents and hybridized on Illumina Mouse Ref‐8 v2 microarrays. All expression, phenotype, and genotype data are available in GEO (accession No. GSE35676).
Statistical Methods
Ath QTLs, using the log10 of aortic root lesion areas, were mapped using the R package qtl (R/qtl).10 False discovery rates (FDRs) were estimated with 100 000 permutations using the scanone function in R/qtl. The Ath QTL CIs were calculated within the same software using the Bayesian credible interval function.
Gene expression data were loaded into the R‐package lumi11 log2 transformed and quantile normalized. eQTLs were mapped using the scanone function in the R/qtl.10 Probes were mapped using BLAT12 against the mouse mm9 reference genome. Probes that matched to multiple locations or annotated transcripts from Ensembl release 63 were discarded. Probes containing polymorphisms, either an indel or a single nucleotide polymorphism (SNP), or probes mapping to known structural variants between DBA/2 and AKR strains13–14 were discarded because they could lead to identification of false cis‐eQTLs.15 This was performed by taking the genomic locations from BLAT in the University of California Santa Cruz Genome Browser and using Tabix16 to retrieve sequence variants from the Mouse Genome Sequencing Project.13–14 This filtering resulted in the removal of 2749 probes from the data set.
Human–mouse alignments generated previously by Schwarz et al17 were used to obtain the human regions corresponding to our mouse Ath QTLs, and within these regions we identified human GWAS loci18 related to CAD.
To compare eQTLs from the current and previous studies,7 matches between Affymetrix and Illumina's probes were provided by Illumina (http://www.switchtoi.com/probemapping.ilmn). To perform the combined cross‐QTL analyses, the SNPs from each cross were imput to each other using the fill.geno function in R/qtl, with the simple assumption of no double crossovers. In the prior cross, there were 1947 markers, whereas in the new cross, there were 599 markers, of which only 170 overlapped between the 2, leading to 2376 total markers. There is no metric for imputation quality, but we found that using the original set of markers in the second cross versus the combined set of markers did not greatly alter QTL location or strength. A liberal 20‐Mb window was used between studies to determine if an eQTL overlapped. A combined eQTL analysis was done with data from both studies, using cross membership as an additive covariate and sex as an interactive covariate.
Results and Discussion
Atherosclerosis QTL Replication in a New Cross
F2 mice were generated using a reciprocal cross strategy from apoE−/− mice on the AKR and DBA/2 backgrounds. Lesion areas in the aortic root were quantified in 166 F2 mice (77 female and 89 male). A genome scan was performed for each F2 mouse using 599 informative SNPs. We defined significant QTLs as those that have genome‐wide FDRs of <10%, by permutation analysis. Combining both sexes and using sex as an interactive covariate, we identified 3 suggestive Ath QTLs at a logarithm of odds (LOD) score threshold of 2.0 on chromosomes 2, 15, and 17 with FDRs of 15%, 30%, and 16%, respectively (Table 1). Although these Ath QTLs only met the suggestive threshold due to small sample size, each of these Ath QTLs were detected in a prior AKR×DBA/2 strain intercross19: Ath28, a suggestive QTL on chromosome 2; Ath22, a significant QTL on chromosome 15; and Ath26, a significant QTL on chromosome 17. We performed a combined Ath QTL analysis using both crosses with cohort membership as an additive covariate and sex as an interactive covariate. As the platform and markers used to genotype the 2 crosses differed, R/qtl20 was used to impute the genotypes between the 2 crosses. On chromosome 2, Ath28 was replicated and had a combined LOD score of 5.9; on chromosome 15, Ath22 was replicated with a combined LOD score of 5.3; and on chromosome 17, Ath26 was replicated with a combined LOD score of 5.6 (Figure 1). All of these combined LOD scores met the genome‐wide FDR threshold of <10%, and in fact they all had <5% FDR. However, the suggestive Ath QTLs identified in the first cross using sex as an interactive covariate on chromosomes 5, 3, and 1319 were not replicated in the second cross. The approximate 95% Bayesian credible interval was obtained for all 3 loci (Table 1). Thus, the clinical trait mouse QTL model is partially reproducible for a phenotype as complex as lesion area, which has a fairly large coefficient of variation within inbred strains.
Table 1.
Aortic Root Lesion (log10) QTLs in DBA/2×AKR F2 Cohort
| Symbol | Chromosome | Bayesian CI,* Mb | Second Cross LOD Score | Prior Cross LOD Score | FDR | Combined Cross LOD | FDR |
|---|---|---|---|---|---|---|---|
| Ath28 | 2 | 165.1 to 179.3 | 2.8 | 3.2 | 0.15 | 5.9 | <0.05 |
| Ath22 | 15 | 3.6 to 31.9 | 2.0 | 2.1 | 0.30 | 5.3 | <0.05 |
| Ath26 | 17 | 12.4 to 64.3 | 2.7 | 4.4 | 0.16 | 5.6 | <0.05 |
QTL indicates quantitative trait loci; LOD, logarithm of odds; FDR, false discovery rate.
Based on the combined cross‐analysis.
Figure 1.

Log10 aortic root lesion atherosclerosis (Ath) quantitative trait locus (QTL) plots. The pink and blue lines show the logarithm of odds (LOD) plots for the prior and new crosses of AKR apoE−/− and DBA/2 apoE−/− mice, respectively. The black line shows the LOD plot for the combined analysis using cross as an additive covariate. In all analyses, sex was used as an interactive covariate.
We identified the human chromosome segments orthologous to these mouse loci. We examined whether these human orthologous regions contained common genetic variants associated with CAD, myocardial infarction, or related risk factors by searching the National Human Genome Research Institute GWAS catalog18 (Table 2). The known atherosclerosis‐related risk factors included blood lipid levels, subclinical atherosclerosis, type 2 diabetes, and hypertension. There were no human CAD GWAS hits in the region in synteny with Ath28, although ≈21% of the Ath28 interval on chromosome 2 displayed no synteny due to complex expansion in the mouse genome after species divergence. The Ath22 locus on chromosome 15 contains the corresponding segment on human chromosome 5 that has been associated with subclinical atherosclerosis.21 The Ath26 locus on chromosome 17 corresponds to human chromosomes 6 (primarily) and 19, including the major histocompatibility complex locus, and overlaps with multiple human GWAS loci for CAD and related risk factors (Table 2).
Table 2.
Corresponding GWAS Hits in Human Orthologous Regions
| Chromosome | Position | rsID | Author | Trait | Nearest Gene |
|---|---|---|---|---|---|
| 2 (Ath28) | |||||
| No hits | |||||
| 15 (Ath22) | |||||
| 5 | 13764419 | rs2896103 | C.J. O'Donnell | Subclinical atherosclerosis traits (other) | DNAH5 |
| 5 | 13769974 | rs7715811 | C.J. O'Donnell | Subclinical atherosclerosis traits (other) | DNAH5 |
| 5 | 13779743 | rs1502050 | C.J. O'Donnell | Subclinical atherosclerosis traits (other) | DNAH5 |
| 17 (Ath26) | |||||
| 6 | 160578859 | rs1564348 | T.M. Teslovich | LDL cholesterol | LPA |
| 6 | 160578859 | rs1564348 | T.M. Teslovich | Cholesterol, total | LPA |
| 6 | 160741621 | rs3120139 | Q. Qi | Lp(a) levels | SLC22A3 |
| 6 | 160863531 | rs2048327 | D.A. Tregouet | Coronary heart disease | SLC22A3,LPAL2,LPA |
| 6 | 160863531 | rs2048327 | D.A. Tregouet | Coronary heart disease | SLC22A3,LPAL2,LPA |
| 6 | 160907133 | rs3127599 | D.A. Tregouet | Coronary heart disease | SLC22A3,LPAL2,LPA |
| 6 | 160907133 | rs3127599 | D.A. Tregouet | Coronary heart disease | SLC22A3,LPAL2,LPA |
| 6 | 160910516 | rs12214416 | Q. Qi | Lp(a) levels | LPAL2 |
| 6 | 160960358 | rs6919346 | C. Ober | Lp(a) levels | LPA |
| 6 | 160961136 | rs3798220 | H. Schunkert | Coronary heart disease | LPA |
| 6 | 160962502 | rs7767084 | D.A. Tregouet | Coronary heart disease | SLC22A3,LPAL2,LPA |
| 6 | 160962502 | rs7767084 | D.A. Tregouet | Coronary heart disease | SLC22A3,LPAL2,LPA |
| 6 | 160969737 | rs10755578 | D.A. Tregouet | Coronary heart disease | SLC22A3,LPAL2,LPA |
| 6 | 160969737 | rs10755578 | D.A. Tregouet | Coronary heart disease | SLC22A3,LPAL2,LPA |
| 6 | 161010117 | rs10455872 | D.I. Chasman | Response to statin therapy (LDL cholesterol) | LPA |
| 6 | 161010117 | rs10455872 | Q. Qi | Lp(a) levels | LPA |
| 6 | 161089816 | rs1084651 | T.M. Teslovich | HDL cholesterol | LPA |
| 6 | 161137989 | rs783147 | Q. Qi | Lp(a) levels | PLG |
| 6 | 34546560 | rs2814982 | T.M. Teslovich | Cholesterol, total | C6orf106 |
| 6 | 34552797 | rs2814944 | T.M. Teslovich | HDL cholesterol | C6orf106 |
| 6 | 35034800 | rs17609940 | H. Schunkert | Coronary heart disease | ANKS1A |
| 19 | 8433196 | rs7255436 | T.M. Teslovich | HDL cholesterol | ANGPTL4 |
| 19 | 8469738 | rs2967605 | S. Kathiresan | HDL cholesterol | ANGPTL4 |
| 6 | 31184196 | rs3869109 | R.W. Davies | Coronary heart disease | HCG27, HLA‐C |
| 6 | 32412435 | rs3177928 | T.M. Teslovich | LDL cholesterol | HLA |
| 6 | 32412435 | rs3177928 | T.M. Teslovich | Cholesterol, total | HLA |
| 6 | 32669373 | rs11752643 | F. Takeuchi | Coronary heart disease | HLA, DRB‐DQB |
| 6 | 33143948 | rs2254287 | C.J. Willer | LDL cholesterol | B3GALT4 |
| 6 | 43758873 | rs6905288 | R.W. Davies | Coronary heart disease | VEGFA |
GWAS indicates genome wide association studies; Lp(a), lipoprotein(a); LDL, low‐density lipoprotein; HDL, high‐density lipoprotein.
Protein Coding Differences Between AKR and DBA/2 Mice Residing in Ath QTLs
We used a variety of bioinformatic and genomic methods to identify candidate genes that may be responsible for the 3 replicated Ath QTLs. Using the mouse sequence data from 15 common inbred strains,13–14 we identified all of the nonsynonymous protein changes in these 3 loci. These strain variable genes on chromosomes 2 (11 genes), 15 (23 genes), and 17 (258 genes) are listed in Table S1, with many genes having >1 amino acid substitution between these 2 strains. We identified many more strain variant genes for Ath26 on chromosome 17, because it is a very large 52‐Mb gene‐dense interval that contains the highly polymorphic mouse H2 major histocompatibility region. After exclusion of the major histocompatibility genes, we used Polyphen 222 to ascertain in silico the likelihood that each protein coding change would impair protein function, and we found numerous potential protein functional differences between the 2 strains (Tables 3 and S1).
Table 3.
AKR and DBA/2 Protein Differences Within the Ath28, Ath22, and Ath26 CIs Predicted by Polyphen to Be Detrimental
| Chromosome | Position | Reference Allele | Alternate Allele | AKR* | DBA* | Gene Symbol | AA Position | AA Alteration | Polyphen Score* |
|---|---|---|---|---|---|---|---|---|---|
| 2 | 165177862 | C | T | 1/1 | 0/0 | Zfp663 | 646 | G>R | 0.98 |
| 2 | 165179205 | G | A | 1/1 | 0/0 | Zfp663 | 198 | T>I | 0.969 |
| 2 | 172377285 | T | C | 0/0 | 1/1 | Tcfap2c | 143 | Y>H | 0.917 |
| 2 | 173034738 | G | C | 1/1 | 0/0 | Zbp1 | 280 | T>S | 0.944 |
| 15 | 3929418 | C | T | 0/0 | 1/1 | Fbxo4 | 3 | G>R | 1 |
| 15 | 4705267 | G | A | 1/1 | 0/0 | C6 | 205 | R>K | 1 |
| 15 | 4741106 | G | T | 1/1 | 0/0 | C6 | 533 | R>M | 0.591 |
| 15 | 4888423 | G | T | 1/1 | 0/0 | Heatr7b2 | 981 | Q>H | 0.989 |
| 15 | 4984193 | G | A | 1/1 | 0/0 | C7 | 242 | T>M | 0.78 |
| 15 | 9297067 | T | G | 1/1 | 0/0 | Ugt3a2 | 380 | H>Q | 0.966 |
| 15 | 11834935 | C | T | 1/1 | 0/0 | Npr3 | 154 | A>T | 1 |
| 15 | 27492564 | C | T | 0/0 | 1/1 | Ank | 201 | A>V | 0.932 |
| 15 | 28275570 | C | T | 0/0 | 1/1 | Dnahc5 | 2434 | R>W | 0.908 |
| 17 | 12243519 | G | C | 0/0 | 1/1 | Park2 | 397 | E>Q | 1 |
| 17 | 17987504 | C | T | 0/0 | 1/1 | Has1 | 40 | A>T | 0.638 |
| 17 | 18048331 | T | G | 1/1 | 0/0 | Gm7535 | 194 | D>A | 0.958 |
| 17 | 18048648 | C | T | 1/1 | 0/0 | Gm7535 | 88 | M>I | 0.875 |
| 17 | 18395099 | A | G | 1/1 | 0/0 | Vmn2r94 | 117 | S>P | 1 |
| 17 | 18719527 | C | T | 0/0 | 1/1 | Vmn2r96 | 53 | A>V | 1 |
| 17 | 19084957 | G | T | 1/1 | 0/0 | Vmn2r97 | 836 | L>F | 0.951 |
| 17 | 19203418 | G | T | 0/0 | 1/1 | Vmn2r98 | 405 | A>S | 0.937 |
| 17 | 19204356 | G | A | 0/0 | 1/1 | Vmn2r98 | 496 | E>K | 0.979 |
| 17 | 19814743 | C | G | 1/1 | 0/0 | Vmn2r102 | 352 | P>R | 0.806 |
| 17 | 19910406 | G | C | 1/1 | 0/0 | Vmn2r103 | 27 | C>S | 1 |
| 17 | 19949143 | G | T | 0/0 | 1/1 | Vmn2r103 | 738 | K>N | 1 |
| 17 | 20405284 | C | T | 0/0 | 1/1 | Vmn2r106 | 606 | V>I | 0.986 |
| 17 | 20415678 | A | C | 0/0 | 1/1 | Vmn2r106 | 312 | Y>D | 0.975 |
| 17 | 20608324 | C | T | 1/1 | 0/0 | Vmn2r108 | 300 | M>I | 0.793 |
| 17 | 20639402 | T | G | 1/1 | 0/0 | Vmn1r225 | 47 | L>R | 0.998 |
| 17 | 21050607 | A | T | 0/0 | 1/1 | Vmn1r232 | 232 | F>I | 0.774 |
| 17 | 21423632 | C | T | 0/0 | 1/1 | Vmn1r236 | 16 | T>I | 0.953 |
| 17 | 23496190 | G | A,T | 0/0 | 1/1 | Vmn2r115 | 557 | V>F | 0.892 |
| 17 | 23802717 | A | T | 0/0 | 1/1 | Ccdc64b | 170 | T>S | 0.961 |
| 17 | 24558772 | G | A | 1/1 | 0/0 | Rnps1 | 165 | G>E | 0.953 |
| 17 | 24701163 | A | G | 1/1 | 0/0 | Pkd1 | 95 | E>G | 0.985 |
| 17 | 25240572 | C | T | 1/1 | 0/0 | Telo2 | 664 | V>M | 0.946 |
| 17 | 25242093 | C | T | 0/0 | 1/1 | Telo2 | 531 | R>H | 1 |
| 17 | 25247204 | G | A | 0/0 | 1/1 | Telo2 | 301 | R>C | 0.998 |
| 17 | 25305356 | A | T | 0/0 | 1/1 | Ccdc154 | 380 | Q>L | 0.924 |
| 17 | 25305357 | G | T | 0/0 | 1/1 | Ccdc154 | 380 | Q>H | 0.996 |
| 17 | 25436769 | T | C | 0/0 | 1/1 | Prss34 | 260 | L>P | 0.996 |
| 17 | 25457599 | A | G | 1/1 | 0/0 | Prss29 | 74 | T>A | 0.997 |
| 17 | 29018352 | G | A | 1/1 | 0/0 | Pnpla1 | 416 | S>N | 0.766 |
| 17 | 29018363 | T | A | 1/1 | 0/0 | Pnpla1 | 420 | L>M | 0.94 |
| 17 | 29275100 | G | T | 1/1 | 0/0 | Rab44 | 86 | Q>H | 1 |
| 17 | 29296944 | C | T | 1/1 | 0/0 | Cpne5 | 506 | V>M | 0.862 |
| 17 | 29994582 | C | T | 1/1 | 0/0 | Mdga1 | 54 | D>N | 0.997 |
| 17 | 30814214 | C | A,T | 0/0 | 1/1 | Dnahc8 | 886 | L>M | 1 |
| 17 | 31145549 | A | T | 0/0 | 1/1 | Umodl1 | 1304 | I>F | 0.933 |
| 17 | 31372493 | G | A | 1/1 | 0/0 | Ubash3a | 450 | V>M | 0.948 |
| 17 | 32838830 | C | T | 1/1 | 0/0 | Cyp4f15 | 378 | S>F | 0.827 |
| 17 | 33062306 | A | G | 1/1 | 0/0 | Cyp4f13 | 453 | S>P | 0.739 |
| 17 | 33731241 | C | T | 1/1 | 0/0 | Myo1f | 658 | R>C | 0.993 |
| 17 | 34048493 | A | G | 1/1 | 0/0 | Daxx | 179 | N>S | 0.734 |
| 17 | 34057211 | C | G | 0/0 | 1/1 | Tapbp | 79 | L>V | 0.669 |
| 17 | 34069629 | C | T | 0/0 | 1/1 | Rgl2 | 234 | A>V | 0.999 |
| 17 | 34072961 | G | A | 0/0 | 1/1 | Rgl2 | 665 | V>I | 0.969 |
| 17 | 34102686 | A | T | 0/0 | 1/1 | Vps52 | 663 | S>C | 0.996 |
| 17 | 34165995 | C | T | 1/1 | 0/0 | Slc39a7 | 393 | V>M | 0.968 |
| 17 | 34195857 | G | A | 1/1 | 0/0 | Col11a2 | 1044 | A>T | 0.961 |
| 17 | 34196094 | G | A | 0/0 | 1/1 | Col11a2 | 1079 | V>M | 0.996 |
| 17 | 34499618 | G | A | 0/0 | 1/1 | Btnl2 | 242 | E>K | 0.904 |
| 17 | 34518474 | A | C | 0/0 | 1/1 | Btnl3 | 300 | K>Q | 0.81 |
| 17 | 34597021 | A | C | 1/1 | 0/0 | BC051142 | 264 | Q>P | 0.663 |
| 17 | 34645055 | G | A,T | 2/2 | 0/0 | Btnl6 | 482 | A>D | 0.996 |
| 17 | 34645142 | C | G | 0/0 | 1/1 | Btnl6 | 453 | S>T | 0.936 |
| 17 | 34645839 | T | C | 0/0 | 1/1 | Btnl6 | 337 | Q>R | 0.752 |
| 17 | 34652479 | C | G | 0/0 | 1/1 | Btnl6 | 85 | E>Q | 0.893 |
| 17 | 34670298 | A | G | 1/1 | 0/0 | Btnl7 | 426 | F>L | 0.999 |
| 17 | 34670922 | G | A | 1/1 | 0/0 | Btnl7 | 334 | R>C | 0.999 |
| 17 | 34679441 | C | T | 1/1 | 0/0 | Btnl7 | 132 | G>R | 0.997 |
| 17 | 34721459 | G | A | 0/0 | 1/1 | Notch4 | 1469 | R>Q | 0.997 |
| 17 | 34724653 | A | G | 1/1 | 0/0 | Notch4 | 1873 | Y>C | 0.995 |
| 17 | 34735125 | G | A | 1/1 | 0/0 | Ager | 31 | G>E | 1 |
| 17 | 34782359 | C | T | 0/0 | 1/1 | Fkbpl | 52 | P>L | 0.957 |
| 17 | 34787670 | G | T | 0/0 | 1/1 | Atf6b | 233 | A>S | 0.975 |
| 17 | 34808447 | A | G | 0/0 | 1/1 | Tnxb | 273 | Q>R | 0.963 |
| 17 | 34831297 | A | C | 1/1 | 0/0 | Tnxb | 1903 | E>A | 0.944 |
| 17 | 34832575 | C | G | 1/1 | 0/0 | Tnxb | 2020 | H>D | 0.794 |
| 17 | 34833521 | C | T | 0/0 | 1/1 | Tnxb | 2167 | T>I | 0.993 |
| 17 | 34840315 | C | T | 0/0 | 1/1 | Tnxb | 2494 | P>S | 0.992 |
| 17 | 34867829 | C | T | 0/0 | 1/1 | C4b | 1442 | R>K | 0.613 |
| 17 | 35163365 | G | A | 0/0 | 1/1 | Ng23 | 129 | T>M | 0.941 |
AA indicates amino acid; MHC, major histocompatibility complex. Table excludes the MHC genes and several zinc‐finger protein genes.
0 is the reference allele; 1 is the first or only alternate allele; and 2 is the second alternate allele.
Probability of detrimental amino acid substitution, using >0.5 as the threshold.
On chromosome 2, only 3 protein changes were predicted to be damaging in 1 strain relative to the other strain. Zbp1 is a Z‐DNA binding protein, Tcfap2c is an AP‐2 transcription factor involved in early development, and Zfp663 is a zinc‐finger protein; none of these proteins have been previously implicated in atherosclerosis susceptibility. On chromosome 15, there were several protein coding changes that are predicted to be detrimental in 1 strain versus the other. Two components of the complement system, C6 and C7, have predicted functional differences, both with the AKR version being detrimental. The complement system has potential roles in cardiovascular disease as previously reviewed.23 On chromosome 17, there were 50 genes with predicted detrimental changes, and many additional changes in major histocompatibility complex genes, that were not subjected to the Polyphen analysis. Some notable protein changes were found in Rab44, Collagen 11a2, and Notch4, which can alter cellular vesicular trafficking, extracellular matrix, and signal transduction, respectively, all potential atherosclerosis modifiers.
eQTLs in Bone Marrow–Derived Macrophages and Endothelial Cells
The global profile of gene expression in bone marrow–derived macrophages was assayed using Illumina microarrays from 79 female and 81 male F2 mice. With the same 599 SNPs used to map the Ath QTLs, we mapped eQTLs, or loci that are associated with the expression of each transcript, using sex as an additive covariate. An eQTL was defined as a cis‐eQTL if the eQTL mapped within 20 Mb of the probe position. A trans‐eQTL is defined as the QTL mapping anywhere else on the genome. To eliminate spurious eQTLs, we filtered out 2479 expression array probes that contained an SNP or insertion/deletion between these 2 strains, which could lead to altered probe hybridization impairing an accurate measure of gene expression. We validated that these strain variant probes would indeed lead to false cis‐eQTLs with on average an LOD score that was double the LOD score of comparable probes containing no variant (LOD 14.7 versus 7.6, P<2.2×10⁻⁶). In addition, the transcripts with the nonreference SNP allele overlapping the probes were overwhelmingly called with lower expression values versus the transcripts containing the reference allele (Figure S1). After filtering out probes that were not expressed above background in ≥25% of the samples, 9600 probes were evaluated for eQTLs. We used a stringent FDR cut‐off of 5% to identify cis‐eQTLs, which corresponded to an LOD score threshold of 2.4 and found 937 cis‐eQTLs (Table S2). Table 4 shows the top 25 cis‐eQTLs ranked by LOD score. Because trans‐eQTLs are indirect, and often not as strong as cis‐eQTLs, we applied both a liberal FDR cutoff of 30% and a stringent 5% cutoff. The 30% and 5% FDR thresholds corresponded to LOD scores of 2.81 and 3.75, respectively, with 3797 and 551 trans‐eQTLs identified, respectively (Table S3). Table 5 shows the top 25 trans‐eQTLs ranked by LOD score.
Table 4.
Top 25 cis‐eQTLs by LOD Score in BMMs
| Gene Symbol | QTL Marker | QTL Chromosome | QTL Marker Position | LOD |
|---|---|---|---|---|
| Rnps1 | rs3719497 | 17 | 24100880 | 55.9 |
| Fblim1 | rs3688566 | 4 | 140026440 | 54.0 |
| Zfp277 | rs13481408 | 12 | 35475720 | 44.7 |
| 2210012G02Rik | rs3709486 | 4 | 109968331 | 43.9 |
| Atg9b | CEL‐5_24211033 | 5 | 24211033 | 42.5 |
| Vill | rs3669563 | 9 | 117891342 | 41.2 |
| Gjb4 | gnf04.123.367 | 4 | 126400415 | 35.3 |
| Gm962 | CEL‐19_5283144 | 19 | 5283144 | 35.0 |
| Insl6 | rs3090325 | 19 | 26007713 | 33.3 |
| Gm962 | CEL‐19_5283144 | 19 | 5283144 | 32.8 |
| Hint2 | CEL‐4_40541402 | 4 | 40541402 | 32.6 |
| Agpat5 | rs3657963 | 8 | 16576750 | 32.1 |
| Prss22 | rs3726555 | 17 | 15215815 | 31.5 |
| Ccdc163 | rs3709486 | 4 | 109968331 | 30.7 |
| Sys1 | rs3671849 | 2 | 163215888 | 30.4 |
| Abhd1 | rs13469943 | 5 | 29486094 | 30.1 |
| Tuft1 | rs13477261 | 3 | 92344335 | 28.0 |
| Usp2 | rs4135590 | 9 | 43060131 | 28.0 |
| H2‐Gs10 | rs3682923 | 17 | 34343989 | 27.7 |
| Abhd1 | rs13469943 | 5 | 29486094 | 27.5 |
| Zfp420 | rs4226520 | 7 | 18758740 | 27.5 |
| H2‐T10 | rs6298471 | 17 | 35059374 | 26.9 |
| Pdxdc1 | rs4163196 | 16 | 13143895 | 26.5 |
| Fgr | rs3663950 | 4 | 134187547 | 26.1 |
| Scamp5 | rs13480208 | 9 | 55395056 | 25.7 |
eQTL indicates expression quantitative trait loci; LOD, logarithm of odds; BMM, bone marrow macrophage.
Table 5.
Top 25 trans‐eQTLs by LOD Score in BMMs
| Gene Symbol | QTL Chromosome | QTL Marker Position | QTL Marker | LOD | Probe Chromosome | Probe Location |
|---|---|---|---|---|---|---|
| Akr1e1 | 4 | 141638718 | rs3023025 | 28.6 | 13 | 4592177 |
| Mcee | 7 | 51544526 | rs3714908 | 16.5 | 7 | 71556822 |
| Man2a2 | 7 | 65348455 | rs13479355 | 16.4 | 7 | 87505769 |
| Gdpd3 | 7 | 111285662 | rs6275579 | 16.1 | 7 | 133914693 |
| Pde2a | 7 | 87305015 | rs13479427 | 15.1 | 7 | 108661076 |
| Alg8 | 7 | 80158909 | rs4226783 | 14.7 | 7 | 104540400 |
| Gstp2 | 1 | 188355284 | rs3667164 | 14.2 | 19 | 4041930 |
| Man2a2 | 7 | 66776784 | rs13479358 | 13.0 | 7 | 87505788 |
| Dgcr6 | 17 | 34343989 | rs3682923 | 12.4 | 16 | 18070266 |
| Crym | 7 | 104533846 | rs13479477 | 11.7 | 7 | 127330117 |
| Iqgap1 | 7 | 65348455 | rs13479355 | 10.8 | 7 | 87857712 |
| Stab 2 | 13 | 63888326 | rs4229817 | 10.7 | 10 | 86304140 |
| Heatr5a | 12 | 29204179 | rs6223000 | 10.5 | 12 | 52977981 |
| Mlycd | 13 | 70810674 | rs13481880 | 9.8 | 8 | 121934766 |
| Arap1 | 7 | 77850273 | CEL‐7_77850273 | 9.0 | 7 | 108560953 |
| Ifitm6 | 7 | 126965988 | rs3663988 | 9.0 | 7 | 148201750 |
| Fam168a | 7 | 77850273 | CEL‐7_77850273 | 8.3 | 7 | 107987317 |
| Ints3 | 3 | 60037290 | rs13477138 | 7.7 | 3 | 90195467 |
| Plscr4 | 9 | 63239299 | gnf09.057.223 | 7.5 | 9 | 92387070 |
| Snrpn | 7 | 33835314 | rs8260975 | 7.3 | 7 | 67128021 |
| Fam125b | 2 | 10929543 | rs6240512 | 6.9 | 2 | 33585812 |
| Unc45a | 7 | 66776784 | rs13479358 | 6.9 | 7 | 87470214 |
| Capn10 | 17 | 45506664 | rs6409750 | 6.6 | 1 | 94844286 |
| Nasp | 4 | 91308682 | rs6271003 | 6.6 | 4 | 116273846 |
eQTL indicates expression quantitative trait loci; LOD, logarithm of odds; BMM, bone marrow macrophage.
Lusis has proposed that mouse strain effects on EC function may underlie some strain effects on atherosclerosis.24 We successfully cultured primary aortic ECs from 48 male F2 mice used in the atherosclerosis study and assayed global gene expression by microarray. As expected, these cells expressed high levels of canonical EC transcripts encoding the proteins Tie2, the Vegf receptors, and von Willebrand factor, all of which were lowly expressed in BMMs. We applied the same FDR thresholds as in the macrophage analysis to identify EC cis‐ and trans‐eQTLs. At the 5% FDR threshold, corresponding to an LOD score of 2.47, we identified 440 cis‐eQTLs (Table S4 and top 25 in Table 6). For trans‐eQTLs, the 30% and 5% FDR thresholds corresponded to LOD scores of 2.70 and 3.92, with 4894 and 365 trans‐eQTLs identified, respectively (Table S5 and top 25 in Table 7).
Table 6.
Top 25 cis‐eQTLs by LOD Score in ECs
| Gene Symbol | QTL Chromosome | QTL Marker Position | QTL Marker | LOD |
|---|---|---|---|---|
| Thumpd1 | 7 | 107424656 | rs3709679 | 31.7 |
| Mod1 | 9 | 90513305 | gnf09.087.298 | 29.2 |
| Mff | 1 | 85865441 | rs3723062 | 28.0 |
| Paip1 | 13 | 115056838 | rs13482035 | 27.5 |
| Ercc5 | 1 | 44668113 | CEL‐1_44668113 | 24.3 |
| Lrrc57 | 2 | 117074373 | rs13476723 | 24.1 |
| G430022H21Rik | 3 | 122002332 | rs3659836 | 23.1 |
| Aqr | 2 | 111095530 | rs13476698 | 22.2 |
| Atpbd3 | 7 | 33574760 | rs8255275 | 21.1 |
| Abhd1 | 5 | 29486094 | rs13469943 | 18.9 |
| Scoc | 8 | 82188194 | rs13479863 | 17.1 |
| Zfp277 | 12 | 34954150 | rs13481406 | 16.7 |
| Grwd1 | 7 | 33574760 | rs8255275 | 16.2 |
| Ugt1a6a | 1 | 87104170 | UT_1_89.100476 | 16.0 |
| 2610019P18Rik | 5 | 135836567 | rs4225536 | 15.0 |
| Rnf41 | 10 | 122911418 | rs13480803 | 15.0 |
| Slc25a3 | 10 | 93288075 | rs13480712 | 14.9 |
| Pdxdc1 | 16 | 12215630 | rs4162800 | 14.8 |
| 4930455C21Rik | 16 | 30855920 | rs4168640 | 14.6 |
| Il3ra | 14 | 7401248 | rs3150398 | 14.6 |
| Tpmt | 13 | 46624183 | rs6411274 | 14.5 |
| Arid4b | 13 | 12961456 | rs13481697 | 14.2 |
| Pdxdc1 | 16 | 12215630 | rs4162800 | 14.0 |
| BC031748 | X | 129847872 | rs13484031 | 13.0 |
eQTL indicates expression quantitative trait loci; LOD, logarithm of odds; EC, endothelial cells.
Table 7.
Top 25 trans‐eQTLs by LOD Score in ECs
| Gene Symbol | QTL Marker | QTL Chromosome | QTL Marker Position | LOD | Probe Chromosome | Probe Location |
|---|---|---|---|---|---|---|
| Tob2 | rs13480854 | 11 | 7518795 | 7.24 | 15 | 81679613 |
| Adi1 | rs6344105 | 12 | 63022076 | 6.90 | 12 | 29366235 |
| Mrgprg | rs13482407 | 14 | 114388484 | 6.46 | 7 | 150950410 |
| Rb1 | rs3663355 | 4 | 47358427 | 6.39 | 14 | 73595412 |
| P2ry6 | rs3707067 | 7 | 85992410 | 6.20 | 7 | 108086188 |
| Slc10a7 | rs13477617 | 4 | 27105003 | 5.99 | 8 | 81230781 |
| Trp53bp1 | rs13482418 | 15 | 3498960 | 5.94 | 2 | 121025364 |
| Mgst3 | rs6279930 | 1 | 137268795 | 5.92 | 1 | 169303924 |
| Fam168a | rs13479324 | 7 | 57878499 | 5.89 | 7 | 107987317 |
| Eml1 | rs6393948 | 11 | 103272243 | 5.84 | 12 | 109726577 |
| Mrvi1 | rs13476928 | 2 | 174162530 | 5.82 | 7 | 118012039 |
| Tprn | rs3669563 | 9 | 117891342 | 5.78 | 2 | 25125227 |
| Cdk2ap2 | rs6290836 | 14 | 9149500 | 5.71 | 19 | 4098608 |
| Spcs3 | gnf18.051.412 | 18 | 53592447 | 5.64 | 8 | 55606073 |
| Trap1 | rs3699561 | 1 | 130962369 | 5.54 | 16 | 4040058 |
| Eral1 | gnf04.123.367 | 4 | 126400415 | 5.50 | 11 | 77887218 |
| BC013529 | rs13477617 | 4 | 27105003 | 5.47 | 10 | 7487771 |
| Tcf20 | rs13483085 | 17 | 66984514 | 5.43 | 15 | 82640181 |
| Prpsap2 | rs13482673 | 15 | 82560799 | 5.42 | 11 | 61543254 |
| Rin3 | rs3721056 | 9 | 71328971 | 5.38 | 12 | 103628978 |
| Dhcr24 | rs3664408 | 2 | 161443571 | 5.37 | 4 | 106259325 |
| Nxt1 | rs3663950 | 4 | 134187547 | 5.36 | 2 | 148501307 |
| Rtn2 | rs13476928 | 2 | 174162530 | 5.34 | 7 | 19881245 |
| Mlst8 | rs13482035 | 13 | 115056838 | 5.33 | 17 | 24610627 |
eQTL indicates expression quantitative trait loci; LOD, logarithm of odds; EC, endothelial cells.
To evaluate cross‐tissue eQTLs, we counted the number of cis‐eQTLs (5% FDR) and trans‐eQTLs (30% FDR) that were found in both macrophages and ECs. We identified 156 cis‐eQTLs (Table S6) common in both tissues, although our power was limited by the relatively small number of EC samples. We identified 12 cross‐tissue cis‐eQTLs that were located in the 3 replicated Ath QTLs in chromosomes 2, 15, and 17 (Table 8). An example of a cross‐tissue cis‐eQTL within an Ath QTL interval is Sys1, coding for the Golgi‐localized integral membrane protein homolog (Figure 2). In contrast to the 156 cross‐tissue cis‐eQTLs, there were only 18 cross‐tissue trans‐eQTLs at the 30% FDR threshold that overlapped the 2 tissues (Table 9). A replicated trans‐eQTL is defined one in which the trans‐eQTL markers map within 10 Mb of each other. On inspection, it appears that 3 of these cross‐tissue trans‐eQTLs on chromosome 7 may in fact be cis‐eQTLs, because the positions of the gene and the markers were on the chromosome 7 and only slightly greater that the 20‐Mb cutoff used to classify cis‐eQTLs. The low number of cross‐tissue trans‐eQTLs has been noted in previous studies.25 One of these cross‐tissue trans‐eQTLs mapped to the Ath22 interval on chromosome 15, which was associated with the expression of the Klf2 transcription factor on chromosome 8.
Table 8.
cis‐eQTLs That Are Found in Both ECs and BMMs at <5% FDR That Also Reside Within the AthQTLs
| Probe_ID | Gene Symbols | QTL Chromosome | BMM eQTL Position | EC eQTL Position | BMM LOD | EC LOD |
|---|---|---|---|---|---|---|
| ILMN_2674425 | Sys1 | 2 | 163215888 | 163215888 | 30.45 | 10.91 |
| ILMN_1216029 | Cstf1 | 2 | 174162530 | 174162530 | 3.87 | 3.67 |
| ILMN_2869312 | Fbxo4 | 15 | 5744460 | 4222769 | 7.06 | 10.81 |
| ILMN_3123120 | Rnps1 | 17 | 24100880 | 15215815 | 55.90 | 11.24 |
| ILMN_2601877 | Brd4 | 17 | 34343989 | 34343989 | 2.97 | 4.60 |
| ILMN_2810539 | H2‐Gs10 | 17 | 34343989 | 39772541 | 27.72 | 9.78 |
| ILMN_2691360 | Mrps10 | 17 | 39772541 | 43897393 | 6.98 | 3.99 |
| ILMN_1256171 | Tmem63b | 17 | 43897393 | 43897393 | 16.68 | 8.49 |
| ILMN_2734045 | Mrpl14 | 17 | 45506664 | 35059374 | 20.28 | 5.97 |
| ILMN_2804487 | Aif1 | 17 | 45506664 | 39772541 | 2.62 | 3.49 |
| ILMN_2761876 | Fez2 | 17 | 62066360 | 72668814 | 3.69 | 3.25 |
| ILMN_3090123 | Dync2li1 | 17 | 82051202 | 87503632 | 22.79 | 6.35 |
eQTL indicates expression quantitative trait loci; EC, endothelial cells; BMM, bone marrow macrophage; FDR, false discovery rate; LOD, logarithm of odds.
Figure 2.
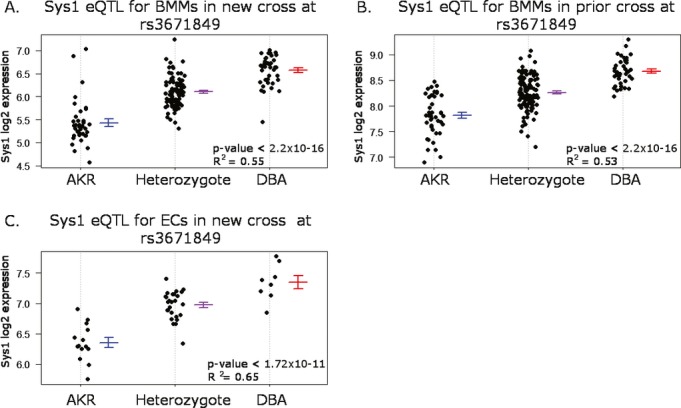
Example of a replicated cis‐eQTL between tissues (A and C) and between studies (A and B) of Sys1, an integral Golgi‐associated membrane protein. Means±SEM are shown adjacent to the individual values. P and R2 values were obtained by linear regression with sex as an additive covariate. eQTL indicates expression quantitative trait loci; BMM, bone marrow macrophage; EC, endothelial cell.
Table 9.
trans‐eQTLs That Are Found in Both ECs and BMMs at <30% FDR
| Probe_ID | Gene Symbols | QTL Chromosome | BMM eQTL Position | EC eQTL Position | BMM LOD | EC LOD | Probe Chromosome | Probe Position |
|---|---|---|---|---|---|---|---|---|
| ILMN_2759167 | Gtpbp5 | 1 | 152747565 | 160294867 | 4.65 | 2.98 | 2 | 179820490 |
| ILMN_2629375 | 1110038F14Rik | 3 | 41838640 | 41838640 | 3.32 | 4.03 | 15 | 76780014 |
| ILMN_2740285 | Fancl | 3 | 126894715 | 132189425 | 2.85 | 2.86 | 11 | 26371341 |
| ILMN_2602837 | Akr1e1 | 4 | 141638718 | 134187547 | 28.63 | 2.82 | 13 | 4592177 |
| ILMN_1245307 | Fbln2 | 5 | 39608047 | 39608047 | 3.04 | 2.79 | 6 | 91221963 |
| ILMN_2685329 | Hspg2 | 5 | 39608047 | 39608047 | 2.87 | 2.88 | 4 | 137126406 |
| ILMN_2622057 | Tsen2 | 5 | 117374791 | 111603432 | 3.16 | 4.78 | 6 | 115527976 |
| ILMN_2791578 | Gspt1 | 5 | 131766121 | 135836567 | 3.14 | 2.96 | 16 | 11220678 |
| ILMN_1255175 | Unc45a | 7 | 66776784 | 65348455 | 6.09 | 3.31 | 7 | 87470402 |
| ILMN_2893879 | Gdpd3 | 7 | 111285662 | 112152410 | 16.13 | 5.25 | 7 | 133914693 |
| ILMN_2689056 | Cd2bp2 | 7 | 112152410 | 112152410 | 6.11 | 5.08 | 7 | 134335721 |
| ILMN_2751354 | Pde4dip | 8 | 84344531 | 86397354 | 4.17 | 3.17 | 3 | 97542917 |
| ILMN_2604029 | Klf2 | 15 | 34383985 | 41359817 | 3.17 | 3.10 | 8 | 74844875 |
| ILMN_1256434 | Pigk | 15 | 72483350 | 72483350 | 3.08 | 3.85 | 3 | 152448803 |
| ILMN_2836924 | Wdr45 | 15 | 95679367 | 92664963 | 2.97 | 2.74 | 20 | 7305117 |
| ILMN_3114998 | Zfp658 | 15 | 95679367 | 92664963 | 3.44 | 3.70 | 7 | 50830408 |
| ILMN_2672778 | Abhd1 | 17 | 66984514 | 69670995 | 3.11 | 3.18 | 5 | 31255322 |
| ILMN_3038459 | Morf4l1 | 19 | 21112530 | 29540192 | 2.86 | 2.76 | 9 | 89998557 |
eQTL indicates expression quantitative trait loci; LOD, logarithm of odds; EC, endothelial cell; BMM, bone marrow macrophage; FDR, false discovery rate.
Macrophage eQTL Replication Between Different Crosses and Different Platforms
A macrophage eQTL study was performed in the previous AKR×DBA/2 F2 intercross; however, different genetic markers and different expression array platforms were used. To examine replication of macrophage eQTLs between the current and previous study, we reanalyzed the prior data by imputing to the currently used 599 strain‐specific SNPs and mapping the Affymetrix gene expression probes to the currently used Illumina probes. After filtering out probes not mapped to the Illumina platform or those that were excluded in our new cross, only 5678 probes remained for analysis. We then performed the eQTL analysis of the prior dataset using sex as an additive covariate and obtained cis‐ and trans‐eQTLs at the same FDRs as described earlier (summary statistics in Table 10). Of the 738 and 482 cis‐eQTLs identified in the prior and new crosses, respectively, 265 were replicated, representing 36% and 55% of the input cis‐eQTLs in the old and new cross, respectively (Figure 3, Table S7). The cis‐eQTL replication percentage range (36% to 55%) in our study is somewhat lower than that of previously published replication study by van Nas et al that found a cis‐eQTL replication rate of ≈50% to 60%.25 However, van Nas et al used the same platform and genotyping markers across their 2 studies, whereas we used separate platforms. In addition, van Nas et al probably overestimated the replication rate, because they did not remove probes containing strain polymorphic SNPs as we did in our study. We demonstrated that inclusion of the strain‐polymorphic probes leads to strong false‐positive eQTLs. Sys1 not only had a cross‐tissue cis‐eQTL, but it is also an example of a cross‐study replicated cis‐eQTL in BMMs (Figure 2). The SNP rs3671849, within the Ath28 locus, displayed a strong additive effect on the expression of Sys1, with the DBA/2 allele expressed higher. This marker was associated with 51% and 42% of the variation in BMM Sys1 gene expression in the new and prior crosses, respectively, and 63% of the variation in EC Sys1 gene expression.
Table 10.
Summary Statistics and Replication of Bone Marrow Macrophage cis‐ and trans‐eQTLs for the Prior and New Crosses Using the Restricted Set of Common Probes
| cis‐eQTLs | trans‐eQTLs | |
|---|---|---|
| No. of eQTLs (5% FDR) prior cross | 738 | 281 |
| No. of eQTLs (5% FDR) new cross | 482 | 274 |
| No. of eQTLs common between old and new (5%) | 265 | 5 |
| No. of eQTLs common between old and new (30%) | ND | 23 |
| No. of eQTLs in combined analysis (5% FDR)* | 783 | 703 |
| No. of eQTLs in combined analysis (30% FDR)* | ND | 3158 |
eQTL indicates expression quantitative trait loci; FDR, false discovery rate; ND, not determined.
Combined sex eQTL analysis in both crosses using sex as an additive covariate.
Figure 3.

Venn diagram of the overlap between the cis‐eQTL in the new cross and the old cross. Transcripts were limited to only the transcripts that were called present in both and had corresponding probe between the platforms. eQTL indicates expression quantitative trait loci.
There were only 5 trans‐eQTLs that replicated between the 2 crosses, or 0.9% and 0.6% of the old cross and new cross trans‐eQTLs, respectively, at a 5% FDR LOD score cutoff (Table 11). The LOD plots and allele effects on gene expression for the Lamb2 gene, which had a replicated trans‐eQTL, is shown in Figure 4. Relaxing the FDR to 30% in both crosses resulted in 23 trans‐eQTLs that replicated between the studies, or 6% and 4% of the old cross and new cross trans‐eQTLs, respectively. This is lower than the ≈19% trans‐eQTL replication rate observed by van Nas et al; however, the same caveats apply to our analysis concerning our use of 2 expression array and SNP platforms.25
Table 11.
Replicated trans‐eQTL Between Crosses at the 5% FDR Level
| Prior Probe ID | New Probe ID | QTL Chromosome | Prior QTL Marker Position, Mb | New QTL Marker Position, Mb | Prior LOD Score | New LOD Score | Gene Symbol | Probe Chromosome | Probe Position, Mb |
|---|---|---|---|---|---|---|---|---|---|
| 1416513_at | ILMN_2699488 | 1 | 11.3 | 4.5 | 5.0 | 6.4 | Lamb2 | 9 | 108.4 |
| 1419423_at | ILMN_2737368 | 13 | 74.5 | 63.9 | 6.3 | 10.7 | Stab 2 | 10 | 86.3 |
| 1437470_at | ILMN_2780759 | 1 | 169.2 | 188.4 | 7.1 | 4.1 | Pknox1 | 17 | 31.7 |
| 1448609_at | ILMN_2493175 | 1 | 8.1 | 13.0 | 13.9 | 5.1 | Tst | 15 | 78.2 |
| 1451343_at | ILMN_1240149 | 8 | 44.5 | 43.9 | 5.8 | 4.1 | Vps36 | 8 | 23.4 |
eQTL indicates expression quantitative trait loci; LOD, logarithm of odds; FDR, false discovery rate.
Figure 4.

An example of a replicating trans‐eQTL on chromosome 4 for the Lamb2 gene residing on chromosome 9. eQTL indicates expression quantitative trait loci; LOD, logarithm of odds.
As an alternative to examining replication of eQTLs, we combined the data from both F2 cohorts and performed a combined analysis of cis‐ and trans‐macrophage eQTLs using sex and cross as additive covariates. The combined method has more power to identify eQTLs than the replication method because it uses a larger sample size and thus is not penalized by a near‐miss false‐negative result in 1 of the 2 crosses. In the combined analysis, there were 783 cis‐eQTLs at a 5% FDR threshold (Tables 10 and S8). An example of a significant cis‐eQTL found in the combined analysis, but not in the replicated analysis, is an eQTL for Wdr70, a WD40 repeat adapter protein. In the combined analysis, there were 160 cis‐eQTLs that were found that were not found in either analysis. Furthermore, there were 703 and 3158 trans‐eQTLs at the 5% and 30% FDR thresholds in the combined analysis, respectively (Tables 10 and S9).
We systematically searched for replicated eQTLs within the Ath QTL regions to identify potential atherosclerosis modifier candidate genes. In total, there were 14 genes that met this criterion, and for each we determined the correlation of macrophage gene expression and lesion area within the F2 mice of the prior and current crosses. Twelve of these correlations had conserved directions in the 2 crosses (Table 12). At the Ath28 locus on chromosome 2, we identified 2 replicated macrophage cis‐eQTLs, of which Sys1 may have a connection to cholesterol ester metabolism. Sys1, whose expression was positively associated with lesion area, is a Golgi‐localized integral membrane protein that is essential for the targeting for several proteins to the Golgi complex and membrane vesicles26 including the small GTPases Arl3p and Arfrp1. Deletion of Arfrp1 results in loss of lipid droplet formation in adipocytes27; lipid droplets in macrophages store cholesterol esters and thus may play an important role in modifying atherosclerosis. At the Ath26 locus on chromosome 17, there were 9 replicated eQTLs with a shared direction of lesion area correlation, 2 of which have some prior link to atherosclerosis. Prss22 is a serine protease that converts prourokinase‐type plasminogen activator into its enzymatically active form, abbreviated as uPA.28 We found that Prss22 expression was inversely correlated with atherosclerosis; thus, we would predict that uPA activity may also be inversely correlated with atherosclerosis. However, this is not the case, as previous studies have shown that macrophage expression of uPA is positively associated with atherosclerosis in apoE‐deficient mice.29–30 Ltb, encoding lymphotoxin‐β (a member of the tumor necrosis factor gene family), resides in the Ath26 locus, and its expression was positively correlated with lesion area. Lymphotoxin‐β receptor signaling in the arterial media beneath atherosclerotic plauques has been found to promote tertiary lymphoid organogenesis.31 In addition, circulating levels of lymphotoxin‐β receptor in humans were positively associated with coronary artery calcium scores.32 However, it is difficult to interpret whether these findings are relevant to our observed correlation of macrophage Ltb expression and lesion area. None of the other replicated eQTLs at the Ath loci had obvious known connections to pathways implicated in atherosclerosis.
Table 12.
Replicated cis‐eQTL Within Replicated Ath QTL Intervals That Have Replicated Direction of Expression–Lesion Correlation
| Illumina Probe ID | Affymetrix Probe ID | Gene Symbol | QTL Chromosome | Expression–Lesion Correlation New Cross* | Expression–Lesion Correlation Old Cross* |
|---|---|---|---|---|---|
| ILMN_2674425 | 1450057_at | Sys1 | 2 | 0.06 | 0.18 |
| ILMN_1216029 | 1448597_at | Cstf1 | 2 | −0.16 | −0.13 |
| ILMN_2710121 | 1416441_at | Pgcp | 15 | −0.19 | −0.12 |
| ILMN_2688287 | 1420352_at | Prss22 | 17 | −0.04 | −0.18 |
| ILMN_2615207 | 1418321_at | Eci1 | 17 | −0.29 | −0.15 |
| ILMN_1219908 | 1418344_at | Tmem8 | 17 | 0.11 | 0.18 |
| ILMN_1218891 | 1419547_at | Fahd1 | 17 | −0.06 | −0.13 |
| ILMN_2667889 | 1417173_at | Atf6b | 17 | 0.02 | 0.13 |
| ILMN_1241923 | 1449537_at | Msh5 | 17 | −0.18 | −0.26 |
| ILMN_2726308 | 1449021_at | Rpp21 | 17 | −0.26 | −0.10 |
| ILMN_1258283 | 1419135_at | Ltb | 17 | 0.16 | 0.16 |
| ILMN_2761876 | 1434348_at | Fez2 | 17 | −0.08 | −0.07 |
eQTL indicates expression quantitative trait loci; Ath QTL, atherosclerosis quantitative trait loci.
Pearson's correlation R value.
Conclusions
We found that phenotypic QTLs for the complex trait of atherosclerosis were partially reproducible. Of the 6 Ath QTLs indentified in the prior cross, the 2 significant QTLs replicated, as did 1 of 4 suggestive QTLs in a combined analysis with the new cross. In the new and smaller cross, all 3 of the suggestive Ath QTLs were found in the prior cross. Based on these results, it may be prudent to replicate phenotypic QTLs before embarking on extensive gene discovery and fine mapping studies.
We also report here than many cis‐eQTLs can be replicated in independent crosses even when the genotyping and gene expression platforms used differed between the studies. This is not unexpected because the cis‐eQTLs are direct and often have very strong effects on gene expression. However, we found a lower rate of trans‐eQTL replication compared with another replication study.25,33 Our conclusion is that many trans‐eQTLs identified in mouse studies may be false positives, or very sensitive to environmental effects, making replication less likely.
Sources of Funding
This work was supported by National Institutes of Health (NIH), National Heart, Lung, and Blood Institute grant HL098193. Jeffrey Hsu was supported by the Howard Hughes Medical Institute Med‐Into‐Grad Scholars Program and Molecular Medicine training grant T32GM088088 from the NIH National Institute of General Medical Sciences.
Disclosures
None.
References
- 1.Lloyd‐Jones D, Nam B, D'Agostino RB, Levy D, Murabito JM, Wang TJ, Wilson PW, O'Donnell CJ. Parental cardiovascular disease as a risk factor for cardiovascular disease in middle‐aged adults. JAMA. 2004; 291:2204-2211 [DOI] [PubMed] [Google Scholar]
- 2.Zdravkovic S, Wienke A, Pedersen NL, Marenberg ME, Yashin AI, De Faire U. Heritability of death from coronary heart disease: a 36‐year follow‐up of 20 966 Swedish twins. J Intern Med. 2002; 252:247-254 [DOI] [PubMed] [Google Scholar]
- 3.Reilly M, Li M, He J, Ferguson J. Novel locus for coronary atherosclerosis and association of ABO with myocardial infarction in the presence of coronary atherosclerosis: two genome‐wide association. Lancet. 2011; 377:383-392 [DOI] [PMC free article] [PubMed] [Google Scholar]
- 4.Johansen CT, Wang J, McIntyre AD, Martins RA, Ban MR, Lanktree MB, Huff MW, Péterfy M, Mehrabian M, Lusis AJ, Kathiresan S, Anand SS, Yusuf S, Lee A‐H, Glimcher LH, Cao H, Hegele RA. Excess of rare variants in non‐genome‐wide association study candidate genes in patients with hypertriglyceridemia. Circ Cardiovasc Genet. 2012; 5:66-72 [DOI] [PMC free article] [PubMed] [Google Scholar]
- 5.Smith JD, Daylon J, Dansky HM, Wittkowski KM, Moore KJ, Breslow JL. In silico quantitative trait locus map for atherosclerosis susceptibility in apolipoprotein E‐deficient mice. Arterioscler Thromb Vasc Biol. 2002; 23:117-122 [DOI] [PubMed] [Google Scholar]
- 6.Schadt E, Monks S, Drake T, Lusis A. Genetics of gene expression surveyed in maize, mouse and man. Nature. 2003; 422:297-302 [DOI] [PubMed] [Google Scholar]
- 7.Bhasin JM, Chakrabarti E, Peng D‐Q, Kulkarni A, Chen X, Smith JD. Sex specific gene regulation and expression QTLs in mouse macrophages from a strain intercross. PLoS ONE. 2008; 3:e1435. [DOI] [PMC free article] [PubMed] [Google Scholar]
- 8.Baglione J, Smith JD. Quantitative assay for mouse atherosclerosis in the aortic root. Methods Mol Med. 2006; 129:83-95 [DOI] [PubMed] [Google Scholar]
- 9.Shi W, Haberland ME, Jien M‐L, Shih DM, Lusis AJ. Endothelial responses to oxidized lipoproteins determine genetic susceptibility to atherosclerosis in mice. Circulation. 2000; 102:75-81 [DOI] [PubMed] [Google Scholar]
- 10.Broman K, Wu H, Sen Ś, Churchill G. R/qtl: QTL mapping in experimental crosses. Bioinformatics. 2003; 19:889-890 [DOI] [PubMed] [Google Scholar]
- 11.Du P, Kibbe WA, Lin SM. lumi: a pipeline for processing Illumina microarray. Bioinformatics. 2008; 24:1547-1548 [DOI] [PubMed] [Google Scholar]
- 12.Kent WJ. BLAT—the BLAST‐like alignment tool. Genome Res. 2002; 12:656. [DOI] [PMC free article] [PubMed] [Google Scholar]
- 13.Keane TM, Goodstadt L, Danecek P, White MA, Wong K, Yalcin B, Heger A, Agam A, Slater G, Goodson M, Furlotte NA, Eskin E, Nellåker C, Whitley H, Cleak J, Janowitz D, Hernandez‐Pliego P, Edwards A, Belgard TG, Oliver PL, McIntyre RE, Bhomra A, Nicod J, Gan X, Yuan W, van der Weyden L, Steward CA, Bala S, Stalker J, Mott R, Durbin R, Jackson IJ, Czechanski A, Guerra‐Assunção JA, Donahue LR, Reinholdt LG, Payseur BA, Ponting CP, Birney E, Flint J, Adams DJ. Mouse genomic variation and its effect on phenotypes and gene regulation. Nature. 2011; 477:289-294 [DOI] [PMC free article] [PubMed] [Google Scholar]
- 14.Yalcin B, Wong K, Agam A, Goodson M, Keane TM, Gan X, Nellåker C, Goodstadt L, Nicod J, Bhomra A, Hernandez‐Pliego P, Whitley H, Cleak J, Dutton R, Janowitz D, Mott R, Adams DJ, Flint J. Sequence‐based characterization of structural variation in the mouse genome. Nature. 2011; 477:326-329 [DOI] [PMC free article] [PubMed] [Google Scholar]
- 15.Alberts R, Terpstra P, Li Y, Breitling R, Nap J‐P, Jansen RC. Sequence polymorphisms cause many false cis eQTLs. PLoS ONE. 2007; 2:e622. [DOI] [PMC free article] [PubMed] [Google Scholar]
- 16.Li H, Handsaker B, Wysoker A, Fennell T, Ruan J, Homer N, Marth G, Abecasis G, Durbin R. The sequence alignment/map format and SAMtools. Bioinformatics. 2009; 25:2078-2079 [DOI] [PMC free article] [PubMed] [Google Scholar]
- 17.Schwartz S, Kent W, Smit A, Zhang Z. Human–Mouse alignments with BLASTZ. Genome Res. 2003; 13:103-107 [DOI] [PMC free article] [PubMed] [Google Scholar]
- 18.Hindorff LA, Sethupathy P, Junkins HA, Ramos EM, Mehta JP, Collins FS, Manolio TA. Potential etiologic and functional implications of genome‐wide association loci for human diseases and traits. Proc Natl Acad Sci USA. 2009; 106:9362-9367 [DOI] [PMC free article] [PubMed] [Google Scholar]
- 19.Smith JD, Bhasin JM, Baglione J, Settle M, Xu Y, Barnard J. Atherosclerosis susceptibility loci identified from a strain intercross of apolipoprotein E‐deficient mice via a high‐density genome scan. Arterioscler Thromb Vasc Biol. 2006; 26:597-603 [DOI] [PubMed] [Google Scholar]
- 20.Arends D, Prins P, Jansen RC, Broman KW. R/qtl: high‐throughput multiple QTL mapping. Bioinformatics. 2010; 26:2990-2992 [DOI] [PMC free article] [PubMed] [Google Scholar]
- 21.O'Donnell CJ, Cupples LA, D'Agostino RB, Fox CS, Hoffmann U, Hwang S‐J, Ingellson E, Liu C, Murabito JM, Polak JF, Wolf PA, Demissie S. Genome‐wide association study for subclinical atherosclerosis in major arterial territories in the NHLBI's Framingham Heart Study. BMC Med Genet. 2007; 8:S4. [DOI] [PMC free article] [PubMed] [Google Scholar]
- 22.Adzhubei I, Schmidt S, Peshkin L, Ramensky VE, Gerasimova A, Bork P, Kondrashov AS, Sunyaev SR. A method and server for predicting damaging missense mutations. Nat Methods. 2010; 7:248-249 [DOI] [PMC free article] [PubMed] [Google Scholar]
- 23.Haskard DO, Boyle JJ, Mason JC. The role of complement in atherosclerosis. Curr Opin Lipidol. 2008; 19:478-482 [DOI] [PubMed] [Google Scholar]
- 24.Shi W, Wang N, Shih D, Sun V, Wang X, Lusis AJ. Determinants of atherosclerosis susceptibility in the C3H and C57BL/6 mouse model: evidence for involvement of endothelial cells but not blood cells or cholesterol. Circulation. 2000; 86:1078-1084 [DOI] [PubMed] [Google Scholar]
- 25.van Nas A, Ingram‐Drake L, Sinsheimer JS, Wang SS, Schadt EE, Drake T, Lusis AJ. Expression quantitative trait loci: replication, tissue‐ and sex‐specificity in mice. Genetics. 2010; 185:1059-1068 [DOI] [PMC free article] [PubMed] [Google Scholar]
- 26.Behnia R, Panic B, Whyte JRC, Munro S. Targeting of the Arf‐like GTPase Arl3p to the Golgi requires N‐terminal acetylation and the membrane protein Sys1p. Nat Cell Biol. 2004; 6:405-413 [DOI] [PubMed] [Google Scholar]
- 27.Hommel A, Hesse D, Völker W, Jaschke A, Moser M, Engel T, Blüher M, Zahn C, Chadt A, Ruschke K, Vogel H, Kluge R, Robenek H, Joost H‐G, Schürmann A. The ARF‐like GTPase ARFRP1 is essential for lipid droplet growth and is involved in the regulation of lipolysis. Mol Cell Biol. 2010; 30:1231-1242 [DOI] [PMC free article] [PubMed] [Google Scholar]
- 28.Yasuda S, Morokawa N, Wong GW, Rossi A, Madhusudhan MS, Sali A, Askew YS, Adachi R, Silverman GA, Krilis SA, Stevens RL. Urokinase‐type plasminogen activator is a preferred substrate of the human epithelium serine protease tryptase epsilon/PRS22. Blood. 2005; 105:3893-3901 [DOI] [PMC free article] [PubMed] [Google Scholar]
- 29.Cozen AE, Moriwaki H, Kremen M, DeYoung MB, Dichek HL, Slezicki KI, Young SG, Vèniant M, Dichek DA. Macrophage‐targeted overexpression of urokinase causes accelerated atherosclerosis coronary artery occlusions, and premature death. Circulation. 2004; 109:2129-2135 [DOI] [PubMed] [Google Scholar]
- 30.Krishnan R, Kremen M, Hu JH, Emery I, Farris SD, Slezicki KI, Chu T, Du L, Dichek HL, Dichek DA. Level of macrophage uPA expression is an important determinant of atherosclerotic lesion growth in Apoe−/− mice. Arterioscler Thromb Vasc Biol. 2009; 29:1737-1744 [DOI] [PMC free article] [PubMed] [Google Scholar]
- 31.Gräbner R, Lötzer K, Döppings S, Hildner M, Radke D, Beer M, Spanbroek R, Lippert B, Reardon CA, Getz GS, Fu YX, Hehlgans T, Mebius RE, van der Wall M, Kruspe D, Englert C, Lovas A, Hu D, Randolph GJ, Weih F, Habenicht AJ. Lymphotoxin beta receptor signaling promotes tertiary lymphoid organogenesis in the aorta adventitia of aged ApoE−/− mice. J Exp Med. 2009; 206:233-248 [DOI] [PMC free article] [PubMed] [Google Scholar]
- 32.Owens AW, Matulevicius S, Rohatgi A, Ayers CR, Das SR, Khera A, McGuire DK, de Lemos JA. Circulating lymphotoxin β receptor and atherosclerosis: observations from the Dallas Heart Study. Atherosclerosis. 2010; 212:601-606 [DOI] [PubMed] [Google Scholar]
- 33.Gatti D, Harrill A, Wright F, Threadgill D. Replication and narrowing of gene expression quantitative trait loci using inbred mice. Mamm Genome. 2009; 20:437-446 [DOI] [PMC free article] [PubMed] [Google Scholar]