

Abstract
The ability to detect rare cells (< 100 cells per ml of whole blood) and obtain quantitative measurements of specific biomarkers on single cells is increasingly important in basic biomedical research. Implementing such methodology for widespread use in the clinic, however, has been hampered by low cell density, small sample sizes, and requisite sample purification. To overcome these challenges, we have developed a microfluidic chip-based micro-Hall detector (μHD), which can directly measure single, immunomagnetically tagged cells in whole blood. The μHD can detect single cells even in the presence of vast numbers of blood cells and unbound reactants, and does not require any washing or purification steps. In addition, the high bandwidth and sensitivity of the semiconductor technology used in the μHD enables high-throughput screening (currently ~107 cells/min). The clinical utility of the μHD chip was demonstrated by detecting circulating tumor cells in whole blood of 20 ovarian cancer patients at higher sensitivity than currently possible with clinical standards. Furthermore, the use of a panel of magnetic nanoparticles, distinguished with unique magnetization properties and bio-orthogonal chemistry, allowed simultaneous detection of the biomarkers EpCAM, HER2/neu, and EGFR on individual cells. This cost-effective, single-cell analytical technique is well-suited to perform molecular and cellular diagnosis of rare cells in the clinic.
INTRODUCTION
The enumeration and molecular profiling of rare cells, such as circulating tumor cells (CTCs), endothelial cells, immune cells, and stem cells, in easily accessible biological fluids is an emergent methodology that holds the potential for detecting and monitoring a variety of diseases, including cancer (1–2). Several platforms capable of detecting molecular biomarkers with high sensitivity have been developed to probe complex biological systems (3). Examples of such platforms include those based on mass spectrometry (4), holographic imaging (5), fluorescence microscopy (3), microfluidic sorting (2), surface plasmon resonance (6), colorimetry (7), nuclear magnetic relaxometry (8, 9), magnetometry, (10–12)(13)(14) (15, 16) electrical impedance (17), and field-effect gating (18). Although such technologies are capable of detecting small quantities of molecular biomarkers (6, 8, 18), resolving rare cells and small quantities of biomarkers from blood that contain many other more abundant cell types, such as erythrocytes and monocytes, remains challenging (2). Consequently, extensive sample preparation and purification are necessary prior to analysis, often leading to the loss of target cells and the decay of molecular biomarkers, thus complicating clinical use (19).
One promising methodology to overcome these challenges is immunomagnetic detection, in which molecular targets of interest are labeled by magnetic particles. Sensing can be performed with minimal sample processing because of the inherently negligible magnetic background of biological samples (8–16). Magnetic sensors based on giant magnetoresistance (GMR) or the Hall effect have been developed to sensitively measure soluble biomarkers in complex biological media (11–14)(16). These systems, however, were designed to detect magnetic particles statically bound to the sensor surface, which has limited their applications to whole cell analyses.
We developed a miniaturized microfluidic chip-based technology, the micro-Hall detector (μHD), that can rapidly and quantitatively screen individual cells in unprocessed clinical specimens. The system detects the magnetic moments of cells in-flow that have been immunolabeled with magnetic nanoparticles (MNPs). The entire assay is performed on a single microfluidic chip, eliminating the need for expensive or bulky equipment, such as optics or centrifuges, and thereby allows cellular diagnostics to be conducted in point-of-care clinical settings. Using widely available immuno-MNPs, the μHD can sensitively detect a broad range of cellular markers, making it a versatile and modular diagnostics platform. We also describe simultaneous, on-chip screening of multiple biomarkers on individual cells. A panel of MNPs, distinguishable by their magnetization properties, were used to target different cellular markers. The quantity of each MNP type—and, hence, the expression level of a target biomarker in a single cell—could be obtained using the particles’ distinctive magnetization properties. The clinical utility of the μHD was explored through detection of rare CTCs in a cohort of patients with advanced ovarian cancer and monitoring drug treatment efficacy in a murine tumor model.
RESULTS
Hall effect sensors for detecting rare cells in complex matrices
The μHD was designed to detect magnetically labeled cellular targets. By targeting cells with MNPs and subjecting them to an external magnetic field B0, each cell acquired a magnetic moment m, directly proportional to both the number of biomarkers N and the magnetic moment of the MNPs mp (m = N × mp). The resulting magnetic fields of these cells were then measured using microfabricated Hall sensors (Fig. 1A). We selected the Hall effect for cell detection, rather than magnetoresistance (10–12). Large magnetic fields (> 0.1 T), which can fully magnetize the MNPs (20), can be applied to improve detection sensitivity without saturating the sensors. Second, owing to linearity in signal strength, cells with non-specifically bound MNPs can be accurately excluded by gating the measured signals above a particular threshold value. Third, the fabrication of Hall sensors is fully compatible with standard semiconductor processing, which enables low-cost production as well as integration with auxiliary electronics (15, 21–23). The entire detection system can be realized as a self-contained, cost-effective lab-on-chip for point-of-care applications.
Figure 1. Design and implementation of the micro-Hall detector (μHD).

(A) Cells labeled with magnetic nanoparticles (MNPs) assume a magnetic moment proportional to the expression of the targeted biomarker. The microfabricated Hall (μHall) sensors measure the magnetic moment associated with each MNP-labeled cell via the Hall voltage VH. A large external magnetic field (B0 > 1 T) fully magnetized the MNPs, without saturating the sensors. (B) The Hall voltages (VH) are measured using capacitively coupled amplifiers, which block constant signal from the external field (B0), and then digitized with an analog to digital converted (ADC). (C) A computer model calculates the magnetic field B⊥ normal to the chip’s surface, which is produced by a magnetic dipole at a specific position (x, y, z). VH is a function of the sensor size (w, l) for a magnetic dipole at a height d = 4 μm above the chip surface. (D) Simulation of the normalized VH as a function of the height of a bead at (x, y) = (0, 0). The sensor size is 8 × 8 μm2. (E) Simulation of the normalized VH for a bead at a height d = 4 μm as a function of x and y over a sensor. (F) The μHD consists of an array of μHall sensors with a microfluidic channel placed on top (left). The inset is a photograph of the μHD, showing the microfabricated GaAs substrate with the PDMS microfluidics directly on top. The sensor array (center) has eight staggered μHall elements, each of which can accurately detect cells passing across the channel width. Dotted lines indicate the position of the sample flow channel. The fluidic structure (right) uses hydrodynamic focusing to laterally position cells into the middle of the channel, and chevron patterns to push cells vertically towards the bottom of the channel.
Design and function of the μHD system
The μHD was fabricated using a combination of standard semiconductor processing and soft lithography (Fig. S1). The μHall sensors were implemented on an epitaxially grown pseudomorphic high electron mobility transistor (PHEMT) substrate, because the low carrier density (nc = 2 × 10¹²/cm2) of PHEMT enhances the Hall signal (VH ~1/nc) (24). After patterning the μHall sensors, the PHEMT substrate was coated with multiple oxide layers (Al2O3/Si3N4/SiO2) to both facilitate permanent bonding with poly(dimethylsiloxane) (PDMS) microfluidic structures (Fig. S1) as well as to protect the μHall sensors from the biological solutions. The external magnetic field (B0 ~ 0.5 T) was provided by a small neodymium magnet (~1 cm3) attached below the chip. The output voltages from the μHall sensors were capacitively coupled to a custom-designed signal-processing unit to block the constant offset caused by the external magnetic field (Fig. 1B). The signal was then digitized (2.5 × 10⁶ samples/s) and analyzed by custom-developed software (Supplementary Methods).
To aid in the design and characterization of the microfabricated Hall sensors, we constructed a numerical model that describes the spatial response of the sensors to a magnetic moment. The model treated each cell as a magnetic dipole moment located at the center of the cell. The magnetic field B⊥ normal to the sensor surface, produced by the magnetic dipole at a specific position (x, y, z), was first calculated. The Hall voltage (VH = I ·RH ·B⊥), where I is the input current to the sensor and RH is the Hall resistance of the device, was obtained by integrating B⊥ over the sensing area of the Hall element. This numerical model was used to determine the optimum sensor size that maximizes signal-to-noise ratio (SNR). A magnetic dipole was held in the center of a Hall sensor, at a height d = 4 μm above the chip’s surface. The Hall voltage VH was then simulated for various sizes of Hall sensor (detection area: l × w). We found that the SNR was maximal when the sensors had a detection area similar to that of the cells being measured (8 × 8 μm2) (Fig. 1C). The Hall voltage VH was also simulated for different magnetic dipole locations. As the dipole was moved away from the sensor surface, the VH signal steeply declined (Fig. 1D); the signal was likewise highly sensitive to the lateral position (x, y) of the dipole (Fig. 1E).
The μHD employs a hybrid microfluidic/semiconductor chip structure to maximize cellular detection across the fluidic stream (Fig. 1F, left). Eight μHall sensors were arranged into an overlapping 2 × 4 array (Fig. 1F, center), which ensured that individual cells pass directly over at least two μHall elements. The signals from all eight μHall sensors were then collected and processed to accurately measure the induced cell magnetization. The motion of cells in both the lateral and vertical directions were further restricted by the fluidic channel (Fig. 1F, right). The lateral confinement was provided via coplanar sheath flow, which directed cells laterally towards the center of the channel. To confine the cells in the vertical direction, chevron patterns were used to push cells to the lowest part of the channel (24). The fluidic structure was iteratively optimized through finite element simulations (Fig. S2A) (Supplementary Methods). Hydrodynamic flow-focusing allows the physical microfluidic channel to be much larger than the size of the cells, effectively reducing the fluidic resistance and thus the risk of clogging. Only a single source of negative pressure was required at the outlet to generate the entire flow. This pressure source does not need to be stable, because the flow-focusing is sensitive only to the relative velocities between the sheath and sample flow (Fig. S2B).
μHD evaluation with magnetic beads
After design optimization, we characterized the electrical properties of the individual μHall sensors, which were AC coupled to the preamplifier through a high-pass filter with a pass frequency of 500 Hz (Supplementary Methods). The Hall resistance (RH) was measured to be 78 Ω/T, and the noise level was ~1.3 nV/Hz1/2 (Fig. S3). Using the typical driving current (2 mA) and the target SNR (~5) for reliable single-cell detection, the minimum magnetic field detectable was ~10 μT, similar to other Hall systems implemented using CMOS technology (16).
The μHD’s capacity for in-flow detection was first evaluated using magnetic beads as target objects. Figure 2A shows the measured Hall signal (VH) after a single magnetic bead 8 μm in diameter passed overa μHall sensor. The duration of the peak corresponds to the flight time (≈ 20 μs) of the bead over the sensor, and can be used to estimate the flow velocity (≈ 500 mm/s). When the external field B0 was applied perpendicular to the chip surface, only a single peak was observed (Fig. 2A, left). When the B0 direction was switched to parallel with the chip surface, two identical peaks with opposite phases were observed (Fig. 2A, right). The results corresponded well with simulated data (Fig. S4), confirming that the signals originated from the magnetic bead. On the basis of these findings, we selected the out-of-plane B0 configuration, because it induces larger Hall voltages than with the in-plane field and simplifies data analysis by producing a single event per cell. The maximum throughput of the μHD prototype was ~107 cells/min, which was limited by the sampling rate of the data acquisition circuitry (2.5 × 10⁶ samples/s and ~10 samples for a single bead event).
Figure 2. Characterization of the μHD.

(A) VH from the passing of a single magnetic bead was measured with the magnetic field either perpendicular (left) or parallel (right) to the sensor plane. (B) The Hall voltages from the eight staggered sensors were used to calculate both the position (x, z) and magnetization (m) of each passing object, which is proportional to the number of biomarkers N for each cell. (C) The averaged VH across the μHall array was used to estimate each cell’s induced magnetic moment, m. As proof-of-concept, a mixture of 3 and 8 μm magnetic beads with the same magnetization were passed over the μHall array. A histogram of the averaged Hall voltage 〈VH〉1/3 (〈VH〉 ∝ a3), in which the x-axis is proportional to the diameter a of the beads, correlated with expected values and with corresponding flow cytometry data (right).
The array of 8 μHall sensors can perform accurate magnetic measurements that are unaffected by the size or position of magnetic objects across the fluidic channel. With the magnetic beads flowing, signals from all μHall sensors were collected and their peak amplitudes were fitted to a numerical model that finds the position and magnetic moment of the passing cells (Methods). The analysis yielded both the magnetic moment m of the bead as well as its lateral and vertical position (x, z) above the array (Fig. 2B). The value of m estimated by the μHD (0.81 A·μm2) correlated with the previously reported value of 0.88 A·μm2 measured by a superconducting quantum interference device magnetometer (20). More importantly, the mean Hall voltage 〈VH〉 over the array appeared to be less dependent on the object’s vertical position, a result of the array essentially capturing most of the magnetic flux emanating from the object (Fig. S5). The 〈VH〉 thus serves as an effective metric for comparing the relative MNP-load of target objects.
Indeed, when magnetic beads composed of the same material but with different diameters (a = 3 and 8 μm) were detected separately by the μHD, the measured 〈VH〉 values were proportional to the bead volume (a3), reflecting the uniform magnetic content of the beads (Fig. S6). When a mixture of the 8 μm and 3 μm beads were profiled, two distinct peaks in 〈VH〉 were observed (Fig. 2C), even at a high detection rate (~107 beads/min). The 〈VH〉 distribution was then plotted as a function 〈VH〉1/3 to obtain the distribution of bead diameter sizes. The observed ratio between the two peak values was 2.7, close to the expected ratio of 8/3. Furthermore, the size distribution showed an excellent match with the forward scatter data obtained by flow cytometry (Fig. 2C, inset), thus confirming the accuracy of the μHD.
High-throughput cellular measurements
We next evaluated the μHD’s capability for molecular profiling of cultured mammalian cells. To achieve efficient cellular labeling with MNPs, we used a two-step bioorthogonal procedure that is based on the cycloaddition between a 1,2,4,5-tetrazine (Tz) and a trans-cyclooctene (TCO) (25) (Supplementary Methods). In this approach, cells were first targeted with TCO-conjugated antibodies. Once bound to their cellular targets, the TCO-antibodies then acted as scaffolds onto which multiple Tz-modified MNPs could be coupled. This technique has resulted in much higher (> 300%) nanoparticle loading onto target cells (~106 MNPs per cell) than direct antibody-MNP conjugates (25).
We began by screening the human breast carcinoma cell line MDA-MB-453 for three different markers that are often overexpressed in epithelial cancer cells: human epidermal growth factor receptor 2 (HER2)/neu, epithelial growth factor receptor (EGFR), and epithelial cell adhesion molecule (EpCAM). In these model studies, we used magnetofluorescent nanoparticles to validate our μHD measurements with conventional flow cytometry. The profiling results from the μHD correlated with those by fluorescence flow cytometry (R2 > 96%) (Fig. 3A, inset); but, owing to lack of magnetic background in biological samples, the μHD detected no signal (below that of noise level) for EGFR whose expression is negligible in MDA-MB-453. In contrast, fluorescence detection showed appreciable background autofluorescence signals, and thus required manual, cell type-dependent gating.
Figure 3. Profiling biomarkers on individual cultured tumor cells.
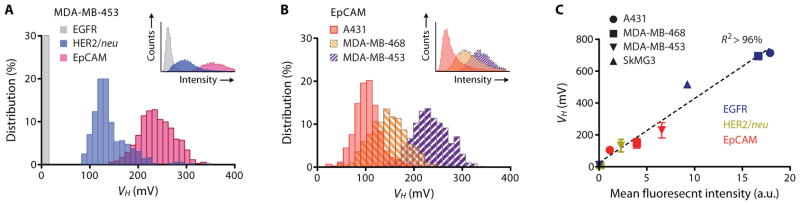
(A) A human breast cancer cell line (MDA-MB-453) was profiled for three cancer biomarkers: EGFR, HER2/neu, and EpCAM. The expression levels measured by the μHD with magnetically labeled cells qualitatively matched expression levels measured by flow cytometry (inset) with fluorescently labeled cells. (B) Three different human cancer cell lines (A431, MDA-MB-468, MDA-MB-453) were screened for EpCAM using the μHD. Inset: flow cytometry measurements for the same three cell lines and EpCAM expression. (C) The linear correlation between μHD and flow cytometry data for a panel of human cancer cell lines (MDA-MB-453, MDA-MB-468, A431, and SkMG3) and for different biomarkers (EGFR, HER2/neu, EpCAM). Data are means ± SEM from 2000 VH values.
We subsequently tested the μHD’s capability for profiling biomarker expression, by detecting a variety of cellular markers across a variety of different cell types. EpCAM expression was compared across three cell lines (Fig. 3B): a human epidermoid cancer cell line (A431) that overexpresses EGFR and two human breast carcinoma cell lines (MDA-MB-468 and MDA-MB-453). Despite variations in their size, the expression profile 〈VH〉 of each cell type matched those obtained by flow cytometry. This profiling capability of the μHD was attributed to the use of the μHall array and flow-focusing, which together enabled detection of the overall magnetic moment of each passing cell, independent of its size and proportional only to the number of MNPs per cell. Indeed, when a panel of cell lines—MDA-MB-453, MDA-MB-468, A431, and SkMG3 (human glioblastoma cell line)—were screened for all three biomarkers (HER2/neu, EGFR, and EpCAM), we observed linear correlation (R2 > 96%) between results obtained by μHD and those by flow cytometry (Fig. 3C).
Background insensitivity
μHD sensitivity to background was tested by profiling tumor cells (MDA-MB-453) across various media. Initially, we compared measurements of EpCAM expression in buffer with measurements in whole blood (Fig. 4A). The observed 〈VH〉 distributions from these measurements were statistically identical (P > 0.5, two-tailed t-test), verifying that biological noise from media is negligible in μHD assays. With flow cytometry, however, such measurements were limited because autofluorescent signals from abundant host cells overwhelmed the signals emanating from the relatively scarce target cells. We next measured EpCAM expression in the presence of excess MNPs. Even in the presence of large amounts of unbound MNPs (~108 particles/ml), the measured 〈VH〉 distribution was found to be similar to that measured in pure PBS (Fig. 4A). This could be attributed to the negligible net magnetic moment of the free-floating MNPs owing to their thermal motions. The observed small offset (4%) in the 〈VH〉 peak position was presumably caused by increased non-specific MNP binding from longer exposure of cells to the particles. Flow cytometry, in contrast, reported a larger shift (>15%) in the peak position because this detection method adds up every photon count, resulting in persistent background signals. The loading of particles onto the cells was shown to increase with incubation time (~10% after 1-h incubation) (Fig. S7), indicating that rapid sample processing is necessary to minimize SNR degradation.
Figure 4. Evaluating the clinical utility of the μHD using tumor cells in vitro.

(A) The μHD was insensitive to the background of unprocessed biological material. The tumor cell line MDA-MB-453 was profiled for EpCAM in human whole blood and in the presence of excess, free MNPs. Cells were measured in PBS (blue), whole blood (red), and PBS+excess MNPs (grey) with both μHD and flow cytometry. (B) The μHD was used to count rare cells in unprocessed whole blood samples. Flow cytometry was used to count cells in RBC-lysed blood samples. These values were compared to the expected cell counts. Data is displayed as mean ± SEM from triplicate measurements. (C) To simultaneously detect multiple biomarkers, cells were labeled with different types of MNPs, each targeting a different biomarker. The magnetic moments of the labeled cells were then measured by placing microfabricated Hall sensors in a spatially varying field (B1, B2, B3). (D) The measured magnetic moments m versus the applied field for MnFe2O4 MNPs with three different diameters (10, 12, and 16 nm). (E) The Hall voltages of cells labeled for all three cancer biomarkers were measured at varying applied field strengths. The magnetization curve (dotted line) is a fit using the magnetization curves of three different types of MnFe2O4 MNPs. Data are means ± SEM from 1000 VH values, SEM is insignificant compared to data. (F) Based on the magnetic moments measured at different fields as well as the known magnetic properties of each MNP, the number of each particle type could be calculated. MDA-MB-468 human cancer cells were labeled for three biomarkers: HER2/neu, EGFR, and EpCAM. The heat map compares the relative expression levels measured using flow cytometry (FCM), as well as separate and multiplexed measurements using the μHD.
Detection threshold in whole blood
To demonstrate clinical utility, we applied the μHD to the detection of rare CTCs in whole blood. Samples were prepared by spiking different amounts of MDA-MB-468 cancer cells into 1 ml of human whole blood. Cell number counts obtained with the μHD showed excellent agreement with expected cell numbers (R2 > 99.9%) as well as a large dynamic range (101 – 105 cells) (Fig. 4B). Importantly, the μHD could accurately detect cancer cells amongst a vast background of background cells (~106 white blood cells and ~109 red blood cells). Cancer cell detection by flow cytometry, however, required prior lysis of red blood cells and showed considerable discrepancies in the cell count (Fig. 4B). At high cell numbers (>103 cancer cells), flow cytometry errors were caused by false-negatives (81% for flow cytometry and 10% for μHD with 106 spiked cells) arising from cell loss during sample preparation and detection steps. At low cell numbers (<103 tumor cells), flow cytometry false-positives (900% with 20 spiked cells) were predominant owing to competing autofluorescence signals from surrounding leukocytes.
Multiplexed detection of individual cells
The ability to simultaneously detect multiple biomarkers on individual cells is crucial not only for correctly identifying target cells, but also for mapping cells of origin and for investigating heterogeneity in cell populations. Conventional Hall sensing, however, is not easily amenable to multiple-marker detection because the analytical signal arises from a single physical parameter: m. To overcome this fundamental problem, we devised a new detection scheme that would enable the μHD to perform multiplexed detection of biomarkers on individual cells. To do this, we exploited the distinct magnetization properties of different MNPs. Cells were labeled with different types of MNPs, each distinguishable by their unique magnetization curve (measurable using a magnetometer) as well as by their biomarker target. The number of each MNP type per cell was then determined by measuring the total m for each individual cell at various B (Fig. 4C). Using the measured magnetic response and the known magnetic properties of the MNPs, the number of each MNP type per cell could be calculated (Methods). A compact and inexpensive approach for implementing this technique is to place a μHD chip, with an array of μHall sensors, in a spatially heterogeneous field created by a permanent magnet. Through frequency multiplexing, each μHall sensor was used to measure both the m of the passing cells (alternating current mode) as well as the static B at the sensor position using the direct current mode (Methods).
We screened cancer cells for their simultaneous expression of several biomarkers. Manganese-doped ferrite (MnFe2O4) MNPs of different diameters (10, 12, and 16 nm) were used, each with a unique magnetization response owing to their size differences (Fig. 4D). Breast cancer cells (MDA-MB-468) were simultaneously labeled for EGFR, HER2/neu, and EpCAM using MnFe2O4 MNPs of different sizes (Supplementary Methods). The m of cells were then measured at different B along the fluidic channel (Fig. 4E), and the relative abundance of each marker was calculated on the known magnetization curves for the particles. Given the μHD resolution power of 10 μT and assuming the typical cellular magnetic moment of ~10−2 T (with ~106 MnFe2O4 MNPs), the uncertainty in m was estimated to be ~0.1%, and the error in expression level was expected to be <10% (Methods). The expression level of each marker was also independently validated using flow cytometry (Fig. 4E). Our measured levels correlated with flow cytometry (R2 = 86%), validating the developed scheme for multiplexed detection.
Enumerating CTCs in clinical samples
To explore the performance of the μHD for CTC detection in patient-derived specimens, we conducted a study on a cohort of ovarian cancer patients (n = 20), selected for advanced disease to favor the presence of CTCs (Table 1). As a negative control, peripheral blood samples were obtained from healthy volunteers (n = 15). We compared the μHD against the clinical gold standard, the CellSearch system, which confers more sensitive rare cell detection than conventional flow cytometry. In reported cohorts of ovarian cancer, CTCs are typically detectable in only 20% of patients using CellSearch (26). Whether this low frequency of CTCs in ovarian cancer patients is owing to the biology of this disease or to inadequate detection thresholds of current methods remains unknown. In our study, we divided each sample into two aliquots. One aliquot was magnetically labeled for a panel of four markers—EpCAM, HER2/neu, EGFR, and mucin-1 (MUC1)—and measured using the μHD. The other aliquot was processed using CellSearch, a clinical “gold standard” technology for CTC detection. CA-125, a clinical biomarker for ovarian cancer, was also measured. The average CA-125 level for cancer patients was 640 U/ml (normal levels 0–35 U/ml) with a range of 141–1142 U/ml (Table 1).
Table 1. Clinical information of cancer patient samples.
Average CTC numbers, as detected by both CellSearch and the μHD, in various clinical scenarios (n = 20). The two highlighted scenarios (Stage IV and Disease Progression) are depicted in further detail, organized by increasing CA-125. All cases within these two categories are included to illustrate the breadth and dynamic range offered by the μHD.
| Characteristic | n | Percentage (%) | Average CTC number in 7.5 ml whole blood (range) | Subject no. | CA-125 (U/ml) | CTC number in 7.5 ml whole blood | ||
|---|---|---|---|---|---|---|---|---|
| CellSearch | μHD | CellSearch | μHD | |||||
| Patients | 20 | 1 (0–7) | 57 (3–236) | |||||
| Age | ||||||||
| Median (range) | 62 (42–92) | |||||||
| Histology | ||||||||
| Serous | 15 | 75 | 1 (0–7) | 60 (3–236) | ||||
| Endometrioid | 1 | 5 | 0 | 43 | ||||
| Transitional | 1 | 5 | 0 | 75 | ||||
| Carcinosarcoma | 1 | 5 | 0 | 54 | ||||
| Mucinous | 1 | 5 | 0 | 11 | 8 | 11 | 0 | 11 |
| Poorly differentiated | 1 | 5 | 0 | 43 | 11 | 17 | 0 | 43 |
| Stage | 14 | 43 | 0 | 64 | ||||
| IIIC | 9 | 45 | 1 (0–3) | 51 (3–193) | 6 | 57 | 0 | 75 |
| IV | 11 | 55 | 1 (0–7) | 61 (11–236) | 7 | 99 | 0 | 54 |
| Surgical debulking | 2 | 139 | 0 | 11 | ||||
| Optimal | 14 | 70 | 1 (0–7) | 47 (3–236) | 1 | 145 | 0 | 43 |
| Suboptimal | 5 | 25 | 1 (0–4) | 86 (21–193) | 5 | 145 | 0 | 21 |
| None | 1 | 5 | 0 | 43 | 13 | 290 | 7 | 236 |
| Therapy | 4 | 1142 | 4 | 86 | ||||
| Active | 15 | 75 | 1 (0–3) | 44 (3–193) | 20 | 1199 | 0 | 24 |
| None | 5 | 25 | 2 (0–7) | 94 (11–236) | ||||
| Platinum | ||||||||
| Sensitive | 12 | 60 | 1 (0–7) | 9 (2–32) | 6 | 57 | 0 | 75 |
| Resistant | 8 | 40 | 1 (0–4) | 64 (4–193) | 7 | 99 | 0 | 54 |
| Disease course | 2 | 139 | 0 | 11 | ||||
| Progression | 6 | 30 | 1 (0–4) | 51 (8–86) | 19 | 141 | 1 | 8 |
| Stable | 3 | 15 | 1 (0–3) | 23 (4–54) | 4 | 1142 | 4 | 86 |
| Response | 11 | 55 | 1 (0–7) | 69 (3–236) | 9 | 1707 | 0 | 75 |
Figure 5A compares CTC counts reported by the μHD and by CellSearch for each patient. CellSearch detected CTCs in only 5/20 ovarian cancer cases with the diagnostic accuracy of 25%. The μHD, on the other hand, enumerated a higher number of CTCs across all patient samples (n = 20) (P < 0.001, two-tailed t-test), and the cell counts were found elevated for patients with advanced disease that are no longer undergoing therapy or with other aggressive cancer types (e.g., poorly differentiated or carcinosarcoma; Table 1). Contrary to CellSearch, the μHD successfully identified CTCs in 100% of patients with evidence of clinical progression (worsening imaging scans or rapidly rising CA-125) as well as Stage IV disease, where only 18% of cases were detected with CellSearch. Compared to healthy controls, the patient group showed significantly higher number of CTC counts (P < 0.01, two-tailed t-test) with wide variations (Fig. 5B). In light of these findings, we subsequently constructed a receiver operating characteristic (ROC) curve using the μHD results from 20 patient and 15 healthy volunteers (Fig. 5C). Cutoff values were determined with input from control cohort data; the diagnostic accuracy of the μHD reached 96%.
Figure 5. Clinical applications of the μHD.

(A) Circulating tumor cells (CTCs) in patient blood samples (n = 20) were detected using the μHD (top) as well as with the clinical gold-standard system, CellSearch (bottom). For the μHD, samples were magnetically targeted for four cancer biomarkers: EpCAM, HER2/neu, EGFR, and MUC1. The CellSearch detection was based on positive selection for EpCAM. (B) Ovarian cancer patients (n = 20) and healthy controls (n = 15) were screened by the μHD. The mean values of cell counts is shown as a dashed line. P < 0.01, two-sided t-test. (C) The receiver operating characteristic (ROC) curve for the μHD was generated from the data in (B). (D) EGFR expression was measured in cultured MDA-MB-468 tumor cells treated with various concentrations of geldanamycin. Western blot (top) and fluorescent microscopy (right) confirmed the results from flow cytometry. Human GAPDH was used as a control. (E) Rate of tumor growth in untreated mice and mice treated with geldanamycin. Data are normalized against the initial tumor volume when the treatment started (day 0). Data are means ± SEM (n = 3). (F) Mice bearing xenografted tumors were treated with geldanamycin for 6 days or left untreated (n = 6 per group). Tumor samples were screened by the μHD to monitor the temporal changes in EGFR expression. Data are means ± SEM. P < 0.05, two-sided t-test between days 1 and 6.
Monitoring of treatment efficacy
Such rare cell enumeration technologies may be useful not only for diagnosing or prognosticating cancer, but also for disease progression during treatment. We applied the μHD to the monitoring of drug treatment efficacy on xenografted human tumors in mice. A431 human epidermoid cancer cells were implanted into mice that then received either geldanamycin, a heat shock protein 90 (HSP90) inhibitor, or saline (control). The binding of geldanamycin to HSP90 has been shown to decrease the expression of growth factor receptors by promoting their degradation (27, 28), an effect we confirmed in vitro in cell culture (Fig. 5D) and in vivo in mice (Fig. 5E).
For molecular profiling, tumor samples were obtained through fine needle aspiration. The aspirates were then labeled with EGFR-specific MNPs and processed for μHD measurement. We observed a progressive decrease in EGFR expression in tumor cells from the treatment group (P < 0.05, two-tailed t-test), whereas the expression level of EGFR remained unchanged in untreated mice (Fig. 5F). The μHD could therefore be used for minimally invasive longitudinal treatment monitoring because it reports biomarker expression per cell in a small number of cells (~1800 tumor cells per aspirate), without the need for normalizing against an independent cell count.
DISCUSSION
We have developed a miniature Hall detector (μHD) with parallel sensor arrays that is capable of rapid detection and characterization of rare cells in unprocessed biological samples. The μHD efficiently detected magnetically labeled cells with high contrast against background blood contents. Measurements were performed with minimal preparation to avoid sample loss and to simplify assay procedures. The use of miniaturized Hall sensors, with their high bandwidth and sensitivity, enables rapid target detection (~107 cells/min with the current device, and potentially up to 109 cells/min, if improvements are made in data acquisition electronics). We have demonstrated the clinical utility of the μHD by detecting rare CTCs in whole blood from 20 ovarian cancer patients, and by molecularly profiling tumor cells from mice to monitor longitudinal treatment response.
The Hall effect refers to the production of a voltage across an electrical conductor within a magnetic field (22). This effect is widely used in magnetic field sensors and consitutes a fundamental component of many sensing devices, including odometers in cars and “electronic compases” within global positioning systems (GPS). Because the Hall effect remains sensitive over a large dynamic range, we hypothesized that it could be used in biomedicine. The μHD developed here integrates several technological advances for the accurate measurement of biomarkers on individual cells. First, the linear response enables operation at high magnetic fields (> 0.1 T), such that MNPs can be fully magnetized to generate maximal signal strength. Magnetoresistive sensors, although they can have extremely high sensitivity (~0.01 μT), have limited utilities in cytometric applications owing to their nonlinear responses to external fields, as well as the saturation at low fields (~10 mT). Second, the Hall element has a similar size to that of the cells that pass over it, which enhances the overall sensitivity of the device. Third, by laying out an array of 8 sensors, each passing cell can be detected regardless of its lateral position in the microfluidic channel; this allows the use of wider channels with less-stringent fluidic control than if the cells had to be focused over a single sensor. Finally, and most importantly, the array integrates the overall magnetic flux from each cell, which consequently enables measurement of the total magnetic moment of a single cell. Accurate cellular profiling can be performed without being affected by the size of a cell or its position in flow, as demonstrated by the strong correlation between the μHD and flow cytometry when different cell types of varying sizes were screened.
The μHD’s ability to detect multiple biomarkers on individual cells enhances detection accuracy in clinical samples, where biomarker expression is often heterogeneous and the use of single biomarkers is generally inadequate to identify a cell type (25). Our comparative demonstration of CTC detection validates this technique: the μHD achieved a diagnosis accuracy of 96% compared to 15% with CellSearch. Furthermore, we show that by exploiting the distinct magnetization of different MNPs, it is now possible to ‘color’ the typically ‘gray-scale’ modality of magnetic detection. This is analogous to the use of multiple fluorescent molecules in optical measurements, although the number of magnetically defined (“bar-coded”) MNPs is currently still limited to a single digit (6 – 7). It should be possible to combine Hall sensing with flow cytometry to further increase the number of biomarkers that can be tested. With the current μHD technology, this could represent a multifold expansion of flow cytometry markers from 8 to > 30 “colors.”
There are several aspects of the μHD that can be further developed to expand the system’s functionality to detect a wider range of diseases. Owing to their weak magnetic moments, the particles used in this study may not be suitable to detect cells with extremely weak biomarkers, such as stem cells or certain immune cells. Highly magnetic particles (e.g., doped ferrite, iron-based particles) would be better for these cell types because they have magnetic moments more than 16-fold higher than the MNPs used in this study (21, 29). Also, the size of the μHall sensors used in this study (64 μm2) would need to be scaled down to ~ 1 μm2 to detect pathogens in clinical samples. The data acquisition electronics, which currently limits the overall throughput to ~107 cells/min, could be further improved to fully exploit the high bandwidth (>150 MHz) of the μHall sensors and thereby shorten the current assay time of CTC detection from 2.5 hours to approximately 30 minutes. Finally, integrating electronics alongside Hall sensors would not only simplify the chip control but also aid in miniaturizing the entire system setup for portable operation. With beneficial features of low-cost electronics and ease of operation, μHDs are poised to offer user-friendly tools for clinicians and investigators seeking rapid insight into disease at the point of care.
METHODS AND MATERIALS
Device fabrication
The μHD consisted of microfabricated Hall sensors with a PDMS microfluidic network built directly on top (Fig. S1A). A mesa was etched on a GaAs wafer (IntelliEpi) containing epitaxially grown pseudomorphic high electron mobility transistor (PHEMT) heterostructure. The mesa was defined using photolithography and followed by an anisotropic reactive ion etch. Electrodes were photolithographically patterned and metal layers were deposited in the following order: Ni (50 Å), Au (50 Å), Ge (250 Å), Au (400 Å), Ni (100 Å), Au (400 Å). The electrodes were subsequently annealed at 480 °C for 90 s using a rapid thermal annealer to form a eutectic alloy, which could then make ohmic contact with the two-dimensional electron gas. The Hall sensors were protected from the biological solutions using three layers of oxide: an Al2O3 layer (30 nm) grown by atomic layer deposition to ensure conformal coverage; a Si3N4 layer (100 nm) grown by chemical vapor deposition (CVD) to protect against the diffusion of ions; and a SiO2 layer (100 nm) grown by CVD to form a layer that can be activated to make permanent bonds with the PDMS. The microfluidic channels were fabricated using standard soft lithography. A two layer SU-8 (MicroChem) mold was fabricated using two-step photolithography. PDMS was poured onto the mold and cured at 65 °C for 3 h. The PDMS microfluidics and GaAs chip were treated with O2 plasma, aligned using a modified mask aligner, and then permanently bonded (Fig. S1B).
Electrical characterization of μHall sensors
The sensitivity of the microfabricated Hall sensors was evaluated by placing the sensors in a known magnetic field and then measuring the corresponding output voltage (Fig. S3). The magnetic field was created using a water cooled electromagnet (HV-4H, Walker LDJ Scientific) and was independently measured using a commercial magnetometer (THM 7025, MetroLab). The Hall resistance (RH) was measured at 78 Ω/T. The noise within the chip’s bandwidth (1 kHz – 2 MHz) was measured using a spectrum analyzer (E4402B, Agilent).
Numerical model for determining cellular position and magnetic moment
We employed a nonlinear data-fitting routine to determine the cellular position (x0, z0) and magnetic moment (m0) from the Hall voltages measured by the 8 μHD. The functional form of VH (x, y, z, m) for a single Hall element was obtained by treating each cell as a magnetic dipole (m) located at (x, y, z) relative to the center of the sensor. Using this form, we calculated the objective function F
where xi is the x-position of the i-th Hall sensor, which increases by the staggering offset (4 μm) of the μHall array. VHi is the measured peak voltage when the cell passes over the i-th sensor; the y offset is thus set to 0. The tuple [x0, z0, m0] that minimized F was then obtained by applying the least-square algorithm.
Simultaneous detection of multiple biomarkers
For multiplexed detection, the strength of B was controlled by changing the position of the neodymium magnet. The field strength, normal to the plane of the chip, was measured using the Hall sensor array in direct current (DC)-coupling mode. For each value of applied magnetic field strength, the magnetic moment of passing cells was measured by the array in AC-coupling mode. Using the measured magnetic responses and the known magnetic properties of each MNP, the number of each MNP type per cell could be calculated. For example, when a cell is labeled by three different types of MNP, each targeting a different biomarker, the total magnetic moment m at a given magnetic field B is:
where for each particle type, N and m represent the number and the magnetic moment of the particle, respectively.
When the total magnetic moment of a cell is measured at three different magnetic fields (B1, B2, B3), we obtain the following linear equations:
The 3 × 3 matrix can be inverted to solve for N. With the MnFe2O4 MNPs and B used here (Fig. 4D, E), the condition number of the matrix was found to be 200. The relative error in (Na, Nb, Nc) was therefore bound by 200 times the error in the measurement of the cellular magnetic moment m.
Detection of circulating tumor cells in clinical samples
Subjects were recruited according to an Institutional Review Board (IRB) approved protocol. Peripheral blood samples from ovarian cancer patients (n = 20) were used to validate CTC detection using the μHD. Each of the blood samples was also processed using the CellSearch system (Veridex). Each of 20 patients with Stage IIIC or IV ovarian cancer, receiving care at the Gillette Center for Gynecologic Oncology, Massachusetts General Hospital, donated 20 ml of blood per collection. Two clinicians (C.M.C. and R.W.), blinded to the μHD and CellSearch results, then reviewed each subject’s documented clinical, imaging, and pathology data. Peripheral blood samples were also obtained from presumably healthy volunteers (n = 15). For all subjects, whole blood was placed unprocessed into tubes containing the anticoagulant EDTA (Becton Dickinson) or into CellSave preservative tubes (Veridex LLC) for μHD and CellSearch analyses, respectively. CTC experiments using CellSearch were promptly conducted at an experienced and independent, outside laboratory blinded to μHD results and clinical data.
For the μHD detection, whole blood samples (7.5 ml) were RBC-lysed and the cell pellet resuspended in buffer (100 μl of PBS/1%FBS). TCO-modified monoclonal antibodies (10 μg/ml) were added and the pellet incubated at room temperature for 20 minutes. Samples were then washed twice, and antibody binding was revealed using magnetic nanoparticles (100 nM TZ-CLIO) for 10 minutes at room temperature. Excess TZ-CLIO was removed by washing and centrifuging twice in PBS containing 1% FBS, before being resuspended in 20 μl of PBS. The total assay time was ~2.5 hours (30 min for MNP labeling, 2 hours for the μHD detection), which was comparable to that of CellSearch detection (2 – 3 hours).
Statistical analysis
Receiver operating characteristic (ROC) curves for the μHD data were constructed by plotting sensitivity versus (1 – specificity). Values for the area under the curve (AUC) were obtained using the trapezoidal rule. The optimal cutoff value for CTC concentration was determined by finding the point closest to the top-left corner (perfect sensitivity or specificity) of the ROC curve. Detection sensitivity, specificity and accuracy were calculated using standard formulas. The empirical ROC curves were smoothed using the binormal fitting model. When comparing the results of the μHD with CellSearch, we used a paired, two-sided t test to determine the correlation between the two methods and to calculate the statistical significance of their mean results. A P value < 0.05 was considered statistically significant. All statistical analyses were performed using the R-package (version 2.13.2).
Supplementary Material
Figure S1. Fabrication of the micro-Hall detector (μHD).
Figure S2. Design of the flow-focusing microstructures.
Figure S3. Electrical setup and measurement of μHall sensors.
Figure S4. Computer-simulated Hall voltage.
Figure S5. Sensor array design.
Figure S6. Validation of sensor array with magnetic beads.
Figure S7. Effect of MNP-incubation time.
Summary.
A hybrid microfluidic/semiconductor chip analyzes single, immunomagnetically tagged ovarian cancer cells in unprocessed biological samples.
Acknowledgments
The authors gratefully thank R. M. Westervelt (Harvard) for his generous support of the device fabrication, J. MacArthur (Harvard) for his help in the implementation of the electronics, A. Ly (Brigham Women’s Hospital) for CellSearch assays, N. Sergeyev for CLIO synthesis, and Y. Fisher-Jeffes for critically reviewing the manuscript.
Funding: This work is supported in part by National Institute of Health Grants 2R01-EB004626, U01-HL080731, HHSN 268201000044C, U54-CA119349, and T32-CA79443.
Footnotes
Author contributions: D.I., J.C., R.W., and H.L. designed the research. C.M.C. and R.W. designed the clinical study. D.I., J.C., H.S., M.L., and C.M.C performed the research. A.A.G. and C.M.C collected and processed the clinical samples. D.I., R.W., and H.L. analyzed the research. D.I., H.S., C.M.C., R.W., and H.L. wrote the paper.
Competing interests: The authors declare no competing interests.
REFERENCES and NOTES
- 1.Fan R, Vermesh O, Srivastava A, Yen BK, Qin L, Ahmad H, Kwong GA, Liu CC, Gould J, Hood L, Heath JR. Integrated barcode chips for rapid, multiplexed analysis of proteins in microliter quantities of blood. Nat Biotechnol. 2008;26:1373–1378. doi: 10.1038/nbt.1507. [DOI] [PMC free article] [PubMed] [Google Scholar]
- 2.Nagrath S, Sequist LV, Maheswaran S, Bell DW, Irimia D, Ulkus L, Smith MR, Kwak EL, Digumarthy S, Muzikansky A, Ryan P, Balis UJ, Tompkins RG, Haber DA, Toner M. Isolation of rare circulating tumour cells in cancer patients by microchip technology. Nature. 2007;450:1235–1239. doi: 10.1038/nature06385. [DOI] [PMC free article] [PubMed] [Google Scholar]
- 3.Brennan DJ, O’Connor DP, Rexhepaj E, Ponten F, Gallagher WM. Antibody-based proteomics: fast-tracking molecular diagnostics in oncology. Nat Rev Cancer. 2010;10:605–617. doi: 10.1038/nrc2902. [DOI] [PubMed] [Google Scholar]
- 4.Bendall SC, Simonds EF, Qiu P, Amir e-AD, Krutzik PO, Finck R, Bruggner RV, Melamed R, Trejo A, Ornatsky OI, Balderas RS, Plevritis SK, Sachs K, Pe’er D, Tanner SD, Nolan GP. Single-cell mass cytometry of differential immune and drug responses across a human hematopoietic continuum. Science. 2011;332:687–696. doi: 10.1126/science.1198704. [DOI] [PMC free article] [PubMed] [Google Scholar]
- 5.Su TW, Yaglidere O, Luckhart S, Ozcan A. Holographic pixel super-resolution in portable lensless on-chip microscopy using a fiber-optic array. Lab Chip. 2011;11:1276–1279. doi: 10.1039/c0lc00684j. [DOI] [PMC free article] [PubMed] [Google Scholar]
- 6.Homola J. Surface plasmon resonance sensors for detection of chemical and biological species. Chem Rev. 2008;108:462–493. doi: 10.1021/cr068107d. [DOI] [PubMed] [Google Scholar]
- 7.Ellerbee AK, Phillips ST, Siegel AC, Mirica KA, Martinez AW, Striehl P, Jain N, Prentiss M, Whitesides GM. Quantifying colorimetric assays in paper-based microfluidic devices by measuring the transmission of light through paper. Anal Chem. 2009;81:8447–8452. doi: 10.1021/ac901307q. [DOI] [PubMed] [Google Scholar]
- 8.Lee H, Sun E, Ham D, Weissleder R. Chip-NMR biosensor for detection and molecular analysis of cells. Nat Med. 2008;14:869–874. doi: 10.1038/nm.1711. [DOI] [PMC free article] [PubMed] [Google Scholar]
- 9.Haun JB, Castro CM, Wang R, Peterson VM, Marinelli BS, Lee H, Weissleder R. Micro-NMR for rapid molecular analysis of human tumor samples. Sci Transl Med. 2011;3:71ra16. doi: 10.1126/scitranslmed.3002048. [DOI] [PMC free article] [PubMed] [Google Scholar]
- 10.Adams JD, Kim U, Soh HT. Multitarget magnetic activated cell sorter. Proc Natl Acad Sci USA. 2008;105:18165–18170. doi: 10.1073/pnas.0809795105. [DOI] [PMC free article] [PubMed] [Google Scholar]
- 11.Loureiro J, Andrade PZ, Cardoso S, da Silva CL, Cabral JM, Freitas PP. Magnetoresistive chip cytometer. Lab Chip. 2011;11:2255–2261. doi: 10.1039/c0lc00324g. [DOI] [PubMed] [Google Scholar]
- 12.Gaster RS, Hall DA, Nielsen CH, Osterfeld SJ, Yu H, Mach KE, Wilson RJ, Murmann B, Liao JC, Gambhir SS, Wang SX. Matrix-insensitive protein assays push the limits of biosensors in medicine. Nat Med. 2009;15:1327–1332. doi: 10.1038/nm.2032. [DOI] [PMC free article] [PubMed] [Google Scholar]
- 13.Gaster R, Xu L, Han SJ, Wilson R, Hall D, Osterfeld S, Yu H, Wang S. Quantification of protein interactions and solution transport using high-density GMR sensor arrays. Nat Nanotechnol. 2011;6:314–320. doi: 10.1038/nnano.2011.45. [DOI] [PMC free article] [PubMed] [Google Scholar]
- 14.Skucha K, Liu P, Megens M, Kim J, Boser B. A compact Hall-effect sensor array for the detection and imaging of single magnetic beads in biomedical assays. Solid-State Sensors, Actuators and Microsystems Conference (TRANSDUCERS), 2011 16th International; 2011. pp. 1833–1836. [Google Scholar]
- 15.Kim J, Jensen EC, Megens M, Boser B, Mathies RA. Integrated microfluidic bioprocessor for solid phase capture immunoassays. Lab Chip. 2011;11:3106–3112. doi: 10.1039/c1lc20407f. [DOI] [PubMed] [Google Scholar]
- 16.Liu P, Skucha K, Duan Y, Megens M, Jungkyu K, Izyumin I, Gambini S, Boser B. Magnetic Relaxation Detector for Microbead Labels in Biomedical Assays. 2011 Symposium on VLSI Circuits. Digest of Technical Papers; 2011. pp. 176–177. [Google Scholar]
- 17.Sun T, Holmes D, Gawad S, Green NG, Morgan H. High speed multi-frequency impedance analysis of single particles in a microfluidic cytometer using maximum length sequences. Lab Chip. 2007;7:1034–1040. doi: 10.1039/b703546b. [DOI] [PubMed] [Google Scholar]
- 18.Gu B, Park TJ, Ahn JH, Huang XJ, Lee SY, Choi YK. Nanogap field-effect transistor biosensors for electrical detection of avian influenza. Small. 2009;5:2407–2412. doi: 10.1002/smll.200900450. [DOI] [PubMed] [Google Scholar]
- 19.Sorger PK. Microfluidics closes in on point-of-care assays. Nat Biotechnol. 2008;26:1345–1346. doi: 10.1038/nbt1208-1345. [DOI] [PubMed] [Google Scholar]
- 20.Shevkoplyas SS, Siegel AC, Westervelt RM, Prentiss MG, Whitesides GM. The force acting on a superparamagnetic bead due to an applied magnetic field. Lab Chip. 2007;7:1294–1302. doi: 10.1039/b705045c. [DOI] [PubMed] [Google Scholar]
- 21.Lee H, Yoon TJ, Figueiredo JL, Swirski FK, Weissleder R. Proc Natl Acad Sci U S A. 2009;106:12459–12464. doi: 10.1073/pnas.0902365106. [DOI] [PMC free article] [PubMed] [Google Scholar]
- 22.Popović RS. Hall effect devices. IOP Publishing; London: 2004. [Google Scholar]
- 23.Issadore D, Franke T, Brown KA, Westervelt RM. A microfluidic microprocessor: controlling biomimetic containers and cells using hybrid integrated circuit/microfluidic chips. Lab Chip. 2010;10:2937–2943. doi: 10.1039/c0lc00092b. [DOI] [PubMed] [Google Scholar]
- 24.Howell PBJ, Golden JP, Hilliard LR, Erickson JS, Mott DR, Ligler FS. Two simple and rugged designs for creating microfluidic sheath flow. Lab Chip. 2008;8:1097–1103. doi: 10.1039/b719381e. [DOI] [PMC free article] [PubMed] [Google Scholar]
- 25.Haun JB, Devaraj NK, Hilderbrand SA, Lee H, Weissleder R. Bioorthogonal chemistry amplifies nanoparticle binding and enhances the sensitivity of cell detection. Nat Nanotechnol. 2010;5:660–665. doi: 10.1038/nnano.2010.148. [DOI] [PMC free article] [PubMed] [Google Scholar]
- 26.Aktas B, Kasimir-Bauer S, Heubner M, Kimmig R, Wimberger P. Molecular profiling and prognostic relevance of circulating tumor cells in the blood of ovarian cancer patients at primary diagnosis and after platinum-based chemotherapy. Int J Gynecol Cancer. 2011;21:822–830. doi: 10.1097/IGC.0b013e318216cb91. [DOI] [PubMed] [Google Scholar]
- 27.Kamal A, Thao L, Sensintaffar J, Zhang L, Boehm MF, Fritz LC, Burrows FJ. A high-affinity conformation of Hsp90 confers tumour selectivity on Hsp90 inhibitors. Nature. 2003;425:407–410. doi: 10.1038/nature01913. [DOI] [PubMed] [Google Scholar]
- 28.Yang S, Qu S, Perez-Tores M, Sawai A, Rosen N, Solit DB, Arteaga CL. Association with HSP90 inhibits Cbl-mediated down-regulation of mutant epidermal growth factor receptors. Cancer Res. 2006;66:6990–6997. doi: 10.1158/0008-5472.CAN-06-1042. [DOI] [PubMed] [Google Scholar]
- 29.Yoon TJ, Lee H, Shao H, Weissleder R. Highly magnetic core-shell nanoparticles with a unique magnetization mechanism. Angew Chem Int Ed Engl. 2011;50:4663–4666. doi: 10.1002/anie.201100101. [DOI] [PMC free article] [PubMed] [Google Scholar]
- 30.Liong M, Shao H, Haun JB, Lee H, Weissleder R. Carboxymethylated polyvinyl alcohol stabilizes doped ferrofluids for biological applications. Adv Mater. 2010;22:5168–5172. doi: 10.1002/adma.201002219. [DOI] [PMC free article] [PubMed] [Google Scholar]
- 31.Agasti SS, Liong M, Tassa C, Chung HJ, Shaw SY, Lee H, Weissleder R. Supramolecular Host-Guest Interaction for Labeling and Detection of Cellular Biomarkers. Angew Chem Int Ed Engl. 2011;51:450–454. doi: 10.1002/anie.201105670. [DOI] [PMC free article] [PubMed] [Google Scholar]
Associated Data
This section collects any data citations, data availability statements, or supplementary materials included in this article.
Supplementary Materials
Figure S1. Fabrication of the micro-Hall detector (μHD).
Figure S2. Design of the flow-focusing microstructures.
Figure S3. Electrical setup and measurement of μHall sensors.
Figure S4. Computer-simulated Hall voltage.
Figure S5. Sensor array design.
Figure S6. Validation of sensor array with magnetic beads.
Figure S7. Effect of MNP-incubation time.