

Abstract
Codon usage bias (CUB) in Drosophila is higher for X-linked genes than for autosomal genes. One possible explanation is that the higher effective recombination rate for genes on the X chromosome compared with the autosomes reduces their susceptibility to Hill–Robertson effects, and thus enhances the efficacy of selection on codon usage. The genome sequence of D. melanogaster was used to test this hypothesis. Contrary to expectation, it was found that, after correcting for the effective recombination rate, CUB remained higher on the X than on the autosomes. In contrast, an analysis of polymorphism data from a Rwandan population showed that mean nucleotide site diversity at 4-fold degenerate sites for genes on the X is approximately three-quarters of the autosomal value after correcting for the effective recombination rate, compared with approximate equality before correction. In addition, these data show that selection for preferred versus unpreferred synonymous variants is stronger on the X than the autosomes, which accounts for the higher CUB of genes on the X chromosome. This difference in the strength of selection does not appear to reflect the effects of dominance of mutations affecting codon usage, differences in gene expression levels between X and autosomes, or differences in mutational bias. Its cause therefore remains unexplained. The stronger selection on CUB on the X chromosome leads to a lower rate of synonymous site divergence compared with the autosomes; this will cause a stronger upward bias for X than A in estimates of the proportion of nonsynonymous mutations fixed by positive selection, for methods based on the McDonald–Kreitman test.
Keywords: Drosophila melanogaster, codon usage, effective population size, recombination, Hill–Robertson interference, gene expression
Introduction
The genetic code is degenerate, such that most amino acids are encoded by more than one synonymous codon. In a wide variety of organisms, the frequencies with which such synonymous codons occur are nonrandom, that is, there is codon usage bias (CUB). In organisms such as Drosophila, many bacteria and yeast, there is much evidence that CUB is at least in part a result of natural selection, acting either on translational accuracy or on translational efficiency (McVean and Charlesworth 1999, see figure 4). A striking observation on several Drosophila species is that CUB is higher on the X chromosome than on the autosomes (Singh et al. 2005a, 2005b, 2008), and neo-X chromosomes seem to be evolving higher levels of CUB than their autosomal ancestors (Singh et al. 2008; Vicoso et al. 2008).
There are several possible reasons for the higher CUB for genes on the X chromosome. Stronger selection on X-linked loci when the disfavored allele is recessive or partially recessive could potentially cause such an effect (McVean and Charlesworth 1999; Singh et al. 2005a; Vicoso and Charlesworth 2009a). Higher CUB of X-linked genes could be favored if dosage compensation is incomplete, by compensating for lower levels of X chromosome gene expression in males (Singh et al. 2005a). Finally, higher levels of gene expression in females for genes on the X chromosome (Gupta et al. 2006; Sturgill et al. 2007) could lead to higher CUB on the X, because high levels of gene expression appear to be associated with stronger selection for CUB (Duret and Mouchiroud 1999; Drummond and Wilke 2009; Zeng and Charlesworth 2009), and X-linked genes spend two-thirds of their time in females, and only one-third of their time in males.
Another possible explanation is the difference in effective recombination rates between X-linked and autosomal genes, and the implications of this difference for the effectiveness of selection. The recombination rate is known to affect the efficacy of selection, due to Hill–Robertson interference (HRI) among linked loci under selection. Consistent with this, CUB in Drosophila is reduced in genomic regions with little or no recombination (Kliman and Hey 1993; Haddrill et al. 2007; Campos et al. 2012). The rate of recombination on the X chromosome and autosomes differs between males and females in Drosophila, because males lack meiotic crossing over and gene conversion (Ashburner et al. 2005). The appropriate sex-averaged recombination rate for the X that is relevant to population genetic processes is thus two-thirds of the female recombination rate, as opposed to one-half for autosomal genes (Langley et al. 1988); such averaging provides estimates of the “effective” recombination rates (Charlesworth 2012b). This means that X-linked genes will be less subject than autosomal genes to the effects of HRI from selection at linked sites (Vicoso and Charlesworth 2009a; Charlesworth 2012b), which could contribute to the higher CUB for the X chromosome (Singh et al. 2005a, 2008).
The aim of this study is to use the genome sequence of D. melanogaster to determine the influence of the difference in effective recombination rate between X and autosomes on CUB, taking into account possible confounding effects of several factors known to influence CUB, such as the level of gene expression, protein length, GC content and divergence (Duret and Mouchiroud 1999; Singh et al. 2005b; Zeng and Charlesworth 2009). This was done by examining whether the difference in CUB between the X chromosome (X) and autosomes (A) is removed if we compare X-linked and autosomal genes with similar effective recombination rates. In addition, to assess whether there is a difference in the effective population sizes between X-linked and autosomal genes with comparable effective recombination rates (cf. Vicoso and Charlesworth 2009a), we used whole genome resequencing data from a Rwandan population (http://www.dpgp.org, last accessed January 7, 2013) to compare diversity levels and the strength of selection on variants affecting codon usage at autosomal and X-linked loci.
Materials and Methods
Coding Sequences
Coding regions of the D. melanogaster genome (Release 5.34) were obtained from FlyBase (www.flybase.org, last accessed January 7, 2013). We excluded genes located within the heterochromatic nonrecombining regions and euchromatic genes with very low recombination rates (<0.05 cM/Mb) (Charlesworth 1996; Smith et al. 2007).
Recombination Rate Estimates
We divided each chromosome into 200 kb bins and calculated the recombination rate in each bin using the D. melanogaster recombination rate calculator available from http://petrov.stanford.edu/cgi-bin/recombination-rates_updateR5.pl (last accessed January 7, 2013) (Fiston-Lavier et al. 2010). We used the mid-coordinate of each gene to assign it to a recombination bin. Sex-averaged recombination rates were obtained by multiplying the recombination estimates for genes located on autosomal regions by one-half and those on the X by two-thirds (see Introduction). To analyze genes on the X and autosomes with similar effective recombination rates, an “overlap region” within the range 1–2.1 cM/Mb was defined (oX, X chromosome overlap region; oA, autosomal overlap region), which contains only those genes for which the effective recombination rates are similar. We also subdivided the overlap region into three groups with respect to their recombination rates: low (1 to <1.40 cM/Mb), intermediate (1.4 to <1.75 cM/Mb), and high (1.75 to < 2.1 cM/Mb). Analyses were also conducted on the “full” range of effective recombination rates, over the range 0.05–2.75 cM/Mb.
We also used an alternative measure of recombination in the middle of each chromosome. This measure assumes that map distance is approximately linearly related to physical position in the middle of each of the D. melanogaster arm chromosomes (Charlesworth 1996), avoiding the need to fit a polynomial equation to the data in this region (supplementary material 1, Supplementary Material online). The results of analyses using this measure were very similar to those presented later.
Variables Analyzed
Estimates of the level of CUB from the frequency of optimal codons, Fop, were calculated using Codonw (Peden 1999). The GC content of genes was estimated for the third positions of codons (GC3) and for the short introns (≤80 bp; see Halligan and Keightley 2006) of the selected isoform (GCI), following removal of 8 bp/30 bp at the beginning/end of the introns, and masking of possible exonic sequences to exclude any sites that may be subject to selective constraints within the selected introns. Gene lengths were measured by the lengths of the coding sequence (CDS). We used D. yakuba as an outgroup to estimate the ratio of 0-fold divergence to 4-fold divergence (K0/K4) using the Kimura two-parameter correction (Kimura 1980), because it has enough divergence from D. melanogaster to avoid any major effects of ancestral polymorphisms, and its genome is well annotated with high coverage (9.1X) (Clark et al. 2007). Details of the criteria used to obtain orthologous coding sequences are described by Campos et al. (2012).
Diversity Estimates
To estimate nucleotide site diversities (π), we used sequence data on a population of D. melanogaster from Gikongoro (RG) in Rwanda, available from the Drosophila Population Genomics Project (DPGP: http://www.dpgp.org/, last accessed January 7, 2013). We chose genomes and individuals with a sequencing depth coverage of 25X (the RG primary core), from a total of 22 lines. We selected a minimum quality value of 31 and masked any regions below that threshold. Moreover, we masked regions showing evidence of putative cosmopolitan admixture (recent gene flow from outside Africa), as identified by an identity by descent analysis carried out by the DPGP. Any ambiguous nucleotides were masked as well. We used the script dpgp_fastq_2_fasta.pl (provided by the DPGP) to convert and mask the FastQ files into fasta files. Because of masked sites, 22 alleles were not always available for each site, so we calculated composite estimates of π at 0-fold (π0) and 4-fold (π4) sites. For a given site, π was estimated as the product of k/(k − 1) and 1 − ∑pi2, where pi is the frequency of the ith variant at the site, and k is the number of alleles sequenced (Nei 1987, p. 256). We calculated π for all sites with the same k, and provide a weighted average of π according to the number of sites in each k category. We rejected any sites where we had fewer than 15 unmasked alleles.
Gene Expression Data
As described by Campos et al. (2012), we used RNAseq gene expression available for D. melanogaster in FlyBase (2012). For each D. melanogaster gene, we analyzed the levels of gene expression in adults for females and males separately, as the average expression of the three adult stages available (1, 5, and 30 days). We analyzed gene expression as log2 (RPKM + 1), where RPKM is reads per kilobase of exon per million mapped reads. We also calculated an overall level of gene expression for each gene across all the developmental stages of the data set; for autosomal genes, we used the average of the two sexes, whereas for X chromosomal genes we used a weighted average of 2/3 for females and 1/3 for males, reflecting the mean time that an X chromosome spends in each sex.
Final Data Set
The final data set included only genes with expression data (RPKM > 0), a K4 >0 and <0.50, amino acid length > 29, percentage of amino acid sequence identity more than 50%, less than 50% gaps, and the presence of a single orthologous gene in D. yakuba. The number of genes analyzed in this study were 6,604 (569X, 6035A) for the overlap region and 9,224 (1545X, 7679A) for the full set.
Statistical Analyses
We used the Mann–Whitney U test (two-tailed) to compare data sets. We controlled for the false discovery rate (FDR) by the method of Benjamini and Hochberg (1995), implemented in the package multtest (Pollard et al. 2005), with a FDR threshold of 0.05. For each data set and variable, we calculated the mean and estimated a confidence interval (CI) by bootstrapping across genes. We performed paired one-sided Wilcoxon tests to examine whether the mean level of gene expression in females is higher than that in males.
We calculated partial correlations between Fop and recombination rate, CDS length, gene expression and GCI, whereas controlling for their covariates (K0, K4, effective recombination rate, overall gene expression, GCI and CDS length), using the R function “pcor.test” (a variance-covariance matrix method) available at http://www.yilab.gatech.edu/pcor.R (last accessed January 7, 2013) (Kim and Yi 2006); we report Spearman’s nonparametric correlation coefficients, with 95% CIs obtained by bootstrapping across genes.
Estimating Selection on CUB, and Mutational and Demographic Parameters
An extension of the method of Zeng and Charlesworth (2009, 2010a) was used to test for differences in the intensity of selection on codon bias and the effective population size between autosomal and X-linked genes in the overlap region. This model infers the parameters from DNA sequence polymorphism data, and takes account of the potential effects of recent population size changes by allowing a one-step change in population size. Let Ne be the effective population size of the autosomes before this change. The scaled mutation rates away from and towards the unpreferred codons are θ = 4Neu and κθ, respectively, where u is the “raw” mutation rate from unpreferred to preferred codons. The ratio of the effective population size of the X chromosome to that of the autosomes is denoted by λ, so that the effective size of the X chromosome is λNe. On the assumption of semidominance, selection on CUB can be characterized by γX = 4λNesX and γA = 4NesA, where sX and sA are the selection coefficients for heterozygotes for the X and autosomes, respectively. The population is assumed to be at statistical equilibrium until t generations ago, at which point its size changes g-fold instantly, such that the effective population sizes become gNe for the autosomes and gλNe for the X chromosome, respectively. Following previous usage, we define the scaled time as τ = t/(2gNe).
The full model, denoted by L1, thus has seven parameters—θ, κ, γX, γA, λ, g, and τ. When g = 1 and/or τ = ∞, L1 reduces to a model with constant population size, denoted by L0. The log-likelihood of the data under L0 and L1 can be calculated using equations (1) and (2) of Haddrill et al. (2011). Maximum likelihood (ML) estimates of the parameters were searched for by using multidimensional optimization algorithms without derivatives (see Press et al. 1992, section 10.4; Lau 2003, section 5.2.4). Multiple random starting points were used to initialize the algorithms, and the algorithms were iterated until they converged.
Results
Codon Usage and GC Content of Genes on X and A
For genes over the full range of recombination rates, the mean effective recombination rate (Rec) for X genes was higher than for A genes (RecX = 2.08 cM/Mb vs. RecA = 1.39 cM/Mb; P < 10−16; table 1). Consistent with the results of previous studies (Singh et al. 2005a; Gupta et al. 2006; Sturgill et al. 2007; Zhang and Oliver 2007), X chromosome genes, in both the full data set and the overlap region, had significantly higher levels of Fop, GC content, gene expression in females and CDS length than autosomal genes (table 1). The mean X/A ratio for Fop was 1.06 (CI = 1.05–1.07) and 1.08 (CI = 1.06–1.09), for the whole and overlap regions, respectively, despite the longer average coding sequence length of genes on the X chromosome, and the well-known negative association between gene length and Fop (Duret and Mouchiroud 1999). The level of gene expression (exp.) in males was similar for X and A in the full data set (X male exp. = 9.45, A male exp. = 9.50, P = 0.204; table 1), but marginally significantly higher for A than X in the overlap region (X male exp. = 9.32, A male exp. = 9.48, P = 0.034; table 1).
Table 1.
Variables Analyzed for the Full and Overlap Region Data Sets.
| X | A | P | |
|---|---|---|---|
| N | 1,545 | 7,679 | |
| Rec | 2.08 (2.05–2.11) | 1.39 (1.37–1.40) | <10−16 |
| Fop | 0.551 (0.546–0.555) | 0.518 (0.516–0.520) | <10−16 |
| GC3 | 0.688 (0.683–0.692) | 0.641 (0.639–0.643) | <10−16 |
| GCI | 0.393 (0.387–0.400) | 0.352 (0.349–0.355) | <10−16 |
| π0 | 0.00130 (0.00122–0.00137) | 0.00162 (0.00157–0.00166) | 3 × 10⁻¹⁰ |
| π4 | 0.0152 (0.0147–0.0157) | 0.0159 (0.0156–0.0162) | 0.675 |
| π4 corrected | 0.0203 (0.00196–0.0021) | 0.0159 (0.0156–0.0162) | <10−16 |
| K0 | 0.040 (0.037–0.042) | 0.038 (0.037–0.039) | 0.069 |
| K4 | 0.240 (0.236–0.244) | 0.248 (0.246–0.250) | 6 × 10⁻⁵ |
| Overall exp. | 9.90 (9.80–10.0) | 9.78 (9.73–9.83) | 0.206 |
| Female exp. | 9.09 (8.90–9.27) | 8.30 (8.21–8.39) | 2 × 10⁻¹³ |
| Male exp. | 9.45 (9.33–9.58) | 9.50 (9.44–9.56) | 0.204 |
| CDS length | 538 (514–563) | 493 (484–502) | 7 × 10⁻⁴ |
| oX | oA | P | |
| N | 569 | 6,035 | |
| Rec. | 1.61 (1.58–1.63) | 1.61 (1.60–1.62) | 0.606 |
| Fop | 0.558 (0.551–0.566) | 0.519 (0.516–0.521) | <10−16 |
| GC3 | 0.698 (0.690–0.705) | 0.642 (0.640–0.644) | <10−16 |
| GCI | 0.418 (0.408–0.430) | 0.351 (0.348–0.354) | <10−16 |
| π0 | 0.00123 (0.0011–0.00136) | 0.00177 (0.00172–0.00182) | <10−16 |
| π4 | 0.0129 (0.0121–0.0135) | 0.0181 (0.0178–0.0184) | <10−16 |
| π4 corrected | 0.0171 (0.0163–0.0180) | 0.0181 (0.0178–0.0184) | 0.061 |
| K0 | 0.041 (0.037–0.044) | 0.038 (0.037–0.039) | 0.034 |
| K4 | 0.238 (0.231–0.244) | 0.248 (0.246–0.250) | 8 × 10⁻⁴ |
| Overall exp. | 9.88 (9.70–10.04) | 9.78 (9.72–9.84) | 0.508 |
| Female exp. | 9.14 (8.86–9.40) | 8.28 (8.19–8.39) | 8 × 10⁻⁷ |
| Male exp. | 9.32 (9.09–9.52) | 9.48 (9.41–9.55) | 0.034 |
| CDS length | 541 (503–575) | 498 (488–509) | 0.004 |
Note.—For each variable, we report the mean with 95% CIs in parentheses. We examined four regions: X, A, oX, and oA. P, adjusted P value of the Mann–Whitney U test for differences between X and A (italicized values show significant results P < 0.05); π4 corrected for the X are the raw values multiplied by 4/3; Rec, effective recombination rate (cM per MB times 2/3 for X and 1/2 for A); GC3, GC content of third codon positions; GCI, GC content of short introns (<80 bp); Exp.: gene expression as measured by log2 (mean RPKM + 1); CDS length, coding sequence length in number of amino acids.
In each of the overlap regions considered separately, the mean effective recombination rate was similar for the X and A genes (Rec = 1.61, P = 0.6; table 1), with a fairly narrow range of values within each category (table 2). There were significantly higher levels of Fop, GC3 and GCI for X versus A in the low and intermediate recombination regions, but not for the high recombination regions (table 2), with the exception of GC3, which was significantly higher for the X in all regions. The mean X/A ratio for Fop was significantly above one for the low and intermediate recombination regions (95% CI: 1.06–1.09 and 1.05–1.09, respectively), but not for the high recombination region (CI: 0.998–1.05). The top left panel of figure 1 shows that Fop for the X is consistently higher than for A for the same effective recombination rate over much of the range of recombination rates.
Table 2.
Variables Analyzed for the Three Subsets of the Overlap Regions with Respect to Recombination Rate: Low (1–1.4 cM/Mb), Intermediate (1.40–1.75 cM/Mb), and High (1.75–2.1 cM/Mb).
| Low oX | Low oA | P | |
|---|---|---|---|
| N | 167 | 1,089 | |
| Rec | 1.21 (1.20–1.23) | 1.24 (1.23–1.24) | 0.133 |
| Fop | 0.596 (0.584–0.608) | 0.508 (0.502–0.513) | <10−16 |
| GC3 | 0.741 (0.731–0.753) | 0.629 (0.623–0.635) | <10−16 |
| GCI | 0.477 (0.459–0.494) | 0.345 (0.338–0.353) | <10−16 |
| π0 | 0.00118 (0.00092–0.00139) | 0.00173 (0.00161–0.00185) | <10−16 |
| π4 | 0.0103 (0.0092–0.0114) | 0.0153 (0.0147–0.0159) | 3 × 10⁻⁹ |
| π4 corrected | 0.0137 (0.0123–0.0151) | 0.0153 (0.0147–0.0159) | 0.115 |
| K0 | 0.039 (0.033–0.045) | 0.039 (0.037–0.042) | 0.504 |
| K4 | 0.226 (0.215–0.237) | 0.249 (0.244–0.254) | 0.001 |
| Overall exp. | 10.19 (9.90–10.50) | 9.71 (9.57–9.86) | 0.030 |
| Female exp. | 9.70 (9.22–10.17) | 7.94 (7.70–8.19) | 3 × 10⁻⁸ |
| Male exp. | 9.73 (9.40–10.04) | 9.22 (9.06–9.39) | 0.184 |
| CDS length | 548 (463–621) | 504 (477–532) | 0.270 |
| Intermediate oX | Intermediate oA | P | |
| N | 193 | 3,195 | |
| Rec | 1.58 (1.56–1.59) | 1.59 (1.59–1.59) | 0.162 |
| Fop | 0.564 (0.554–0.575) | 0.527 (0.523–0.530) | 8 × 10⁻⁹ |
| GC3 | 0.708 (0.698–0.719) | 0.652 (0.648–0.655) | <10−16 |
| GCI | 0.431 (0.415–0.444) | 0.357 (0.352–0.361) | 3 × 10⁻¹⁴ |
| π0 | 0.00116 (0.00095–0.00134) | 0.00172 (0.00165–0.00179) | 1 × 10⁻⁵ |
| π4 | 0.0127 (0.0115–0.0137) | 0.0179 (0.0175–0.0183) | 3 × 10⁻¹⁰ |
| π4 corrected | 0.0169 (0.0154–0.0184) | 0.0179 (0.0175–0.0183) | 0.298 |
| K0 | 0.041 (0.035–0.046) | 0.037 (0.036–0.038) | 0.097 |
| K4 | 0.245 (0.234–0.258) | 0.244 (0.241–0.247) | 0.853 |
| Overall exp. | 9.62 (9.33–9.91) | 9.77 (9.68–9.85) | 0.399 |
| Female exp. | 8.83 (8.38–9.28) | 8.33 (8.18–8.46) | 0.188 |
| Male exp. | 8.98 (8.60–9.39) | 9.49 (9.39–9.59) | <10−16 |
| CDS length | 503 (454–549) | 500 (485–514) | 0.130 |
| High oX | High oA | P | |
| N | 209 | 1,751 | |
| Rec | 1.95 (1.94–1.97) | 1.88 (1.88–1.89) | <10−16 |
| Fop | 0.523 (0.509–0.536) | 0.511 (0.507–0.515) | 0.133 |
| GC3 | 0.653 (0.642–0.665) | 0.633 (0.628–0.637) | 0.015 |
| GCI | 0.352 (0.335–0.369) | 0.345 (0.341–0.351) | 0.342 |
| π0 | 0.00133 (0.00111–0.00155) | 0.00188 (0.00178–0.00198) | <10−16 |
| π4 | 0.0151 (0.0138–0.0162) | 0.0203 (0.0198–0.0208) | 1 × 10⁻⁹ |
| π4 corrected | 0.0201 (0.0184–0.0216) | 0.0203 (0.0197–0.0209) | 0.908 |
| K0 | 0.042 (0.036–0.048) | 0.040 (0.038–0.042) | 0.417 |
| K4 | 0.240 (0.227–0.252) | 0.254 (0.250–0.258) | 0.010 |
| Overall exp. | 9.87 (9.59–10.2) | 9.86 (9.75–9.97) | 0.997 |
| Female exp. | 8.97 (8.49–9.46) | 8.42 (8.23–8.60) | 0.069 |
| Male exp. | 9.30 (8.96–9.63) | 9.61 (9.48–9.75) | 0.096 |
| CDS length | 570 (503–634) | 490 (470–511) | 0.040 |
Note.—P, adjusted P value of the Mann-Whitney U test for differences between X and A (italicized values show significant results, P < 0.05).
Fig. 1.

Pairwise relationships between several genomic variables. The variables considered are CUB (Fop), effective recombination rate (Rec), CDS length, overall gene expression, and GC content in short introns (GCI). The relationships between these variables are investigated in four different data sets: oA, autosomal genes in the overlap region; oX, X-linked genes in the overlap region; A, autosomal genes in the full data set which spans the full range of effective recombination rates; and X, X-linked genes in the full data set. We plot the Loess regression lines for each data set and pairwise comparison. We show the Spearman’s rank correlation coefficients and their significance (***P < 0.001; **P < 0.01; *P < 0.05).
A comparison of the three regions displays the previously observed tendency for Fop and the GC content of X chromosomal genes to decline substantially with the recombination rate (Singh et al. 2005b); in contrast, this effect is absent from the autosomes (table 2). The effect of recombination was confirmed by examining the partial correlations between Fop and recombination rate for the full data set and for all the genes in the overlap regions, holding expression level, K0, K4, GCI and coding sequence length constant (table 3 and fig. 1); the Spearman rank partial correlation coefficients (rS) are –0.077 (P = 0.019) and –0.315 (P = 10−10) for the whole X and overlap region of the X, respectively, but only –0.009 (P = 0.57) and –0.022 (P = 0.13) for the autosomes. The relationship between recombination and GCI shows a similar pattern, with highly significant rS values of –0.303 (P < 10−16) and –0.500 (P < 10−16) for the whole X and the overlap region, respectively, but nonsignificant (P > 0.1) values for the autosomes. In addition, Fop and GCI have significantly positive partial correlations for both the X genes (whole X rS = 0.260, P < 10−16; overlap X rS = 0.150, P = 0.003) and A genes (whole A rS = 0.273, P < 10−16; overlap A rS = 0.269, P < 10−16).
Table 3.
Relationships between Pairs of Variables Affecting CUB.
| Pair of Variables | Region |
Correlates | |||
|---|---|---|---|---|---|
| X | A | oX | oA | ||
| Fop∼Rec | −0.077 (0.019) | −0.009 (0.568) | −0.315 (1 × 10⁻¹⁰) | −0.022 (0.127) | Exp., K0, K4, GCI, CDS length |
| (−0.140/−0.015) | (−0.037/0.017) | (−0.411/−0.222) | (−0.052/0.012) | ||
| Rec∼GCI | −0.303 (<10−16) | −0.027 (0.120) | −0.500 (<10−16) | −0.026 (0.168) | None |
| (−0.362/−0.247) | (−0.053/−0.002) | (−0.582/−0.427) | (−0.055/0.005) | ||
| Fop∼GCI | 0.260 (<10−16) | 0.273 (<10−16) | 0.150 (0.003) | 0.269 (<10−16) | Rec, K0, K4, Exp., CDS length |
| (0.200/0.322) | (0.247/0.298) | (0.044/0.244) | (0.241/0.299) | ||
| Fop∼CDS length | −0.273 (<10−16) | −0.171 (<10−16) | −0.269 (3 × 10⁻⁸) | −0.164 (<10−16) | Rec, K0, K4, Exp., GCI |
| (−0.337/−0.217) | (−0.198/−0.144) | (−0.369/−0.175) | (−0.199/−0.133) | ||
| Fop∼Exp. | 0.242 (5 × 10⁻¹⁵) | 0.310 (<10−16) | 0.235 (2 × 10⁻⁶) | 0.298 (<10−16) | Rec, K0, K4, GCI, CDS length |
| (0.180/0.303) | (0.284/0.337) | (0.143/0.340) | (0.266/0.325) | ||
| Exp.∼GCI | 0.013 (0.68) | 0.007 (0.59) | 0.032 (0.53) | 0.015 (0.34) | Rec, K0, K4, Exp., CDS length, Fop |
| (−0.050/0.077) | (−0.022/0.034) | (−0.072/0.126) | (−0.019/0.048) | ||
Note.—Correlations among CUB (Fop), effective recombination rate (Rec), gene expression (Exp.), divergence levels (K0 and K4), and GC content in introns (GCI). The covariates whose effects were controlled for are shown in the last column. We examined four regions: X, A, oX, and oA. Spearman’s rank partial correlation coefficients and their significance levels (italicized values show significant results, P < 0.05) are displayed in brackets, 95% CIs for the correlations are shown below in parentheses.
Diversity Values for Sites on X and A
In the full data set, the mean nucleotide site diversities at 4-fold degenerate sites (π4) were similar on X and A, at 0.0152 and 0.0159, respectively (P = 0.67; table 1); if the X diversity values are multiplied by 4/3, their mean is significantly higher than that for the autosomes (4π4X/3 = 0.0203, π4A = 0.0159, P < 10−16; table 1). This indicates that in the full data set the mean X diversity is greater than three-quarters of the mean A diversity, the relation expected under neutrality when there is purely random variation in offspring number among both males and females (Wright 1931). Consistent with this, the 95% CI for the ratio of mean X diversity to mean A diversity does not overlap 3/4 (0.92–0.99). However, within the overlap region as a whole, we observed a significantly lower mean π4 for X than A (π4X = 0.0129 vs. π4A = 0.0181, P < 10−16; table 1), and the X and A values did not differ significantly after multiplying the X values by 4/3 (4π4X/3 = 0.0171 vs. π4A = 0.0181, P = 0.061; table 1). The 95% CIs of the ratio 4π4X/3π4A for the three subdivisions of the overlap region are [0.80, 0.99], [0.86, 1.04], and [0.91, 1.08], respectively, implying that the X/A diversity ratios for these regions do not differ significantly from three-quarters; if anything, they are slightly lower. In accordance with the results of earlier studies of the relation between recombination rate and silent site diversity (Charlesworth 2012a), if π4 is plotted against the effective recombination rate, it is seen to be highest for the high recombination regions for both X and A, and lowest for the low recombination regions; 4π4X/3 is similar to π4A for the same effective recombination rate over most of the range of recombination rates (fig. 2). Overall, these results agree with a previous analysis of a much smaller data set (Vicoso and Charlesworth 2009a).
Fig. 2.
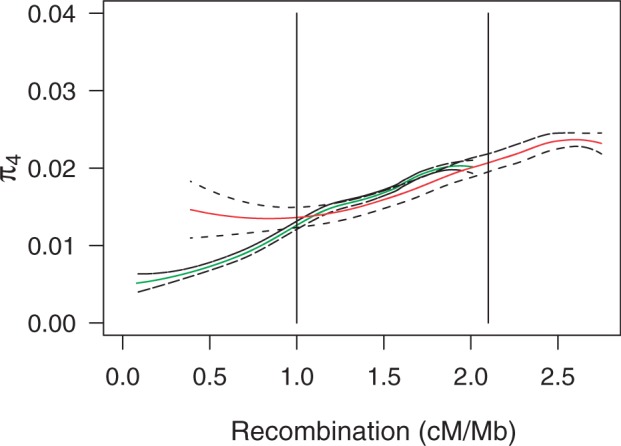
Effective recombination rate versus 4-fold synonymous diversity (π4) for the autosomes and 4-fold synonymous diversity multiplied by 4/3 (π4 corrected) for the X chromosome. Bold lines represent Loess regression lines, in green for the autosomal genes and in red for the X chromosome genes. Dashed lines represent the CIs for the lines. The two vertical lines indicate the lower and upper ends of the overlap region.
In contrast to the behavior of π4, table 1 shows that the diversities at 0-fold sites (π0) are much lower for the whole X chromosome than for the whole autosomes (π0X = 0.00130 vs. π0A = 0.00162, P = 3 × 10⁻¹⁰, π0X/π0A = 0.80; table 1), with a similar contrast in the overlap region (π0X = 0.00123 vs. π0A = 0.00177, P < 10−16; π0X/π0A = 0.70; table 1). A similar pattern is evident for the subdivisions of the overlap region, and π0 is only slightly affected by the recombination rate. These results are consistent with purifying selection against mutations that change the amino acid sequence of proteins, and with stronger purifying selection against X mutations compared with A mutations, possibly reflecting the effect of hemizygosity of the X in males in increasing the effectiveness of purifying selection (Vicoso and Charlesworth 2006).
Indeed, the X/A ratios for π0 are not far from the value of three-quarters expected for deleterious mutations at mutation-selection equilibrium when there is semidominance and equal strengths of selection on X and A in both sexes. However, when there is selection only on females for X-linked genes, and selection on both sexes for autosomal genes, regardless of the degree of dominance, the expected X/A ratio for π0 is 1.5 under mutation-selection equilibrium. Interestingly, under a second special case with selection only on females for X-linked genes, but selection on only one sex for autosomal genes, the expected X/A ratio would be again three-quarters (supplementary material 2, Supplementary Material online). Therefore, despite the evidence that the X chromosome of Drosophila is enriched for genes with female-biased expression relative to the autosomes (e.g., Sturgill et al. 2007; Meisel et al. 2012), and deficient in genes with male-biased expression, female-specific selection on X-linked genes cannot in itself account for the observed X/A ratio for π0, unless there is highly sex-specific selection on autosomal genes as well.
In contrast, there is no significant difference between the X and A with respect to K0 for the whole chromosome comparisons (K0X = 0.040 vs. K0A = 0.038, P = 0.07; table 1), and K0 is slightly higher for the X than A in the overlap region (K0X = 0.041 vs. K0A = 0.038, P = 0.034; table 1); K4 for X is significantly lower than for A in both cases (whole region: K4X = 0.240 vs. K4A = 0.248, P = 6 × 10⁻⁵; overlap region: K4X = 0.238 vs. K4X = 0.248, P = 8 × 10⁻⁴; table 1). Since theory suggests that the rate of fixation of deleterious mutations for the X should be the same as, or slower than, for the autosomes in Drosophila (Mank et al. 2010), the higher K0 for the X may reflect the substantial contribution of adaptive evolution to nonsynonymous divergence in Drosophila (Sella et al. 2009), which could partially obscure the contribution from the fixation of slightly deleterious mutations. The result for K4, which has also been seen in other contexts (Vicoso et al. 2008; Haddrill et al. 2010), probably reflects the higher intensity of selection for codon usage on the X versus the A (see Discussion).
Estimates of Demography and Selection on CUB
We analyzed synonymous polymorphisms in the overlap region using the model of Haddrill et al. (2011) to detect differences in selection on codon usage and effective population sizes between X and A (see Material and Methods). ML analyses suggest that an L1 model with recent population expansion fits the data significantly better than the L0 model with constant population size (χ2 = 2,744; P < 10−16; table 4). In agreement with the results regarding π4 described earlier, the ML estimate of λ is 0.75 under L1. A model that assumed equal selection intensities on codon usage for the X and A (i.e., sX = sA; second to last line of table 4) fitted significantly less well than the more general model, implying that the selection coefficients for preferred versus unpreferred codons are larger on the X than A (χ2 = 916.7; P < 10−16). Finally, we found that the full L1 model explains the data much better than a reduced model with γX = γA (last line of table 4; χ2 = 1,711; P < 10−16), suggesting a higher intensity of selection for codon usage on the X chromosome.
Table 4.
Estimates of selection, mutation, and demographic parameters for the overlap region.
| Model | Parameter Estimates |
ln L | ||||||
|---|---|---|---|---|---|---|---|---|
| γX | γA | θ | κ | λ | g | τ | ||
| L0 | 1.70 | 1.53 | 0.0045 | 3.91 | 0.79 | — | — | −2,366,568.26 |
| L1 | 1.53 | 1.36 | 0.0042 | 3.33 | 0.75 | 4.00 | 0.02 | −2,365,196.24 |
| L1 (γX = λγA) | — | 1.50 | 0.0012 | 4.31 | 1.11 | 5.57 | 2.46 | −2,365,654.57 |
| L1 (γX = γA) | 1.39 | — | 0.0043 | 3.37 | 0.67 | 5.11 | 0.01 | −2,366,051.67 |
Note.—γA = 4NesA and γX = 4λNesX, where Ne and λNe are the effective population sizes for autosomal and X-linked loci, respectively; sA and sX are the corresponding heterozygous selection coefficients.
As a further test for selection, we used the fact that, on the null hypothesis of neutrality, the site-frequency spectrum when θ is small should be symmetrical about 0.5 regardless of the degree of mutational bias (e.g., Charlesworth and Charlesworth 2010, p. 238); this is true even in the face of changes in population size (see Zeng and Charlesworth 2010b, Appendix). This procedure thus provides a fairly robust test for selection. Figure 3 compares the frequency spectra for preferred versus unpreferred variants at polymorphic synonymous sites in the overlap region. It can be seen that X-linked unpreferred variants tend to segregate at lower frequencies than their autosomal counterparts (30.2% vs. 34.8%), and a one-tailed Mann–Whitney U test shows that the difference is statistically highly significant (P < 10−15).
Fig. 3.

Frequency spectra at polymorphic synonymous sites for the overlap regions of the X chromosome (oX) and the autosomes (oA).
Discussion
Diversity Values on the X Chromosome and Autosomes
African populations are thought to be much closer to the ancestral state for D. melanogaster than the European and North American populations that have been much more intensively studied, where silent site diversity on the X is much smaller than for the autosomes (Haddrill et al. 2005; Hutter et al. 2007; Pool and Nielsen 2007, 2008). Our results agree with previous findings that overall silent nucleotide site diversity on the X in African populations is similar in magnitude to that for the autosomes (Andolfatto 2001; Glinka et al. 2003; Hutter et al. 2007; Singh et al. 2007). But Vicoso and Charlesworth (2009a) found that the ratio of mean diversity values for X-linked and autosomal loci with similar effective recombination rates is close to the value of three-quarters expected with purely random variation in offspring number in males and females (Wright 1931). Our analyses confirm this conclusion, using a much larger data set.
In contrast, in D. pseudoobscura and D. miranda, the ratio of X to A synonymous diversities does not differ significantly from three-quarters (Haddrill et al. 2010, 2011). The difference in X/A diversity ratios between East African D. melanogaster and the other two species is consistent with the lower effective recombination rate per basepair in D. melanogaster compared with the other two species, which increases the ability of hitchhiking effects such as background selection to cause differences between them (Charlesworth 2012b). The results described here are thus consistent with the hypothesis that hitchhiking effects are responsible for the elevated overall effective population size experienced by genes on the X chromosome in East African populations of D. melanogaster, relative to that predicted by the standard neutral model (Vicoso and Charlesworth 2009a).
The Causes of the Differences in CUB and GC Content between the X Chromosome and the Autosomes
Our analyses of the D. melanogaster genome sequences suggest that CUB (measured by Fop and γ), and the GC content at both third coding positions (GC3) and putatively neutral short introns (GCI), appear to be higher overall for the X than for the autosomes (table 1), as has been reported previously (Singh et al. 2005a, 2005b, 2008). The same can be seen in overlap regions with low and intermediate recombination rates, although this is not true for CUB and GCI in the high recombination overlap region (table 2). We now consider the evidence concerning the possible causes of these patterns.
Hill–Robertson Effects
These results regarding CUB and GC contents contrast with the findings discussed earlier for synonymous diversity in East African populations of D. melanogaster, which suggest that the mean effective population size for the X (NeX) is about three-quarters of that for the autosomes (NeA) for loci in the overlap regions (tables 1, 2, and 4; fig. 2), but that there are approximately equal chromosome-wide values of NeX and NeA (table 1). If the X versus A differences in CUB were caused solely by differences in Ne due to HRI, we would not expect to see stronger selection on CUB for X versus A in the overlap regions, because with λ ≈ 3/4, we expect γX ≈ γA on the assumption of semidominance and equal selection coefficients in males and females (Vicoso and Charlesworth 2009b), similar considerations apply to GC content, as discussed in the following section. Furthermore, in D. pseudoobscura and D. miranda, CUB is also higher for X than A, and appears to have increased on the XR chromosome arm since its origin from an autosome (Singh et al. 2008; Vicoso et al. 2008; Haddrill et al. 2011), despite the fact that these species have a ratio of NeX to NeA close to 3/4 as discussed earlier. These results suggest very strongly that differences in the intensity of Hill–Robertson effects are not primarily responsible for the differences in CUB and base composition between X and A.
Biased Gene Conversion
Another factor that may influence CUB and GC content is biased gene conversion in favor of GC nucleotides (gBGC)—the production of a higher frequency of GC versus AT alleles in gametes heterozygous for GC/AT (Marais 2003). This affects CUB in a way similar to selection for preferred codons, because 21/22 preferred codons in D. melanogaster end in G or C (Zeng 2010). As there is no meiotic exchange of any kind between homologs in male Drosophila (Ashburner et al. 2005), gBGC differentially affects X and A, because X chromosomes spend 2/3 of their time in females as opposed to the 1/2 spent by the autosomes; it also behaves like weak selection on a semidominant allele (Gutz and Leslie 1976; Nagylaki 1983a, 1983b), and so its strength should be affected by Hill–Robertson effects in a similar way to selection on synonymous sites, as discussed earlier.
The change per generation in the frequency q of a GC allele, caused by gBGC at a site segregating for GC versus AT, can be written as Δq = ω′q(1 – q), where ω′ (the rate of biased gene conversion) is equivalent to a selection coefficient. The parameter ω′ takes into account both the frequency of gene conversion events during meiosis and the extent to which these are biased in favor of GC (Charlesworth and Charlesworth 2010, p. 528–529). Because the X chromosome spends two-thirds of its time in females, where it is exposed to the possibility of gene conversion, the net rate of gBGC for an X-linked site (ω′X) is two-thirds of the rate in females (ωfX). Similarly, the corresponding selection coefficient for an autosomal site (ω′A) is ωfA/2, where ωfA is the autosomal rate of gBGC in females. Thus, ω′X/ω′A = 4ωfX/3ωfA.
The equilibrium value of the GC content of a stretch of sequence under mutation, gBGC and drift is determined jointly by Neω′ and the level of mutational bias in favor of GC > AT versus AT > GC mutations (Bulmer 1991; Charlesworth and Charlesworth 2010, p. 275, 529). If λ = NeX/NeA ≈ 3/4 in the overlap region, as suggested by the results on diversity discussed earlier, then NeX ω′X/NeA ω′A = ωfX/ωfA, that is, it is equal to the ratio of the rate of female BGC on the X to that for the autosomes. It follows that, if the level of mutational bias is similar for the two chromosomes, the relative equilibrium GC contents of X and A for the overlap region should increase with ωfX/ωfA; they are equal when ωfX/ωfA = 1. A recent study has shown that the rates of initiation of gene conversion events in female meiosis in D. melanogaster seem to be similar for X and A, and are relatively uniform across chromosomes (Comeron et al. 2012), except for the low recombination regions that have been excluded from this study. Furthermore, these authors did not find a positive correlation between GC content and gene conversion rate as postulated by the gBGC model (Marais 2003). It thus seems unlikely that ωfX/ωfA exceeds one for these genes, unless the extent of GC bias per conversion event is different for X and A. Although this possibility cannot be definitively excluded, it seems implausible that gBGC alone could account for the differences in base composition or Fop between X and A in the low- and intermediate-recombination frequency overlap regions.
Different Selection Pressures on X Genes Versus A Genes
The higher CUB and GC content of the X chromosome might be due to stronger selection for preferred codons and/or GC versus AT on X genes compared with A genes. This possibility is supported by our analysis of polymorphism data for the overlap regions in D. melanogaster (table 4 and fig. 3), consistent with results on D. pseudoobscura and D. miranda (Haddrill et al. 2011). With NeX = 3NeA/4, selection can be stronger on the X (as measured by γX and γA) because hemizygosity in males leads to higher sex-averaged selection coefficients for X-linked loci, which in turn enhances the efficacy of natural selection on CUB or GC content relative to the autosomes (McVean and Charlesworth 1999; Singh et al. 2005a; Vicoso and Charlesworth 2009b). Thus, the relative Fop or GC contents of the X versus A may depend on the dominance coefficient (h) with respect to the fitness effects of unpreferred mutations.
To investigate whether dominance could be the cause of the higher level of CUB observed in this study, we can compare the ratio of mean values of Fop for X versus autosomes (FopX/FopA) to the theoretical predictions of McVean and Charlesworth (1999), which assumed that selection coefficients were the same in both sexes. These show that a FopX/FopA value of approximately 1.002 is expected when h = 0, the most favorable case for stronger selection on the X (supplementary material 2, Supplementary Material online). As the lowest value for any of the CIs calculated for FopX/FopA in this study is above 1.002, except for the high recombination overlap region (where it is 0.998), it is unlikely that this effect alone can cause the higher CUB and GC content on the X, in agreement with the conclusions of Singh et al. (2005a). The intuitive reason for this is that the equilibrium level of CUB is controlled by the ratio of the fixation probability of mutations from unpreferred to preferred codons to that for mutations from preferred to unpreferred codons (Bulmer 1991, McVean and Charlesworth 1999). When NeX = 3NeA/4, recessivity for the fitness effects of unpreferred mutations (h < 0.5) reduces their probability of fixation on the X chromosome relative to the autosomes; it also reduces the probability of fixation of mutations from unpreferred to preferred codons on the X chromosome relative to the autosomes (Vicoso and Charlesworth 2009b). The two effects almost exactly cancel out.
We have also investigated the possible effects of female-specific selection when NeX = 3NeA/4 by extending the approach of McVean and Charlesworth (1999) for calculating the equilibrium frequencies of preferred codons in the genome under mutation, selection and drift (supplementary material 2, Supplementary Material online). For the same selection coefficient for X and A, the predicted equilibrium values of FopX/FopA with selection purely on females for X-linked genes, but on both sexes for autosomal loci, are always less than 1 and greater than about 0.6 for the γ values with highest likelihood shown in table 4, regardless of the value of h, as might be expected in view of the fact that there is less overall selection on the X-linked genes; the exact values depend on h and the extent of mutational bias. If there is female-specific selection on the X, and either mode of sex-specific selection on the autosomes, FopX/FopA is approximately 1, regardless of h and the level of mutational bias, which is in conflict with the observations. Dominance alone cannot, therefore, explain the observed pattern of higher codon usage on the X.
It is also worth noting that the X/A ratio of equilibrium synonymous diversity levels under selection for codon usage with semidominance and equal selection in both sexes is expected to be approximately 0.75, as is observed for the overlap region (table 1), whereas it is reduced to around 0.70 with h = 0.2 (McVean and Charlesworth 1999). However, with female-specific selection on the X and sex-specific selection of either type on the autosomes, application of the method of McVean and Charlesworth (1999) shows that the X/A ratio of synonymous diversities is 0.75, regardless of h and the level of mutational bias (supplementary material 2, Supplementary Material online). With female-specific selection on the X and no sex-specific selection on the autosomes, the results depend on both h and the degree of mutational bias. This suggests that selection on CUB either involves semidominance without sex-specific selection, or highly sex-specific selection for both X and A genes.
Overall, these results imply that selection coefficients acting on homozygous or hemizygous variants affecting Fop or GC content must be stronger on the X than the autosomes (see also Zeng and Charlesworth 2010a). In agreement with this conclusion, the scaled selection coefficient for the best-fitting model of semidominant selection (L1) was estimated from the polymorphism data to be higher on the X (γX = 1.53) than the autosomes (γA = 1.36) for the overlap region (table 4). For a selection model with semidominance, when λ = 0.75, as suggested by our results (table 4), the corresponding ratio of selection coefficients for genes on X versus A is equal to γX/γA (Vicoso and Charlesworth 2009b), that is, 1.53/1.36 = 1.12. This stronger selection at X linked loci for the overlap region of D. melanogaster is consistent with the pattern inferred in D. pseudoobscura and D. miranda (Haddrill et al. 2011).
The generally lower K4 values for X versus A (tables 1 and 2) lend further support to the suggestion of stronger net selection on codon usage on the X, whatever its source. Equations (6.10) and (6.11) of Charlesworth and Charlesworth (2010, p. 275) can be used to assess the approximate expected ratio of K4 for X to that for A, on the assumption of drift-mutation-selection equilibrium. The predicted ratio is given by
| (1) |
where subscripts X and A represent values for the X chromosome and autosomes, respectively. Using the estimates from tables 1 and 4, the predicted value of K4X/K4A is 0.968 for the overlap region, which is not significantly different from the observed ratio of 0.960.
The fact that K4 for the X chromosome is substantially lower than K4 for the autosomes because of selection on CUB, as was also found for D. pseudoobscura (Vicoso et al. 2008; Haddrill et al. 2010), means that caution must be used in interpreting the difference in K0/K4 between X and A in the overlap region (0.172 for X and 0.152 for A in table 1) as evidence for faster adaptive evolution of nonsynonymous mutations on the X; the difference in K0 is only marginally significant, whereas the difference in K4 is highly significant. Estimates of the proportions of nonsynonymous mutations fixed by positive selection (α), based on the comparison of the ratio of the numbers of 0-fold and 4-fold polymorphisms to K0/K4 (McDonald and Kreitman 1991; Fay et al. 2002; Smith and Eyre-Walker 2002), will be correspondingly more upwardly biased for the X than A. This casts some doubt on recent claims for a “faster-X” effect for D. melanogaster based on population genomic data (Langley et al. 2012; Mackay et al. 2012).
The good fit of the X/A ratio of K4 to the predictions of the effects of selection on CUB implies that it is unlikely that a higher male than female mutation rate explains the lower K4 for X than A. It has recently been suggested by Zhou and Bachtrog (2012) that the higher K4 with respect to D. pseudoobscura, observed for genes on the nonrecombining D. miranda neo-Y chromosome when compared with their counterparts on the neo-X chromosome, is due to a higher male mutation rate; however, this effect is also consistent with a relaxation of selection on CUB caused by the reduced effective population size of the neo-Y chromosome.
The Role of Gene Expression
Singh et al. (2005a) suggested that a higher level of CUB for X genes could have been selected for if dosage compensation of the X chromosome in males for the loss of function of its Y-linked partner is incomplete. However, this seems unlikely in view of the evidence for the high efficiency of the dosage compensation system in Drosophila (Lucchesi et al. 2005); moreover, the slightly higher level of gene expression in males than in females for X-linked genes (table 1) seems inconsistent with this possibility.
However, table 1 shows that the mean level of expression of X chromosome genes in female D. melanogaster is somewhat higher than that of autosomal genes (see also Gupta et al. 2006; Sturgill et al. 2007; Zhang and Oliver 2010). As higher gene expression levels are associated with stronger selection for CUB (Duret and Mouchiroud 1999; Drummond and Wilke 2008; Zeng and Charlesworth 2009), this pattern of gene expression might account for the higher level of CUB and GC3 on the X, because more weight is given to females than to males with respect to selection on the X when there is intermediate dominance, as has been already been emphasized several times. At the suggestion of a reviewer, we tested this possibility by examining the linear and Loess regressions of Fop for X and A separately, on the weighted average of adult female and male expression levels (see Material and Methods). As can be seen from supplementary material 3, Supplementary Material online, for the same expression level Fop for the overlap region of the X is consistently higher than Fop for the overlap region of A, except for the comparatively small number of genes with very high expression levels. This falsifies the hypothesis that a difference in expression level caused the differences in mean Fop between X and A. The cause of the apparent difference between X and A in selection intensity on CUB thus remains obscure.
Mutational Bias Effects and the Recombinational Landscape of Drosophila
In addition, it is hard to explain the higher GC content in short introns (GCI) on the X versus A, which is found both overall and in the low and intermediate recombination regions (tables 1 and 2), and the negative relationship between recombination rate and GC content/CUB on the X but not A. We first examine the question of the X/A difference in intronic GC content. A lower rate of GC > AT mutations relative to AT > GC mutations on the X compared with A could potentially explain the higher GC content of both coding and intronic sequences. The analysis of Zeng and Charlesworth (2010a), however, provided no support for a lower GC > AT mutational bias for X genes. We have also fitted a model of selection on codon usage for the overlap region, similar to that used to generate table 4, but allowing potentially different mutational biases for X and A (supplementary material 4, Supplementary Material online). If anything, the estimated mutational bias for X was greater than for A (κX = 4.17 vs. κA = 3.23). Thus, mutational bias per se seems to be incapable of explaining the X versus A differences in GC content or CUB.
The negative relationship between recombination rate and GC content/CUB on the X but not A (Singh et al. 2005b) also remains unexplained. This effect can be seen in the overlap regions as well as over the whole X (table 2 and fig. 1). Note, however, that regions of the X chromosome that lack crossing over, such as the pericentric and telomeric heterochromatin, have highly reduced Fop and GC contents, consistent with strong Hill–Robertson effects in these regions (Campos et al. 2012). Singh et al. (2005b) proposed that the recombinational landscape in the D. melanogaster euchromatin may have changed over a timescale shorter than that required for equilibration of CUB and base composition, converting a previously positive correlation between Fop/GC content and local recombination rate on the X into a negative one, and a positive correlation on the autosomes into a near-zero one.
Given the significantly higher values of mean π4 for the high versus the low recombination overlap regions, for both X and A (tables 1 and 2), it is clear that the negative relation between Fop/GC content and recombination rate for the X chromosome, and the lack of such a relation for the autosomes, are inconsistent with the assumption that their current values are at mutation-selection-drift equilibrium under the Ne values for the different recombination regions suggested by the diversity data. This supports the proposal of Singh et al. (2005b) and is consistent with other evidence that the D. melanogaster genome is out of equilibrium (reviewed by Zeng and Charlesworth 2010a). Genome-wide surveys of variability and divergence, as well as fine-scale genetic maps of D. melanogaster and its close relatives, should help to shed light on this problem.
Conclusions
Our analyses show that
When differences in effective recombination rates between X and A in Drosophila, mainly due to the lack of crossing over in males, are taken into account, the effective population size of the X in the Rwandan population of D. melanogaster (as estimated from 4-fold degenerate site diversity) is approximately three-quarters of that for the autosomes, the value expected with neutrality and random variation in offspring number.
In contrast, the level of CUB remains higher for the X than for the A when a similar adjustment for recombination rate is made.
This feature of CUB is consistent with estimates from polymorphism data that indicate stronger selection on variants affecting codon usage on X versus A in regions with comparable effective recombination rates.
The stronger selection on CUB on the X means that estimates of the rate of adaptive evolution of protein sequence evolution based on the McDonald–Kreitman test are more upwardly biased for the X than A.
We appear to have ruled out both dominance and the higher average level of expression in females of X genes compared with A genes as explanations for this stronger apparent selection for CUB on the X.
Mutational bias and biased gene conversion are also not capable of explaining these patterns. In addition, the higher GC content of short introns on X versus A, and the negative relation between recombination rate and codon usage on the X, remain to be explained.
Supplementary Material
Supplementary materials 1–4 are available at Molecular Biology and Evolution online (http://www.mbe.oxfordjournals.org/).
Acknowledgments
The authors are grateful to DPGP and, especially, John Pool for making these data available and for the support provided to analyze the data set. They thank Ian White for his statistical advice during this project. They gratefully acknowledge Dan Halligan and Thanasis Kousathanas for providing help with the polymorphism analysis. They gratefully acknowledge Pablo Librado and Filipe Vieira for help with the bioinformatic analyses. They thank the other members of the Charlesworth lab group for helpful discussions and comments. They are also grateful to two anonymous reviewers for their comments on the manuscript. J.C. was supported by the UK Biotechnology and Biological Sciences Research Council (grant number BB/H006028/1 to B.C.), P.R.H by a fellowship from the UK Natural Environment Research Council (grant number NE/G013195/1), and D.J.P. by an MSc student fellowship from UK Biotechnology and Biological Sciences Research Council.
References
- Andolfatto P. Contrasting patterns of X-linked and autosomal nucleotide variation in Drosophila melanogaster and Drosophila simulans. Mol Biol Evol. 2001;18:279–290. doi: 10.1093/oxfordjournals.molbev.a003804. [DOI] [PubMed] [Google Scholar]
- Ashburner M, Hawley S, Golic K. Drosophila: a laboratory handbook. 2nd ed. Cold Spring Harbor (NY): Cold Spring Harbor Laboratory Press; 2005. [Google Scholar]
- Benjamini Y, Hochberg Y. Controlling the false discovery rate: a practical and powerful approach to multiple testing. J Royal Stat Soc Ser B. 1995;57:289–300. [Google Scholar]
- Bulmer M. The selection-mutation-drift theory of synonymous codon usage. Genetics. 1991;129:897–907. doi: 10.1093/genetics/129.3.897. [DOI] [PMC free article] [PubMed] [Google Scholar]
- Campos JL, Charlesworth B, Haddrill PR. Molecular evolution in nonrecombining regions of the Drosophila melanogaster genome. Genome Biol Evol. 2012;4:278–288. doi: 10.1093/gbe/evs010. [DOI] [PMC free article] [PubMed] [Google Scholar]
- Charlesworth B. Background selection and patterns of genetic diversity in Drosophila melanogaster. Genet Res. 1996;68:131–149. doi: 10.1017/s0016672300034029. [DOI] [PubMed] [Google Scholar]
- Charlesworth B. The effects of deleterious mutations on evolution at linked sites. Genetics. 2012a;190:5–22. doi: 10.1534/genetics.111.134288. [DOI] [PMC free article] [PubMed] [Google Scholar]
- Charlesworth B. The role of background selection in shaping patterns of molecular evolution and variation: evidence from variability on the Drosophila X chromosome. Genetics. 2012b;191:233–246. doi: 10.1534/genetics.111.138073. [DOI] [PMC free article] [PubMed] [Google Scholar]
- Charlesworth B, Charlesworth D. Elements of evolutionary genetics. Greenwood Village (CO): Roberts & Company Publishers; 2010. [Google Scholar]
- Clark AG, Eisen MB, Smith DR, et al. (417 co-authors) Evolution of genes and genomes on the Drosophila phylogeny. Nature. 2007;450:203–218. doi: 10.1038/nature06341. [DOI] [PubMed] [Google Scholar]
- Comeron JM, Ratnappan R, Bailin S. The many landscapes of recombination in Drosophila. PLoS Genet. 2012;8:e1002905. doi: 10.1371/journal.pgen.1002905. [DOI] [PMC free article] [PubMed] [Google Scholar]
- Drummond DA, Wilke CO. Mistranslation-induced protein misfolding as a dominant constraint on coding-sequence evolution. Cell. 2008;134:341–352. doi: 10.1016/j.cell.2008.05.042. [DOI] [PMC free article] [PubMed] [Google Scholar]
- Drummond DA, Wilke CO. The evolutionary consequences of erroneous protein synthesis. Nat Rev Genet. 2009;10:715–724. doi: 10.1038/nrg2662. [DOI] [PMC free article] [PubMed] [Google Scholar]
- Duret L, Mouchiroud D. Expression pattern and, surprisingly, gene length shape codon usage in Caenorhabditis, Drosophila, and Arabidopsis. Proc Natl Acad Sci U S A. 1999;96:4482–4487. doi: 10.1073/pnas.96.8.4482. [DOI] [PMC free article] [PubMed] [Google Scholar]
- Fay JC, Wyckoff GJ, Wu C-I. Testing the neutral theory of molecular evolution with genomic data from Drosophila. Nature. 2002;415:1024–1026. doi: 10.1038/4151024a. [DOI] [PubMed] [Google Scholar]
- Fiston-Lavier A, Singh ND, Lipatov M, Petrov DA. Drosophila melanogaster recombination rate calculator. Gene. 2010;463:18–20. doi: 10.1016/j.gene.2010.04.015. [DOI] [PubMed] [Google Scholar]
- Glinka S, Ometto L, Mousset S, Stephan W, De Lorenzo D. Demography and natural selection have shaped genetic variation in Drosophila melanogaster: a multi-locus approach. Genetics. 2003;165:1269–1278. doi: 10.1093/genetics/165.3.1269. [DOI] [PMC free article] [PubMed] [Google Scholar]
- Gupta V, Parisi M, Sturgill D, Nuttall R, Doctolero M, Dudko OK, Malley JD, Eastman PS, Oliver B. Global analysis of X-chromosome dosage compensation. J Biol. 2006;5:3. doi: 10.1186/jbiol30. [DOI] [PMC free article] [PubMed] [Google Scholar]
- Gutz H, Leslie JF. Gene conversion: a hitherto overlooked parameter in population genetics. Genetics. 1976;83:861–866. doi: 10.1093/genetics/83.4.861. [DOI] [PMC free article] [PubMed] [Google Scholar]
- Haddrill PR, Halligan DL, Tomaras D, Charlesworth B. Reduced efficacy of selection in regions of the Drosophila genome that lack crossing over. Genome Biol. 2007;8:R18. doi: 10.1186/gb-2007-8-2-r18. [DOI] [PMC free article] [PubMed] [Google Scholar]
- Haddrill PR, Loewe L, Charlesworth B. Estimating the parameters of selection on nonsynonymous mutations in Drosophila pseudoobscura and D. miranda. Genetics. 2010;185:1381–1396. doi: 10.1534/genetics.110.117614. [DOI] [PMC free article] [PubMed] [Google Scholar]
- Haddrill PR, Thornton KR, Charlesworth B, Andolfatto P. Multilocus patterns of nucleotide variability and the demographic and selection history of Drosophila melanogaster populations. Genome Res. 2005;15:790–799. doi: 10.1101/gr.3541005. [DOI] [PMC free article] [PubMed] [Google Scholar]
- Haddrill PR, Zeng K, Charlesworth B. Determinants of synonymous and nonsynonymous variability in three species of Drosophila. Mol Biol Evol. 2011;28:1731–1743. doi: 10.1093/molbev/msq354. [DOI] [PubMed] [Google Scholar]
- Halligan DL, Keightley PD. Ubiquitous selective constraints in the Drosophila genome revealed by a genome-wide interspecies comparison. Genome Res. 2006;16:875–884. doi: 10.1101/gr.5022906. [DOI] [PMC free article] [PubMed] [Google Scholar]
- Hutter S, Li H, Beisswanger S, De Lorenzo D, Stephan W. Distinctly different sex ratios in African and European populations of Drosophila melanogaster inferred from chromosomewide single nucleotide polymorphism data. Genetics. 2007;177:469–480. doi: 10.1534/genetics.107.074922. [DOI] [PMC free article] [PubMed] [Google Scholar]
- Kim S, Yi SV. Understanding relationship between sequence and functional evolution in yeast proteins. Genetica. 2006;131:151–156. doi: 10.1007/s10709-006-9125-2. [DOI] [PubMed] [Google Scholar]
- Kimura M. A simple method for estimating evolutionary rates of base substitutions through comparative studies of nucleotide sequences. J Mol Evol. 1980;16:111–120. doi: 10.1007/BF01731581. [DOI] [PubMed] [Google Scholar]
- Kliman RM, Hey J. Reduced natural selection associated with low recombination in Drosophila melanogaster. Mol Biol Evol. 1993;10:1239–1258. doi: 10.1093/oxfordjournals.molbev.a040074. [DOI] [PubMed] [Google Scholar]
- Langley CH, Montgomery E, Hudson R, Kaplan N, Charlesworth B. On the role of unequal exchange in the containment of transposable element copy number. Genet Res. 1988;52:223–235. doi: 10.1017/s0016672300027695. [DOI] [PubMed] [Google Scholar]
- Langley CH, Stevens K, Cardeno C, et al. (18 co-authors) Genomic variation in natural populations of Drosophila melanogaster. Genetics. 2012;192:533–598. doi: 10.1534/genetics.112.142018. [DOI] [PMC free article] [PubMed] [Google Scholar]
- Lau HT. A numerical library in Java for scientists and engineers. 1st ed. Boca Raton (FL): Chapman and Hall; 2003. [Google Scholar]
- Lucchesi JC, Kelly WG, Panning B. Chromatin remodelling in dosage compensation. Annu Rev Genet. 2005;39:615–651. doi: 10.1146/annurev.genet.39.073003.094210. [DOI] [PubMed] [Google Scholar]
- Mackay TFC, Richards S, Stone EA, et al. (52 co-authors) The Drosophila melanogaster genetic reference panel. Nature. 2012;482:173–178. doi: 10.1038/nature10811. [DOI] [PMC free article] [PubMed] [Google Scholar]
- Mank JE, Vicoso B, Berlin S, Charlesworth B. Effective population size and the faster-X effect: empirical results and their interpretation. Evolution. 2010;64:663–674. doi: 10.1111/j.1558-5646.2009.00853.x. [DOI] [PubMed] [Google Scholar]
- Marais G. Biased gene conversion: implications for genome and sex evolution. Trends Genet. 2003;19:330–338. doi: 10.1016/S0168-9525(03)00116-1. [DOI] [PubMed] [Google Scholar]
- McDonald JH, Kreitman M. Adaptive protein evolution at the Adh locus in Drosophila. Nature. 1991;351:652–654. doi: 10.1038/351652a0. [DOI] [PubMed] [Google Scholar]
- McVean GAT, Charlesworth B. A population genetic model for the evolution of synonymous codon usage: patterns and predictions. Genet Res. 1999;74:145–158. [Google Scholar]
- Meisel RP, Malone JH, Clark AG. Disentangling the relationship between sex-biased gene expression and X-linkage. Genome Res. 2012;22:1255–1265. doi: 10.1101/gr.132100.111. [DOI] [PMC free article] [PubMed] [Google Scholar]
- Nagylaki T. Evolution of a large population under gene conversion. Proc Natl Acad Sci U S A. 1983a;80:5941–5945. doi: 10.1073/pnas.80.19.5941. [DOI] [PMC free article] [PubMed] [Google Scholar]
- Nagylaki T. Evolution of a finite population under gene conversion. Proc Natl Acad Sci U S A. 1983b;80:6278–6281. doi: 10.1073/pnas.80.20.6278. [DOI] [PMC free article] [PubMed] [Google Scholar]
- Nei M. 2nd ed. New York: Columbia University Press; 1987. Molecular evolutionary genetics. [Google Scholar]
- Peden JF. [Nottingham (United Kingdom)]: University of Nottingham; 1999. Analysis of codon usage [thesis] CodonW: Correspondence analysis of codon usage. Available from: http://codonw.sourceforge.net/ (last accessed January 7, 2013) [Google Scholar]
- Pollard K, Dudoit S, Van der Laan MJ. Berlin: Springer; 2005. Multiple testing procedures: R multtest package and applications to genomics. Bioinformatics and Computational Biology Solutions Using R and Bioconductor; pp. 251–272. [Google Scholar]
- Pool JE, Nielsen R. Population size changes reshape genomic patterns of diversity. Evolution. 2007;61:3001–3006. doi: 10.1111/j.1558-5646.2007.00238.x. [DOI] [PMC free article] [PubMed] [Google Scholar]
- Pool JE, Nielsen R. The impact of founder events on chromosomal variability in multiply mating species. Mol Biol Evol. 2008;25:1728–1736. doi: 10.1093/molbev/msn124. [DOI] [PMC free article] [PubMed] [Google Scholar]
- Press WH, Flannery BP, Teukolsky SA, Vetterling WT. Numerical recipes in C: the art of scientific computing. 2nd ed. Cambridge (United Kingdom): Cambridge University Press; 1992. [Google Scholar]
- Sella G, Petrov DA, Przeworski M, Andolfatto P. Pervasive natural selection in the Drosophila genome? PLoS Genet. 2009;5:e1000495. doi: 10.1371/journal.pgen.1000495. [DOI] [PMC free article] [PubMed] [Google Scholar]
- Singh ND, Davis JC, Petrov DA. X-linked genes evolve higher codon bias in Drosophila and Caenorhabditis. Genetics. 2005a;171:145–155. doi: 10.1534/genetics.105.043497. [DOI] [PMC free article] [PubMed] [Google Scholar]
- Singh ND, Davis JC, Petrov DA. Codon bias and noncoding GC content correlate negatively with recombination rate on the Drosophila X chromosome. J Mol Evol. 2005b;61:315–324. doi: 10.1007/s00239-004-0287-1. [DOI] [PubMed] [Google Scholar]
- Singh ND, Larracuente AM, Clark AG. Contrasting the efficacy of selection on the X and autosomes in Drosophila. Mol Biol Evol. 2008;25:454–467. doi: 10.1093/molbev/msm275. [DOI] [PubMed] [Google Scholar]
- Singh ND, Macpherson JM, Jensen JD, Petrov DA. Similar levels of X-linked and autosomal nucleotide variation in African and non-African populations of Drosophila melanogaster. BMC Evol Biol. 2007;7:202. doi: 10.1186/1471-2148-7-202. [DOI] [PMC free article] [PubMed] [Google Scholar]
- Smith C, Shu S, Mungall CJ, Karpen GH. The Release 5.1 annotation of Drosophila melanogaster heterochromatin. Science. 2007;316:1586–1591. doi: 10.1126/science.1139815. [DOI] [PMC free article] [PubMed] [Google Scholar]
- Smith NGC, Eyre-Walker A. Adaptive protein evolution in Drosophila. Nature. 2002;415:1022–1024. doi: 10.1038/4151022a. [DOI] [PubMed] [Google Scholar]
- Sturgill D, Zhang Y, Parisi M, Oliver B. Demasculinization of X chromosomes in the Drosophila genus. Nature. 2007;450:238–241. doi: 10.1038/nature06330. [DOI] [PMC free article] [PubMed] [Google Scholar]
- Vicoso B, Charlesworth B. Evolution on the X chromosome: unusual patterns and processes. Nat Rev Genet. 2006;7:645–653. doi: 10.1038/nrg1914. [DOI] [PubMed] [Google Scholar]
- Vicoso B, Charlesworth B. Recombination rates may affect the ratio of X to autosomal noncoding polymorphism in African populations of Drosophila melanogaster. Genetics. 2009a;181:1699–1701. doi: 10.1534/genetics.108.098004. [DOI] [PMC free article] [PubMed] [Google Scholar]
- Vicoso B, Charlesworth B. Effective population size and the faster-X effect: an extended model. Evolution. 2009b;63:2413–2426. doi: 10.1111/j.1558-5646.2009.00719.x. [DOI] [PubMed] [Google Scholar]
- Vicoso B, Haddrill PR, Charlesworth B. A multispecies approach for comparing sequence evolution of X-linked and autosomal sites in Drosophila. Genet Res. 2008;90:421–431. doi: 10.1017/S0016672308009804. [DOI] [PubMed] [Google Scholar]
- Wright S. Evolution in Mendelian populations. Genetics. 1931;16:97–159. doi: 10.1093/genetics/16.2.97. [DOI] [PMC free article] [PubMed] [Google Scholar]
- Zeng K, Charlesworth B. Estimating selection intensity on synonymous codon usage in a nonequilibrium population. Genetics. 2009;183:651–662. doi: 10.1534/genetics.109.101782. [DOI] [PMC free article] [PubMed] [Google Scholar]
- Zeng K, Charlesworth B. Studying patterns of recent evolution at synonymous sites and intronic sites in Drosophila melanogaster. J Mol Evol. 2010a;70:116–128. doi: 10.1007/s00239-009-9314-6. [DOI] [PubMed] [Google Scholar]
- Zeng K, Charlesworth B. The effects of demography and linkage on the estimation of selection and mutation parameters. Genetics. 2010b;186:1411–1424. doi: 10.1534/genetics.110.122150. [DOI] [PMC free article] [PubMed] [Google Scholar]
- Zeng K. A simple multiallele model and its application to identifying preferred-unpreferred codons using polymorphism data. Mol Biol Evol. 2010;27:1327–1337. doi: 10.1093/molbev/msq023. [DOI] [PubMed] [Google Scholar]
- Zhang Y, Oliver B. Dosage compensation goes global. Curr Opin Genet Dev. 2007;17:113–120. doi: 10.1016/j.gde.2007.02.002. [DOI] [PubMed] [Google Scholar]
- Zhang Y, Oliver B. An evolutionary consequence of dosage compensation on Drosophila melanogaster female X-chromatin structure? BMC Genomics. 2010;11:6. doi: 10.1186/1471-2164-11-6. [DOI] [PMC free article] [PubMed] [Google Scholar]
- Zhou Q, Bachtrog D. Sex-specific adaptation drives early sex chromosome evolution in Drosophila. Science. 2012;337:341–345. doi: 10.1126/science.1225385. [DOI] [PMC free article] [PubMed] [Google Scholar]
Associated Data
This section collects any data citations, data availability statements, or supplementary materials included in this article.