

Summary
Integrated genomic analyses revealed a miRNA-regulatory network, which further defined a robust integrated mesenchymal subtype associated with poor overall survival in 459 cases of serous ovarian cancer (OvCa) from The Cancer Genome Atlas and 560 cases from independent cohorts. Eight key miRNAs, including miR-506, miR-141 and miR-200a, were predicted to regulate 89% of the targets in this network. Follow-up functional experiments illustrate that miR-506 augmented E-cadherin expression, inhibited cell migration and invasion, and prevented TGFβ-induced epithelial-mesenchymal transition (EMT) by targeting SNAI2, a transcriptional repressor of E-cadherin. In human OvCa, miR-506 expression was correlated with decreased SNAI2 and VIM, elevated E-cadherin, and beneficial prognosis. Nanoparticle delivery of miR-506 in orthotopic OvCa mouse models led to E-cadherin induction and reduced tumor growth.
Introduction
Ovarian carcinoma (OvCa) is the most lethal gynecologic malignancy in the United States, with 22,280 new cases and 15,460 deaths estimated for 2012 (Siegel et al., 2012). The high rate of lethality from OvCa is primarily due to the advanced stage of disease at the time of diagnosis. Early-stage cancers can be cured in up to 90% of patients with current therapies (Bast et al., 2009), but these rates drop substantially in patients with advanced disease. Only approximately 30% of patients with advanced-stage OvCa survive five years after initial diagnosis (Jemal et al., 2004).
Unlike cancers in other organ sites, OvCa can spread by direct invasion to adjacent organs or by transport throughout the peritoneal cavity via peritoneal fluid (Naora and Montell, 2005). Because of the diffuse nature of OvCa, surgery alone rarely leads to complete tumor resection. Postoperative platinum and taxane chemotherapy is required. Although 70% of patients with OvCa initially experience a response to therapy, most eventually die of disease recurrence (Bast et al., 2009; Jemal et al., 2004). A better understanding of the mechanisms involved in OvCa invasion and more effective therapeutic approaches are urgently needed.
Emerging evidence suggests that acquisition of invasiveness in OvCa cells is accompanied by the loss of epithelial features and the gain of a mesenchymal phenotype, a process known as epithelial-to-mesenchymal transition (EMT) (Cao et al., 2011; Rosano et al., 2011). Tothill and colleagues investigated the gene expression profiles of 285 OvCa cases and reported that a mesenchymal subtype had relatively poor overall survival (Tothill et al., 2008). The recent publication by The Cancer Genome Atlas (TCGA) network recapitulated the mesenchymal subtype among close to 500 serous histological subtype of OvCa cases on the basis of transcriptome data (TCGA, 2011). However, there was no correlation between the transcriptome mesenchymal subtype and overall survival in the TCGA dataset. The driving molecular events behind the mesenchymal subtype in OvCa are poorly understood and need to be elucidated.
MiRNAs are a class of small non-coding RNA (~22 nt) that regulate gene expression by binding to the 3’-untranslated region (3’-UTR) of target genes triggering message RNA (mRNA) degradation or protein translation inhibition (Bagga et al., 2005). Almost 1000 miRNAs have been identified in the human genome and are thought to regulate 30% of the transcriptome (Esquela-Kerscher and Slack, 2006). Most recently, several miRNAs, including miR-200 family members have been found to regulate EMT by targeting E-cadherin repressors ZEB1 and ZEB2 (Gregory et al., 2008; Park et al., 2008).
In this study, we took an integrated approach and analyzed multiple-dimensional data from 459 serous OvCa cases in TCGA in order to uncover the underlying molecular network of mesenchymal subtype of ovarian cancer.
Results
Identification of TCGA mesenchymal signature gene sets associated with DNA copy number alterations, promoter methylation, and miRNA expression
A consensus clustering analysis of expression data among serous OvCa cases led to the identification of four transcriptional subtypes: differentiated, immunoreactive, proliferative, and mesenchymal(TCGA, 2011). These four subtypes (based solely on mRNA expression) were not significantly associated with survival differences(TCGA, 2011). We hypothesized that integrating mRNA expression with associated alterations in genomic, epigenetic, and miRNA systems would allow us to identify molecular driver events and characterize clinically relevant subtypes.
The mRNA, miRNA, DNA copy number, and DNA methylation data on 459 clinical annotated OvCa cases were obtained from TCGA Data Portal (http://tcga-data.nci.nih.gov/tcga/findarchives.htm). We first identified 2,942 genes that were significantly overexpressed (FDR<1%) in the mesenchymal subtype relative to other TCGA-defined subtypes. Next, a multivariate linear regression model (see Experimental Procedures) was performed to search for genes whose expression was correlated with copy number alteration (CNA), DNA methylation, or associated miRNA expression. This analysis narrowed the list to 253 genes that were potentially regulated by these three genetic and epigenetic mechanisms. A set of 219 genes was predicted to be targeted by 19 miRNAs (Figure 1, see also Table S1). These miRNA-associated genes included EMT inducers SNAI2 and ZEB2. The well-characterized mesenchymal regulators miR-141 and miR-200a were among the 19 identified miRNAs. The remaining two sets represent 26 CNA-associated and nine methylation-associated genes (Figure 1, see also Table S1). Twenty-three of the 26 CNA-associated genes, including STAT3, are located in chromosomal regions 19q13 and 17q11-q21, two regions reported to be frequently deleted in OvCa (TCGA, 2011). The methylation-associated genes include IL20RA, which is frequently methylated in primary lung adenocarcinomas and lung cancer cell lines (Tessema et al., 2008).
Figure 1. Integrated view of mesenchymal signature genes regulated by copy number, methylation, and miRNA.
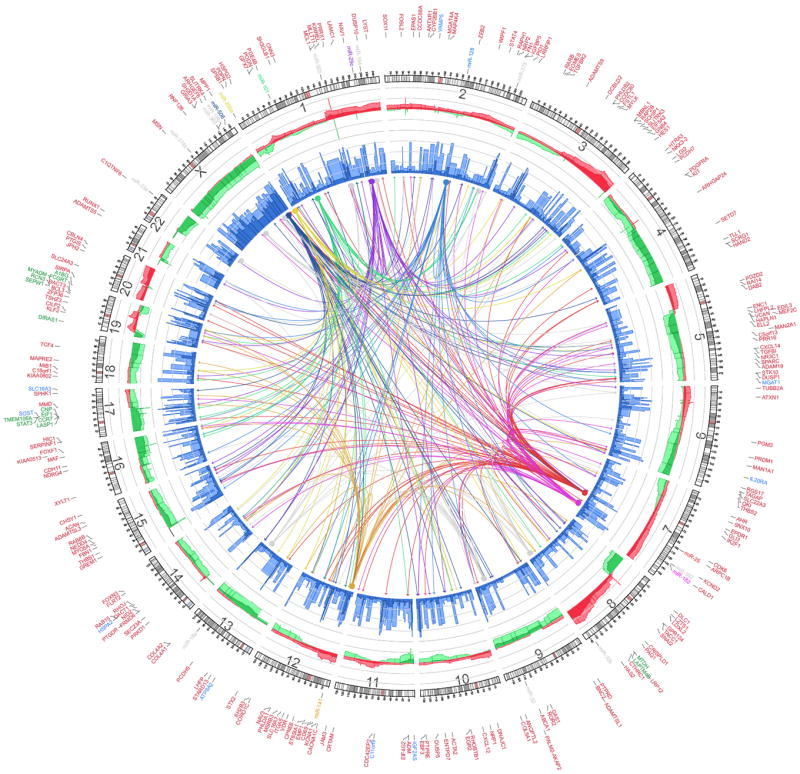
Integrated Circos plot shows mesenchymal signature genes regulated by copy number (CN), methylation, and miRNA. An ideogram of a normal karyotype is shown in the outer ring. The next outermost ring represents copy number as a function of genomic coordinates. (Red represents amplification and green represents deletion. Dark red and dark green indicate median CN values across all patients, and lighter red and green indicate the 25th and 75th percentiles. The vertical axis ranges from -1 to +1 on a log2 scale.) The next ring represents the amount of DNA methylation: dark blue indicates the median methylation beta value, and light blue indicates the 75th percentile. The vertical axis ranges from 0 to 1, and methylation data are averaged using variable-width bins along the genomic axis (25 CpG probes per bin). In the center of the figure, each arc indicates a predicted regulatory relationship between a miRNA (solid circle) and a gene (arrow). The colored arcs represent predicted regulation by the eight key miRNAs, whereas the grey arcs represent regulation by the remaining 11 miRNAs. Outside the ideogram, the miRNAs are colored the same as the corresponding arc. Outside the miRNA labels are the miRNA-associated genes (red), CNA-associated genes (green), and methylation-associated genes (blue). Detailed information on each group of genes is listed in Supplemental Table 1. See also Figure S1
MiRNA-associated genes identified a mesenchymal subtype associated with poor overall survival
The above analysis showed that 259 of the 2,942 TCGA mesenchymal subtype-associated genes were correlated with CNA, methylation, or miRNA alterations. Most of these genes were members of a miRNA-mRNA regulatory network. We sought to determine whether the miRNA-associated gene set could be used to further characterize a mesenchymal subtype in OvCa. Consensus K-means clustering of 459 OvCa cases, based on 219 miRNA-associated genes, identified two clusters (Figure 2A), with clustering stability decreasing for larger K (K=2 to 6). Cluster 1, including 172 OvCa cases, formed a tight cluster, with higher expression of miRNA-associated genes. The majority of cluster 1 OvCa patients (98%; 169 of 172 cases) had advanced-stage (stages III and IV) disease (p<10-6, two-sided Fisher’s exact test; Figure 2B, see also Table S2) and significantly shorter overall survival durations (p=0.02, log-rank test; Figure 2B) than cluster 2 patients, in whom miRNA-associated genes were consistently downregulated. Cluster 1 remained a predictor of poor patient overall survival (Hazard Ratio=0.87, p=0.058) on Cox multivariate analysis, after adjusting for patient age and tumor stage. When only CNA or methylation associated gene sets were used, the groups were not clinically distinguishable (Figure S1B, Figure S1F).
Figure 2. Consensus clustering based on 219 miRNA-associated genes identified iM and iE Subtypes.
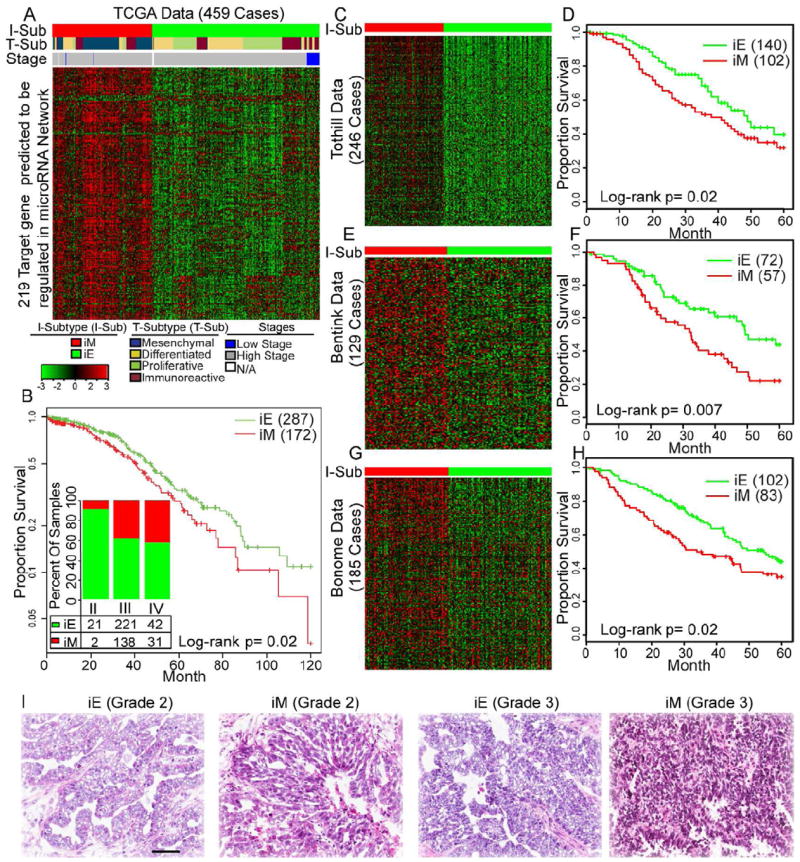
(A, C, E and G) Consensus K-means clustering (K=2) identified two clusters based on the expression levels of 219 miRNA-associated mesenchymal genes in 459 TCGA cases (panel A), 246 Tothill cases (panel C), 129 Bentink cases (panel E), and 185 Bonome cases (panel G). The cases are stratified into iM and iE subtypes as shown by a color code at the top of the panel (I-Sub [integrated subtype]). Detailed subtype and clinical information is listed in Supplemental Table 2. For panel A, each sample is further labeled in the middle row of color bands for the TCGA transcriptional subtype (T-Sub). (B, D, F and H) Kaplan-Meier overall survival curves for the OvCa iM and iE subtypes in the TCGA (panel B), Tothill (panel D), Bentink (panel F), and Bonome cases (panel H) datasets. For panel B, the inserted bar chart shows the distribution of tumor stages in the iM and iE subtypes in the TCGA dataset. Cases are categorized by clinical stages. The number and percentage of tumors in the iM and iE clusters (red, iM; green, iE) are indicated for each stage. Numbers do not add up because of missing values. (I) Representative H&E-stained images of iEs and iMs in grade 2 and 3 tumors from the TCGA dataset. Scale bar represents 100 μm. See also Figure S2 and Table S2
The clustering analysis based on the 219 miRNA-associated genes was then performed on three independent cohorts (Tothill, Bentink, and Bonome datasets, Table 1) with 246, 129, and 185 serous OvCa cases, respectively (Bentink et al., 2012; Bonome et al., 2008; Tothill et al., 2008). In all three datasets, the miRNA-associated genes characterized two distinct subtypes that associated with overall survival (Figures 2C-H, see also Table S2). This suggests the miRNA-associated genes robustly manifest a clinically relevant mesenchymal subtype in serous OvCa. We designated cluster 1 as the integrated mesenchymal subtype (iM) and cluster 2 as the integrated epithelial subtype (iE). An evaluation of hematoxylin and eosin (H&E) stained tumor tissue sections from TCGA revealed that iE cases exhibited papillary adenocarcinoma with frond-like projections on thin fibrovascular cores covered by typical cobblestone-like epithelial cells, resembling fallopian tube epithelium. In contrast, iM cases lacked well-organized epithelial structures, and contained elongated tumor cells and weaker connections between tumor cells, resembling mesenchymal cells (Figure 2I).
Table 1.
Clinicopathologic Information of the OvCa Patient Cohorts
| TCGA | Tothill | Bonome | Bentink# | Tianjin | Bagnoli | |
|---|---|---|---|---|---|---|
| Number | 459 | 246 | 185 | 129 | 92 | 55 |
| Age (SD) Stage | 60 (11) | 60 (10) | 62 (12) | 61 (14) | 55.5 (12) | 56 (12) |
| II | 23 | 10 | 0 | 1 | 15 | 0 |
| III | 359 | 199 | 144 | 109 | 63 | 45 |
| IV | 73 | 21 | 41 | 19 | 7 | 10 |
| Tumor Grade | ||||||
| G2 | 57 | 88 | 40 | NA | 43 | 7 |
| G3 | 392 | 145 | 144 | NA | 47 | 43 |
| Surgical Outcome | ||||||
| Optimal | 289 | 131 | 90 | 98 | 50 | 24 |
| Suboptimal | 114 | 65 | 95 | 28 | 42 | 31 |
| Vital Status | ||||||
| Living | 203 | 132 | 56 | 56 | 47 | 23 |
| Deceased | 251 | 110 | 129 | 73 | 45 | 32 |
| Follow Up | ||||||
| Median (Range) | 31 (1-179) | 28 (1-214) | 38 (1-164) | 31 (1-91) | 25 (1-79) | 36 (7-91) |
| Subtype | ||||||
| iE | 287 | 140 | 102 | 71 | NA* | NA* |
| iM | 172 | 102 | 83 | 58 | NA* | NA* |
| Source | TCGA | GSE9891 | GSE26712 | MTAB386 | TCH@ | GSE25204 |
Note: Numbers do not add up because of missing information in some cases.
For Bentink Dataset, both mRNA and miRNA microarray data are available
No iM/iE subtype was assigned because only miRNA expression data is available.
Tianjin Cancer Hospital
Compared with the four TCGA-identified transcriptional subtypes, the iM included nearly all (103 of 105; p<10-6, two-sided Fisher’s exact test; Figure 2A) transcriptional mesenchymal subtype cases, as well as 69 cases from other TCGA-defined subtypes (12, 32, and 25 cases from the proliferative, immunoreactive, and differentiated subtypes, respectively; Table S2). We evaluated the expression pattern of epithelial and mesenchymal markers (CDH1 [E-cadherin], FN1, VIM, SNAI1, SNAI2, and ZEB1) in these 69 iM cases previously defined as other subtypes solely on the basis of mRNA expression data and found that they showed distinct expression pattern compared with the iE cases in the same transcriptional subtype (Figure S2A). For instance, in the immunoreactive subtype, 32 and 67 cases were assigned to the iM and iE subtypes, respectively. The expression of the mesenchymal markers SNAI2 and FN1 was significantly upregulated by more than 2-fold in the 32 iM cases compared with that in the 67 iE cases in the same immunoreactive subtype (p<10-6). Remarkably, we observed a significantly poorer overall survival (p=0.04, log-rank test, Figure S2B) in the 32 iM cases than in the 67 iE cases. Similar trends were observed in the proliferative subtype (Figure S2C). We also assigned the iM/iE subtype classification for the transcriptional subtypes in the Tothill dataset. The 13 iM cases and 32 iE cases in the Tothill “C2” subtype have enough sample size for us to compare the EMT marker expression and overall survival duration (Table S2). Similar to our comparison in TCGA dataset, the iM cases showed significant overexpression in mesenchymal makers (Figure S2E) and shorter overall survival (p=0.05, Figure S2F) than the iE cases in the same C2 subtype. The results suggested that iM/iE subtype could further classify transcriptional subtypes into clinically relevant groups in multiple datasets.
Key miRNAs’ regulatory role in the iM OvCa subtype
The finding that only 219 miRNA-associated genes characterized the poor prognostic mesenchymal subtype strongly suggested the OvCa mesenchymal phenotype is likely governed by a miRNA regulatory network. Of the 19 miRNAs identified in our analysis, eight (miR-25, miR-506, miR-29c, miR-182, miR-128, miR-101, miR-141, and miR-200a) were predicted to regulate 89% (195 of 219) of the miRNA-associated genes (Figure 3A and B, see also Table S3). In addition to having binding sites in the 3’-UTRs of their predicted targets, these eight miRNA were also inversely correlated with the expression levels of their predicted targets (FDR<0.01, based on linear regression model).
Figure 3. Core miRNA-gene network, including 8 key miRNAs and their targets.

(A) The miRNA-gene network shows the relationships between 8 key miRNAs and EMT signature genes they are predicted to regulate. The size of each gene node indicates the number of predicted key miRNAs regulators; the colors indicate the annotated function of the gene. Only genes with GO and KEGG annotations are shown in this network. (B) A histogram reveals the number of predicted targets for each of the 19 miRNAs. (C) The association between key miRNA expression and clinical information, as well as miRNAs’ putative functional targets in terms of EMT inhibition. %: The significance of differential expression between iM and iE subtypes, as estimated by the Wilcoxon signed-rank test. Detailed information is listed in Table S4. @: The significance of miRNA expression’s association with clinical stage, as estimated using Spearman’s rank correlation coefficient. #: The significance of miRNA expression’s association with overall survival (OS), as estimated using the Cox proportional hazards model. *: Reported by (Carvalho J et al. 2012). See also Figure S3 and Table S3
Our analysis showed that miR-141 and miR-200a regulated 22 and 24 genes (Table S3), respectively, including ZEB2. Both miR-141 and miR-200a belong to the miR-200 family, and miRNAs in this family have been demonstrated to prevent EMT by targeting ZEB1 and ZEB2 in multiple cancer types (Gregory et al., 2008; Park et al., 2008). Consistently, these two miRNAs were downregulated in the iM subtype (p<10-6, Wilcoxon rank-sum test; Figure 3C). Besides the miR-200 family, miR-128 was predicted to target 27 genes (Table S3), and significantly downregulated in the iM subtype (p<10-3, Wilcoxon rank-sum test; Figure 3C, see also Table S4). Previous studies have also shown that miR-128 inhibits tumor cell migration and invasion in neuroblastoma (Evangelisti et al., 2009).
The three miRNA predicted to regulate the largest number of targets are miR-25, miR-506, and miR-29c (regulating 49, 35, and 32 targets, respectively, Table S3). In nasopharyngeal carcinomas, miR-29c has been shown to inhibit metastasis by targeting SPARC, LAMC1, COL4A1, COL4A2, and other mesenchymal markers implicated in invasion and metastasis (Sengupta et al., 2008). These molecules were also predicted to be targets of miR-29c in our network (Figures 3A, see also Table S3). Among the three miRNAs, miR-506 exhibited the most significant downregulation in the iM subtype (p<2.2×10⁻¹⁶, Wilcoxon rank-sum test, Figure S4A and Table S4). In addition, 35 mesenchymal signature genes, including the E-cadherin transcriptional repressor SNAI2 (aka SLUG), were significantly inversely correlated with miR-506 expression in the 459 TCGA OvCa cases (p=1.24×10⁻⁷ for SNAI2, Figures S4B and S4C).
MiR-506 promoted the epithelial phenotype in vitro and directly targeted SNAI2
In order to determine whether forced expression of miR-506 can promote epithelial phenotype, we transfected SKOV3 cells with either miR-506 mimic (miR-506) or a scrambled negative microRNA control (miR-Ctrl). MiR-506 overexpression significantly increased CDH1 mRNA levels, while the mesenchymal markers SNAI2 and VIM were downregulated by miR-506 (Figure 4A). Consistently, forced miR-506 expression also increased E-cadherin and markedly decreased SNAI2 protein expression. Another mesenchymal marker, N-cadherin, was also downregulated by miR-506 (Figure 4B). These results suggest that cells with miR-506 overexpression gained an epithelial signature characterized by E-cadherin expression induction and mesenchymal marker suppression.
Figure 4. Overexpression of miR-506 in OvCa cells is sufficient to induce epithelial phenotype.
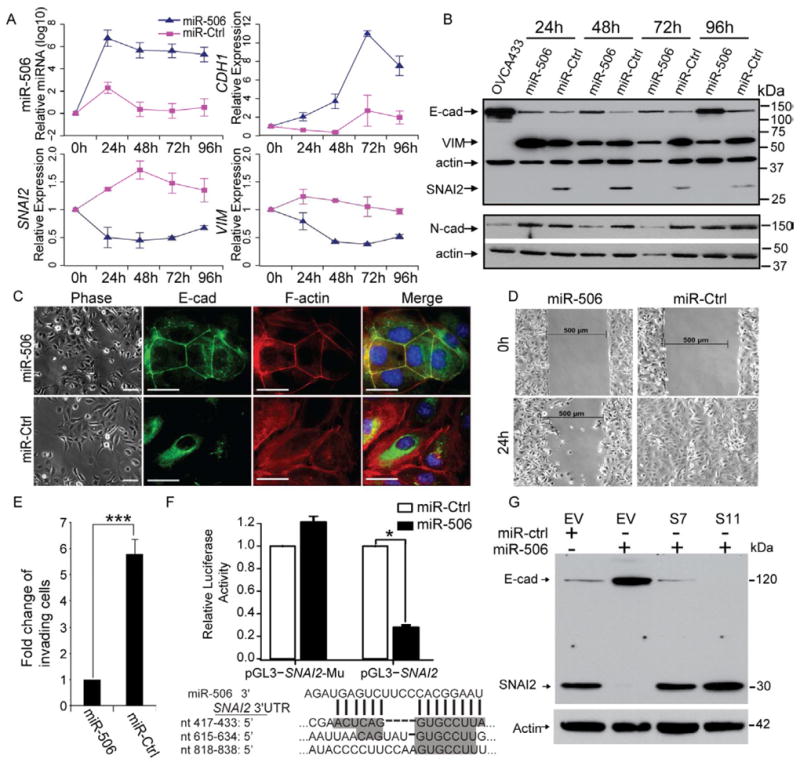
(A) Changes in microRNA and mRNA levels in SKOV3 cells transfected with miR-506 or control miRNA (miR-Ctrl) as measured by real-time RT-PCR (TaqMan). Two independent time course experiments were performed; the average ± standard error (indicated by the error bars) of the two experiments were shown. (B) Western blotting analysis of epithelial and mesenchymal markers in SKOV3 cells transfected with miR-506 or control miRNA (miR-Ctrl) from the same transfection as in panel A. OVCA433 cell lysate was used as the positive control for the epithelial marker E-cadherin. One mesenchymal marker, N-cadherin (N-cad), was measured on a different blot. Both blots were re-probed with actin to control for protein loading. (C) Inverse phase microscopy (left panel) and E-cadherin and F-actin staining (right panels) of SKOV3 cells transfected with miR-506 or control miRNA (miR-Ctrl) for 72 hours. Cell nuclei were stained with DAPI. Scale bars represent 50 μm. (D) Wound healing assay. Cells from the same transfection as in panel C were seeded into the μ-Dish 35mm, high culture-insert and a wound was applied at 48h post-transfection. (E) In vitro invasion assay Cells from the same transfection as in panel C were seeded into triplicate mitrigel coated invasion chambers at 48 h post- transfection and allowed to invade toward serum for 22 hours. The invading cell numbers on each filter were counted and data were plotted in fold change by defining the number from miR-506-transfected cells as 1. Error bars represent ± SD. (F) The relative luciferase activities were shown from three independent experiments (upper panel). The pGL3-SNAI2 reporter gene has the full length of SNAI2 3’-UTR cloned into pGL3- control vector. The pGL3-SNAI2-Mu vector has the three miR506 binding sites deleted and confirmed by sequencing. SKOV3 cells were transfected with pGL3-SNAI2 or pGL3-SNAI2-Mu, respectively, together with miR-506 mimics or mimic negative control. The three predicted binding sites of miR-506 were shown in the SNAI2 3’-UTR region (lower panel). Error bars represent ± SD. (G). Overexpression of SNAI2 from expression vector without 3’-UTR abrogates miR-506’s induction of E-cadherin. Two SKOV3-SNAI2 stable clones (S7 and S11) and empty vector stable cells (EV) were transfected with miR-506. Whole cell lysate from each sample was collected at 72h post – transfection and subjected for Western blot. For comparison, the levels of E-cadherin and SNAI2 in the EV cells transfected with mimic negative control (miR-ctrl) for 72h were shown. See also Figure S4
To further confirm these results, we performed immunofluorescence staining to directly visualize the effect of miR-506 on E-cadherin expression, localization, and cell morphology. As shown in Figure 4C, miR-506-transfected SKOV3 cells showed epithelial cell features, characterized by aggregated cells (Figure 4C, left panel); immunofluorescence staining revealed that E-cadherin protein was localized on the membrane at cell-cell junctions and formed a typical cobblestone structure, indicative of epithelial cells (Figure 4C). In addition, F-actin distribution was rearranged to a cortical pattern, which is another hallmark of the epithelial phenotype (Figure 4C). In contrast, the cells transfected with miR-Ctrl showed mesenchymal phenotype indicated by an absence of E-cadherin on the cell membrane and rearrangement of F-actin from a cortical to a stress-fiber pattern (Figure 4C). In addition, ectopic miR-506 expression decreased cell migration compared with miR-Ctrl transfected cells, as indicated by a wound-healing assay (Figure 4D). An invasion assay revealed similar results, in which miR-506 expression significantly decreased invaded cell numbers by more than 5-fold compared with in miR-Ctrl-transfected cells (Figure 4E).
E-cadherin is a critical protein that determines epithelial cell phenotype, and lack of E-cadherin is believed to be a driving event for EMT and cancer invasion and metastasis (Thiery et al., 2009). E-cadherin is regulated by a number of transcription factors, including the repressor SNAI2 (Peinado et al., 2007). TargetScan predicted three miR-506 binding sites in the 3’-UTR of the SNAI2 gene (Figure 4F). Our computational and functional study results provided evidence that miR-506 downregulated SNAI2 and upregulated E-cadherin. We performed luciferase reporter assay to examine whether miR-506 directly targeted SNAI2. We cloned the 3’-UTR of SNAI2 into the pGL3-ctrl vector and generated pGL3-SNAI2 constructs. Co-transfection of pGL3-SNAI2 and miR-506 resulted in a 72.2% reduction in luciferase activity compared with that after co-transfection with miR-Ctrl, suggesting that miR-506 directly targets SNAI2 (Figure 4F). To further confirm that miR-506 specifically regulates SNAI2 through the predicted binding sites, we generated the control construct-pGL3-SNAI2-Mu, in which the miR-506 binding site sequences on the 3’-UTR of SNAI2 were deleted. We then co-transfected this construct with miR-506 mimic or miR-Ctrl into cells. We observed that deletion of the miR-506 binding sites from the 3’-UTR of SNAI2 abolished the effect of miR-506 on luciferase activity (Figure 4F). To determine whether miR-506’s inhibition of EMT was mediated by SNAI2, we established SKOV3 cells overexpressing SNAI2 from expression vector without the 3’-UTR (Figures S4D and E). As shown in Figure S4F, SKOV3 cells overexpressing SNAI2 had decreased expression of E-cadherin protein and exhibited elongated mesenchamal cell morphology. In contrast, knockdown of SNAI2 by three different siRNA led to increased E-cadherin protein levels and typical cobble-stone epithelial cell morphology (Figures S4G). Notably, overexpression of SNAI2 abolished miR-506’s induction of E-cadherin (Figure 4G). These results confirmed that miR-506 specifically targeted the 3’-UTR of SNAI2 and thus inhibited SNAI2 gene expression, leading to E-cadherin upregulation.
MiR-506 blocked transforming growth factor β (TGFβ)-induced EMT in vitro
Previous studies have established that TGFβ is a robust inducer of EMT in multiple cell types (Zhu et al., 2010). Consistent with these findings, our pathway analysis revealed that the TGFβ pathway was significantly upregulated in iM subtypes (p<10-6, Figure S5 and Table S5). Consequently, we sought to determine whether miR-506 affected TGFβ-induced EMT in OvCa cells. We treated OVCA420 and OVCA433 cells with TGFβ after transfecting miR-506 or miR-Ctrl. In miR-Ctrl-transfected OVCA420 cells, TGFβ treatment induced SNAI2 by 6 fold and suppressed CDH1 expression by two-fold at the mRNA level (p<0.05, Figure 5A). In contrast, miR-506 overexpression abolished TGFβ-induced alterations of EMT markers (Figures 5A).
Figure 5. Overexpression of miR-506 alone in OvCa cells is sufficient to inhibit TGFβ-induced EMT.
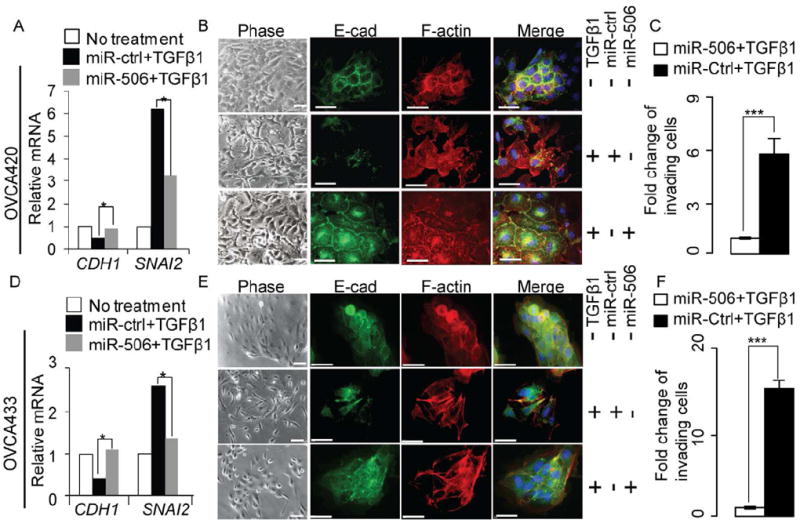
(A, D) Quantification by real-time RT-PCR (TaqMan) of CDH1 and SNAI2 in OVCA420 (panel A) and OVCA433 (panel D) cells transfected with miR-506 or control miRNA (miR-Ctrl). At 24h post-transfection, the cells were cultured in serum-free medium containing TGFβ1 for 48 hours. Data were means of triplicate PCR assays and presented relative to the mRNA levels in OVCA420 (panel A) and OVCA433 (panel D) cells, respectively. *p<0.05. (B, E) Inverse phase microscopy (left panel) and E-cadherin and F-actin staining (right panels) of OVCA420 (panel B) and OVCA433 (panel E) cells from the same transfection and treated the same way as described above. Cell nuclei were stained with DAPI and scale bars represent 50 μm. (C, F) In vitro invasion assay of the OVCA420 (panel C) and OVCA433 (panel F) cells from the same transfection as described above. At 24h post-transfection the cells were cultured in serum-free medium with TGFβ1 for 24 hours and then were seeded into triplicate invasion chambers in serum-free medium containing TGFβ1. The cells were allowed to invade towards serum for 22 hours. The invading cell numbers on each filter were counted and data were plotted in fold change by defining the number from miR-Ctrl-transfected cells as 1. Error bars represent ± SD. *** p<0.001. See also Figure S5
We next performed immunofluorescence staining to evaluate the morphologic changes in these cells. After TGFβ treatment, OVCA420 cells transfected with miR-Ctrl underwent a morphologic change characterized by elongated cells, a marked spreading growth pattern together with an absence of E-cadherin on the cell membrane and strong F-actin stress fibers, suggesting augmented mesenchymal features compared with untreated cells (Figure 5B). In contrast, miR-506 transfection blocked the TGFβ-induced mesenchymal phenotype, promoting an epithelial phenotype characterized by E-cadherin localization at cell-cell junctions and cortical F-actin staining (Figure 5B). Consistently, miR-506 treatment blocked TGFβ-induced invasion (Figure 5C). Similar results were also observed in OVCA433 cells (Figure 5D-F).
MiR-506 expression was associated with increased E-cadherin, decreased SNAI2 and VIM, and longer overall survival duration in serous OvCa
While the TCGA database allowed us to evaluate the association between miR-506 and CDH1 and SNAI2 mRNA levels, protein level data were not available in this dataset. To further investigate this proposed regulation in OvCa patient samples, we acquired a cohort of 92 clinically annotated serous OvCa tumor samples from Tianjin Cancer Hospital (TCH). In this cohort, the median follow-up duration was 25 months (range, 1–79 months). Fifty-one percent of patients were alive at the last follow-up. The median overall survival duration of the cohort was similar to those in the TCGA and Tothill datasets. Detailed clinical information was described in Table S6. MiR-506 was measured using real-time RT-PCR analysis in frozen tissues and miRNA in situ hybridization on tissue microarrays (TMAs) of formaldehyde-fixed, paraffin-embedded tissues from same patients. Both methods revealed consistent results for miR-506 expression (Figure. 6A and B). At the same time, we performed hematoxylin-and-eosin (H&E) and immunohistochemical staining for SNAI2, E-cadherin, and VIM on the TMAs. Consistent with our observations from TCGA samples, tumors with low miR-506 expression exhibited a more mesenchymal phenotype, with elongated tumor cells and weaker connections between tumor cells, whereas those with high miR-506 expression exhibited more epithelial characters, such as displaying a papillary structure with frond-like projections on thin fibrovascular cores covered by typical cobblestone-like epithelial cells (Figure. 6A). Moreover, miR-506 expression was inversely correlated with SNAI2 and VIM protein expression (p=0.008 and 0.03, respectively) and positively correlated with E-cadherin protein expression (p= 0.004) (Figure. 6A and B). Remarkably, high miR-506 expression was significantly correlated with longer overall survival in univariate model (log-rank p=0.045, Figure 6C) and multivariate model (hazard ratio=0.72, p=0.05). In TCGA data, the patients with high miR-506 and low SNAI2 expression have significantly longer overall survival and progression free survival (Figure S4H and I) compared to those with low miR-506 and high SNAI2 expression. To further confirm miR-506’s association with good prognosis in ovarian cancer, we obtained two miRNAs microarray datasets from GEO and ArrayExpress (Bentink Dataset and Bagnoli Dataset, Table 1) with 129 and 55 OvCa cases, respectively. In both datasets, miR-506 expression is significantly associated with longer progression free survival (log-rank p=0.02 and 0.0006 for Bentink and Bagnoli Datasets, respectively, Figure 6D and E).
Figure 6. Correlation between miR-506 and SNAI2, E-cadherin, and VIM expression and prognosis in multiple serous OvCa cohorts.

(A) Representative images of in situ hybridization staining for U6 snRNA (positive control) and miR-506 and immunohistochemical staining for SNAI2, E-cadherin (E-cad), and vimentin (VIM) in low and high miR-506 expression cases. The low and high miR-506 expression was stratified by using average of miR-506 PCR expression as threshold. Scale bar represents 100 μm. (B) Bar charts show the association between miR-506 expression and SNAI2, E-cadherin, and VIM expression. The low and high miR-506 expression is based on average value of miR-506 PCR expression. The x-axes represent miR-506 expression, as measured by in situ hybridization, and SNAI2, E-cadherin (E-cad), and vimentin (VIM) expression, as indicated by immunohistochemical staining. Error bars represent ± SD. * p<0.05 **<0.01. (C) Kaplan-Meier overall survival curves in miR-506 low and high expression OvCa cases. The low and high miR-506 expression is based on average value of miR-506 PCR expression. (D and E) Kaplan-Meier progression free survival curves in miR-506 low and high expression (according to average of miR-506 expression) in 129 Bentink cases (panel D) and 55 Bagnoli cases (panel E). See also Figure S6.
Next, we sought to explore the mechanisms for the attenuated expression of miR-506 in patients with poor clinical outcome. Integrated analysis of copy number and miRNA expression data in TCGA showed miR-506 expression was not associated with copy number alterations. Interestingly, we performed a demethylation experiment by treating ovarian cancer cells with 5-azaC and found an induction of miR-506 (Figure S6A). To more directly evaluate the methylation status of the miR-506 promoter in serous OvCa patient tumors, we identified five CpG sites in the promoter region of miR-506 (Figure S6B). Although the TCGA methylation microarray does not contain the five sites that would allow us to directly evaluate the methylation status of the miR-506 promoter in the TCGA data, we performed quantitative pyrosequencing following sodium bisulfate treatment of DNAs isolated from the ovarian cancer tissues in the Tianjin cohort. Our results showed that among the five methylation sites we interrogated, two displayed trends of negative correlation between methylation and miR-506 expression (p=0.06 and 0.15 for site #5 and #1, respectively, Figure S6C).
Systematic delivery of miR506 inhibited SNAI2 and VIM and induced E-cadherin expression in vivo
To further verify miR-506’s role and to determine the therapeutic efficacy of miR-506, we established OvCa orthotopic mouse models using two serous OvCa cell lines (SKOV3-IP1 and HeyA8-IP1, See Experimental Procedures for details). These two sublines were generated from ascites developed in nu/nu mouse by administering an intraperitoneal injection of SKOV3 and HeyA8, as described previously (Xu et al., 1999). For both models, delivery of miR-506 incorporated in DOPC nanoliposomes (miR-506-DOPC) resulted in a significant reduction in the number of tumor nodules (75% reduction in HeyA8-IP1; p = 0.009 and 48% reduction in SKOV3-IP1; p = 0.01; Figures 7A and B) and tumor weight (78% reduction in HeyA8-IP1, p = 0.004; and 53% reduction in SKOV3-IP1, p = 0.01; Figure 7C) compared with miR-Ctrl. We further performed immunohistochemical staining of SNAI2, E-cadherin, and VIM in the tumors to determine whether systemic delivery of miR-506 affected the expression of these EMT markers. For each model, representative sections with the staining of SNAI2, E-cadherin, and VIM were shown (Figure 7D). Compared with miR-Ctrl, miR-506 treatment significantly suppressed SNAI2 (58% reduction in HeyA8-IP1 and 68% reduction in SKOV3-IP1 models; p<0.05, Figure 7E) and VIM (30% reduction in both models, p<0.05, Figure 7E), and significantly induced E-cadherin (200% induction in HeyA8-IP1 and 120% induction in SKOV3-IP1; p<0.05, Figure 7E). These results showed that nanoparticle delivery of miR-506 may serve as potential therapeutic intervention for OvCa patients.
Figure 7. miR-506 inhibits tumor progression in the orthotopic mouse model of OvCa.
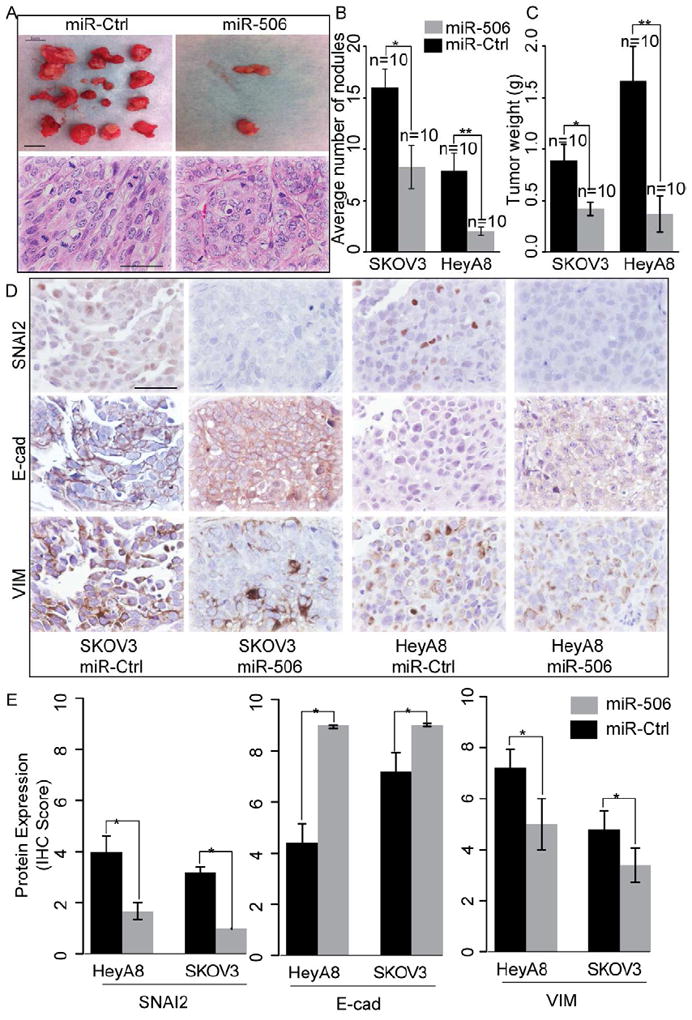
(A) Representative images of tumor nodules and H&E staining of tumors in control miRNA- and miR-506-treated mice (HeyA8-ip1). Scale bar in the upper panel represent 1 cm. Scale bar in the lower panel represents 100 μm. (B, C) Quantification of tumor weights (panel B) and tumor nodules (panel C) in control and miR-506 treated mice (n=10 for each group) that were injected intraperitoneally with HeyA8-ip1 (HeyA8) and SKOV3-ip1 (SKOV3) ovarian cancer cells, respectively. Error bars represent ± SD. (D) HeyA8-ip1 and SKOV3-ip1 tumor samples from control and miR-506 treated mice were stained for SNAI2, VIM and E-cad by immunohistochemistry. Scale bar represents 100 μm. (E). Quantification of SNAI2, VIM and E-cad protein expression. Error bars represent standard errors. * p<0.05. Error bars represent ± SD.
Discussion
Using integrated approaches, we have uncovered a key miRNA-regulatory network that reproducibly defines the iM subtype robustly associated with poor overall survival of women with serous ovarian carcinoma. Extensive functional studies characterized miR-506 as a potent EMT inhibitor and a potential therapeutic tool, which may have an impact on improving treatment for one of the most aggressive cancer types among women.
Genomic and molecular profiling has revealed that even within the same anatomical location and histological classification, cancer is heterogeneous (Ein-Dor et al., 2005). Efforts from systematic studies such as TCGA have allowed comprehensive molecular classification of cancer by integrated analyses of multidimensional data from a large cohort of clinical samples at both genomic and epigenetic levels (Noushmehr et al., 2010; Yang et al., 2011). The current study shows that our integrated approach is a major step forward compared to the commonly used transcriptome-based approaches, which have resulted in inconsistent clinical associations from different datasets (TCGA, 2011; Tothill et al., 2008). Specifically, integrated analysis of miRNAs and transcriptome further grouped the transcriptional subtypes into more clinically relevant iM and iE subtypes. The strength of this integrated approach is that it also reveals regulatory mechanisms associated with the subtypes. In particular, our integrated analysis of OvCa highlights the important role of a miRNA regulatory network consisting of 8 key miRNAs for the mesenchymal subtype. MiR-141 and miR-200, among the eight key miRNAs, have been reported to be EMT regulators (Gregory et al., 2008; Park et al., 2008). Other key miRNAs, such as miR-29c, miR-101 and miR-128 have also been shown to regulate EMT-related processes (e.g. cell adhesion, cytoskeleton organization, and extracellular matrix molecular) (Evangelisti et al., 2009; Varambally et al., 2008). We subsequently narrowed our focus on the function of miR-506 since it was the least studied among the miRNA network.
MiR-506 is located in Xq27.3, a chromosomal fragile region associated with the “fragile X syndrome”. Female patients with fragile X syndrome suffer from primary ovarian insufficiency (Santoro et al., 2011). The region has also been identified as a high susceptibility locus in linkage studies of familial testicular germ cell tumors(Rapley et al., 2000). Downregulation of miR-506 has been observed in kidney cancer (Zhou et al., 2011) and chemical carcinogen-transformed lung cancer(Zhao et al., 2011), suggesting that miR-506 potentially plays a role in tumor suppression.
SNAI2 (also known as Slug) is one of the three zinc finger transcription factors of the Snail family, which in recent years has been shown to be a major regulator of EMT (Peinado et al., 2007). In experimental models of ovarian carcinoma, SNAI2 was shown to induce EMT by repressing E-cadherin, and to promote tumor growth and invasion (Kurrey et al., 2005). In addition, it was reported that treatment of cultured ovarian surface epithelium (OSE) by TGFβ induces an EMT-like process, characterized by the inability to form an epithelial barrier, increase in SNAI2 level and decrease of E-cadherin. However, TGFβ treatment did not increase expression in TWIST1 and ZEB1 (Zhu et al., 2010), suggesting that SNAI2 plays an essential role in ovarian EMT. In this study, we demonstrate that miR-506 is a potent inhibitor of the mesenchymal phenotype and TGFβ-induced EMT by directly targeting SNAI2. We established the importance of the miR-506-SNAI2 axis by rescue experiment and the reverse correlation between miR-506 and SNAI2 expression in tumor samples from multiple patient cohorts.
Our observation suggests miR-506 is partially regulated by methylation. This is consistent with a recent large-scale screening of epigenetic regulated miRNAs in OvCa, which showed the Xq27.3 miRNA cluster (including miR-506) was regulated by epigenetic mechanisms (Zhang et al., 2008). Interestingly, recent studies showed that other EMT inhibitory miRNAs including miR-200 are also subject to negative regulation by methylation. In lung cancer, epigenetically silenced miR-200-mediated EMT is likely an early event in carcinogen-induced transformation of human lung epithelial cells (Tellez et al., 2012). Further studies using larger sample sizes need to be performed to reveal the relationship between miR-506 methylation and miR-506 expression.
Besides indicating the function and mechanism of miR-506 in EMT, our study explored the potential therapeutic value of miR-506 for OvCa. Introduction of miRNAs in vitro is well known to be highly efficient. However, delivery of miRNAs in vivo is much more challenging (Garzon et al., 2010). Although the initial proof-of-principle studies using miRNAs as therapeutics took advantage of adenoviral-based(Esquela-Kerscher et al., 2008) and lentiviral-based(Trang et al., 2009) delivery vehicles, translation into clinical practice requires the development of safer delivery methods (Pecot et al., 2011; Rupaimoole et al., 2012). Packaging mature miRNAs into lipid-based nanoparticles (neutral or charged) that can be systemically or specifically delivered to the tumor microenvironment has been shown to successfully transfer miRNAs and therapeutically regulate their targets in the lung (Wiggins et al., 2010), pancreas (Pramanik et al., 2011) and prostate (Liu et al., 2011). In this study, we illustrated that nanoparticle-delivery of miR-506 effectively suppressed tumor growth in two orthotopic ovarian cancer models. EMT of the resulting treated tumors was blocked based on the examination of EMT markers. Although we have not examined whether the delivery of miR-506 will sensitize ovarian cancers to chemotherapy in our preclinical model, a recent study demonstrated that an OvCa cell line that stably expresses miR-141 or miR-200a shows better response to chemotherapy in a subcutaneous xenograft OvCa mouse model(Mateescu et al., 2011). Future studies are needed to validate the clinical value of miR-506 in OvCa treatment.
In summary, our integrated analyses have identified a master microRNA regulatory network for the mesenchymal subtype in serous ovarian cancer. Nanoparticle delivery of the miR-506, one of the key miRNAs in the network, may represent an important strategy for treatment of the most aggressive ovarian cancers.
Experimental Procedures
Ovarian cancer patients and data collection
Agilent Human Genome comparative genomic hybridization microarray 1×1M copy number data, Agilent 244K gene expression data, Agilent human miRNA microarray 8×15K miRNA expression data, Illumina Infinium methylation data, and clinical information were obtained from the open-access and controlled-access tiers of the TCGA data portal, with NIH approval. Alignment of sample identifiers yielded 459 tumor cases, with all information available at the time of data retrieval from the TCGA. The Tothill, Bentink, Bonome and Bagnoli datasets were downloaded from the Gene Expression Omnibus and ArrayExpression databases (Table 1). Frozen and paraffin-embedded tissues from 92 OvCa cases were collected from Tianjin Medical University Cancer Institute and Hospital, with approval of the institutional review board. Informed consent has been obtained from patients. All patients had been treated with a combination of surgery and platinum-based chemotherapy. The detailed clinical characteristics for each patient in Tianjin cohort is listed in Table S6.
Identification of integrated mesenchymal gene signatures
A linear regression model was used to analyze the expression level of each mesenchymal signature gene. The associated gene copy number, promoter methylation probes, and miRNA expression level (see Supplemental Experimental Procedures) were chosen as regulatory factors for each gene and designated as independent variables in the regression model. For each regulatory factor in the model, a regression coefficient was estimated, reflecting its influence on gene expression. Sample labels were randomly permuted 1000 times to generate a background distribution of regression coefficients, and a threshold was used (FDR=0.01) to define the significant regulatory factors for each gene. A refined subset of mesenchymal signature genes was then selected according to 2 criteria: 1) each gene was significantly regulated by 1 or more factors on the basis of the regression model and 2) the significant regulatory factor itself was also significantly altered (FDR<1%) between the mesenchymal subgroup and other subgroups. We termed this integrative analysis algorithm as MIRACLE (Master mIRna Analysis for Cancer moLecular subtypE). The miRNA target information was from TargetScan (Lewis et al., 2003).
Statistical and Clustering Analysis
Student’s t-test, analysis of variance, chi-square, Wilcoxon rank-sum test, Fisher’s exact test, Kaplan-Meier estimate, and Mantel-Cox survival analyses were performed using R 2.10.0. Significance was defined as p<0.05. Benjamini-Hochberg multiple testing correction (Benjamini and Hochberg, 1995) was used to estimate the FDR when multiple testing correction was applied. Consensus clustering was performed as in previous studies (Noushmehr et al., 2010; Verhaak et al., 2010). Increasing values of K (2 through 6, inclusive) were used to identify optimal segregation. For each K, 1000 random iterations were performed to characterize the clusters.
Animals, orthotopic in vivo model, and tissue processing
Forty female athymic nude mice were purchased from the National Cancer Institute, Frederick Cancer Research and Development Center (Frederick, MD) and were cared for according to guidelines set forth by the American Association for Accreditation of Laboratory Animal Care and the U.S. Public Health Service policy on Human Care and Use of Laboratory Animals. All mouse studies were approved and supervised by the MD Anderson Cancer Center Institutional Animal Care and Use Committee. All animals were 8-12 weeks of age at the time of injection. HeyA8-ip1 and SKOV3-ip1 cells were trypsinized, washed, and re-suspended in Hanks’ balanced salt solution (Gibco, Carlsbad, CA) and injected into the peritoneal cavities of mice (HeyA8IP1 or SKOV3IP1: 1.0×10ˆ6 cells/animal). Seven days after tumor cell injection, mice were randomly separated into 2 groups (n=10 mice per group) and treated with miRNA incorporated in DOPC nanoliposomes (intraperitoneal administration)—control miRNA/DOPC or miR-506/DOPC for each cell line (see Supplemental Experimental Procedures for detailed method of Liposomal preparation). Twice-weekly treatments continued for 4–6 weeks. All mice in the experiment were then killed and necropsied, and their tumors were harvested. Tumor weights, numbers, and locations were recorded. Mean mouse body weights were similar among groups, suggesting that feeding and drinking habits were not affected. Tumor tissue was snap frozen or fixed in formalin. H&E and immunohistochemical staining was performed on formalin-fixed, paraffin-embedded slides (see Supplemental Experimental Procedures).
Supplementary Material
Significance.
OvCa is one of the most lethal malignancies in women. Identification of molecular subtypes and corresponding molecular driver events is critical for the development of new therapies for OvCa patients. Although accumulating evidence illustrates that EMT plays an important role in OvCa progression, the driving molecular events are largely unknown. Our studies identified and validated miR-506, a key node in the microRNA regulatory network, as an EMT inhibitor in OvCa by targeting SNAI2. Nanoparticle delivery of miR-506 can suppress EMT and reduce tumor growth in orthotopic mouse models of OvCa, suggesting miR-506 may serve as a potential therapeutic tool for OvCa patients.
Highlights.
Integrated analyses identify microRNA network regulating iM subtype
iM subtype is robustly associated with poor overall survival in serous OvCa
miR-506 is validated as an EMT inhibitor
miR-506 suppresses tumor growth in orthotopic mouse models of OvCa
Acknowledgments
We thank Drs. Xinna Zhang and George Calin for their assistance with miRNA in situ hybridization, Yingmei Wang and Jared Burks (Flow Cytometry & Cellular Imaging Core Facility) for technical assistance, Yuexin Liu for discussion, and Ms. Ann Sutton in the Department of Scientific Publications and Brittany Parker for editing this manuscript. This study was supported by a grant from the National Institutes of Health (U24CA143835) to Drs. Shmulevich and Zhang; a grant from the Blanton-Davis Ovarian Cancer Research Program to Dr. Zhang; an Ovarian Cancer SPORE grant (P50 CA083639), Ovarian Cancer Research Fund Program Project Development Grant, and U54 CA151668 grant to Dr. Sood; the Program for Changjiang Scholars and Innovative Research Team in University (IRT1076) in China and National Key Scientific and Technological Project (2011ZX0 9307-001-04) and Tianjin Science and Technology Committee Foundation grants (09ZCZDSF04700) to Dr. Chen; and the Finnish Funding Agency for Technology and Innovation Finland Distinguished Professor Program to Dr. Nykter. The genomic studies were supported in part by the Cancer Genomics Core Laboratory and the National Institutes of Health through The University of Texas MD Anderson’s Cancer Center Support Grant (CA016672). Dr. Yang is an Odyssey Fellow at MD Anderson Cancer Center, and supported by The Diane Denson Tobola Fellowship in Ovarian Cancer Research fellowship and The Harold C. and Mary L. Daily Endowment Fund. Dr Sun is supported by the Natural Science Foundation of China (81201651), the Linda K. Manning Fellowship in Ovarian Cancer and The A. Lavoy Moore Endowment Fund.
Footnotes
Publisher's Disclaimer: This is a PDF file of an unedited manuscript that has been accepted for publication. As a service to our customers we are providing this early version of the manuscript. The manuscript will undergo copyediting, typesetting, and review of the resulting proof before it is published in its final citable form. Please note that during the production process errors may be discovered which could affect the content, and all legal disclaimers that apply to the journal pertain.
References
- Bagga S, Bracht J, Hunter S, Massirer K, Holtz J, Eachus R, Pasquinelli AE. Regulation by let-7 and lin-4 miRNAs results in target mRNA degradation. Cell. 2005;122:553–563. doi: 10.1016/j.cell.2005.07.031. [DOI] [PubMed] [Google Scholar]
- Bast RC, Jr, Hennessy B, Mills GB. The biology of ovarian cancer: new opportunities for translation. Nat Rev Cancer. 2009;9:415–428. doi: 10.1038/nrc2644. [DOI] [PMC free article] [PubMed] [Google Scholar]
- Bentink S, Haibe-Kains B, Risch T, Fan JB, Hirsch MS, Holton K, Rubio R, April C, Chen J, Wickham-Garcia E, et al. Angiogenic mRNA and microRNA gene expression signature predicts a novel subtype of serous ovarian cancer. PLoS One. 2012;7:e30269. doi: 10.1371/journal.pone.0030269. [DOI] [PMC free article] [PubMed] [Google Scholar]
- Bonome T, Levine DA, Shih J, Randonovich M, Pise-Masison CA, Bogomolniy F, Ozbun L, Brady J, Barrett JC, Boyd J, Birrer MJ. A gene signature predicting for survival in suboptimally debulked patients with ovarian cancer. Cancer Res. 2008;68:5478–5486. doi: 10.1158/0008-5472.CAN-07-6595. [DOI] [PMC free article] [PubMed] [Google Scholar]
- Cao L, Shao M, Schilder J, Guise T, Mohammad KS, Matei D. Tissue transglutaminase links TGF-beta, epithelial to mesenchymal transition and a stem cell phenotype in ovarian cancer. Oncogene. 2011 doi: 10.1038/onc.2011.429. [DOI] [PubMed] [Google Scholar]
- Ein-Dor L, Kela I, Getz G, Givol D, Domany E. Outcome signature genes in breast cancer: is there a unique set? Bioinformatics. 2005;21:171–178. doi: 10.1093/bioinformatics/bth469. [DOI] [PubMed] [Google Scholar]
- Esquela-Kerscher A, Slack FJ. Oncomirs - microRNAs with a role in cancer. Nat Rev Cancer. 2006;6:259–269. doi: 10.1038/nrc1840. [DOI] [PubMed] [Google Scholar]
- Esquela-Kerscher A, Trang P, Wiggins JF, Patrawala L, Cheng A, Ford L, Weidhaas JB, Brown D, Bader AG, Slack FJ. The let-7 microRNA reduces tumor growth in mouse models of lung cancer. Cell Cycle. 2008;7:759–764. doi: 10.4161/cc.7.6.5834. [DOI] [PubMed] [Google Scholar]
- Evangelisti C, Florian MC, Massimi I, Dominici C, Giannini G, Galardi S, Bue MC, Massalini S, McDowell HP, Messi E, et al. MiR-128 up-regulation inhibits Reelin and DCX expression and reduces neuroblastoma cell motility and invasiveness. FASEB J. 2009;23:4276–4287. doi: 10.1096/fj.09-134965. [DOI] [PubMed] [Google Scholar]
- Garzon R, Marcucci G, Croce CM. Targeting microRNAs in cancer: rationale, strategies and challenges. Nat Rev Drug Discov. 2010;9:775–789. doi: 10.1038/nrd3179. [DOI] [PMC free article] [PubMed] [Google Scholar]
- Gregory PA, Bert AG, Paterson EL, Barry SC, Tsykin A, Farshid G, Vadas MA, Khew-Goodall Y, Goodall GJ. The miR-200 family and miR-205 regulate epithelial to mesenchymal transition by targeting ZEB1 and SIP1. Nat Cell Biol. 2008;10:593–601. doi: 10.1038/ncb1722. [DOI] [PubMed] [Google Scholar]
- Jemal A, Tiwari RC, Murray T, Ghafoor A, Samuels A, Ward E, Feuer EJ, Thun MJ. Cancer statistics, 2004. CA Cancer J Clin. 2004;54:8–29. doi: 10.3322/canjclin.54.1.8. [DOI] [PubMed] [Google Scholar]
- Kurrey NK, K A, Bapat SA. Snail and Slug are major determinants of ovarian cancer invasiveness at the transcription level. Gynecol Oncol. 2005;97:155–165. doi: 10.1016/j.ygyno.2004.12.043. [DOI] [PubMed] [Google Scholar]
- Lewis BP, Shih IH, Jones-Rhoades MW, Bartel DP, Burge CB. Prediction of mammalian microRNA targets. Cell. 2003;115:787–798. doi: 10.1016/s0092-8674(03)01018-3. [DOI] [PubMed] [Google Scholar]
- Liu C, Kelnar K, Liu B, Chen X, Calhoun-Davis T, Li H, Patrawala L, Yan H, Jeter C, Honorio S, et al. The microRNA miR-34a inhibits prostate cancer stem cells and metastasis by directly repressing CD44. Nat Med. 2011;17:211–215. doi: 10.1038/nm.2284. [DOI] [PMC free article] [PubMed] [Google Scholar]
- Mateescu B, Batista L, Cardon M, Gruosso T, de Feraudy Y, Mariani O, Nicolas A, Meyniel JP, Cottu P, Sastre-Garau X, Mechta-Grigoriou F. miR-141 and miR-200a act on ovarian tumorigenesis by controlling oxidative stress response. Nat Med. 2011;17:1627–1635. doi: 10.1038/nm.2512. [DOI] [PubMed] [Google Scholar]
- Naora H, Montell DJ. Ovarian cancer metastasis: integrating insights from disparate model organisms. Nat Rev Cancer. 2005;5:355–366. doi: 10.1038/nrc1611. [DOI] [PubMed] [Google Scholar]
- Noushmehr H, Weisenberger DJ, Diefes K, Phillips HS, Pujara K, Berman BP, Pan F, Pelloski CE, Sulman EP, Bhat KP, et al. Identification of a CpG island methylator phenotype that defines a distinct subgroup of glioma. Cancer Cell. 2010;17:510–522. doi: 10.1016/j.ccr.2010.03.017. [DOI] [PMC free article] [PubMed] [Google Scholar]
- Park SM, Gaur AB, Lengyel E, Peter ME. The miR-200 family determines the epithelial phenotype of cancer cells by targeting the E-cadherin repressors ZEB1 and ZEB2. Genes Dev. 2008;22:894–907. doi: 10.1101/gad.1640608. [DOI] [PMC free article] [PubMed] [Google Scholar]
- Pecot CV, Calin GA, Coleman RL, Lopez-Berestein G, Sood AK. RNA interference in the clinic: challenges and future directions. Nat Rev Cancer. 2011;11:59–67. doi: 10.1038/nrc2966. [DOI] [PMC free article] [PubMed] [Google Scholar]
- Peinado H, Olmeda D, Cano A. Snail, Zeb and bHLH factors in tumour progression: an alliance against the epithelial phenotype? Nat Rev Cancer. 2007;7:415–428. doi: 10.1038/nrc2131. [DOI] [PubMed] [Google Scholar]
- Pramanik D, Campbell NR, Karikari C, Chivukula R, Kent OA, Mendell JT, Maitra A. Restitution of tumor suppressor microRNAs using a systemic nanovector inhibits pancreatic cancer growth in mice. Mol Cancer Ther. 2011;10:1470–1480. doi: 10.1158/1535-7163.MCT-11-0152. [DOI] [PMC free article] [PubMed] [Google Scholar]
- Rapley EA, Crockford GP, Teare D, Biggs P, Seal S, Barfoot R, Edwards S, Hamoudi R, Heimdal K, Fossa SD, et al. Localization to Xq27 of a susceptibility gene for testicular germ-cell tumours. Nat Genet. 2000;24:197–200. doi: 10.1038/72877. [DOI] [PubMed] [Google Scholar]
- Rosano L, Cianfrocca R, Spinella F, Di Castro V, Nicotra MR, Lucidi A, Ferrandina G, Natali PG, Bagnato A. Acquisition of chemoresistance and EMT phenotype is linked with activation of the endothelin A receptor pathway in ovarian carcinoma cells. Clin Cancer Res. 2011;17:2350–2360. doi: 10.1158/1078-0432.CCR-10-2325. [DOI] [PubMed] [Google Scholar]
- Rupaimoole R, Han HD, Lopez-Berestein G, Sood AK. MicroRNA therapeutics: principles, expectations, and challenges. Chin J Cancer. 2012;30:368–370. doi: 10.5732/cjc.011.10186. [DOI] [PMC free article] [PubMed] [Google Scholar]
- Santoro MR, Bray SM, Warren ST. Molecular mechanisms of fragile X syndrome: a twenty-year perspective. Annu Rev Pathol. 2011;7:219–245. doi: 10.1146/annurev-pathol-011811-132457. [DOI] [PubMed] [Google Scholar]
- Sengupta S, den Boon JA, Chen IH, Newton MA, Stanhope SA, Cheng YJ, Chen CJ, Hildesheim A, Sugden B, Ahlquist P. MicroRNA 29c is down-regulated in nasopharyngeal carcinomas, up-regulating mRNAs encoding extracellular matrix proteins. Proc Natl Acad Sci U S A. 2008;105:5874–5878. doi: 10.1073/pnas.0801130105. [DOI] [PMC free article] [PubMed] [Google Scholar]
- Siegel R, Desantis C, Virgo K, Stein K, Mariotto A, Smith T, Cooper D, Gansler T, Lerro C, Fedewa S, et al. Cancer treatment and survivorship statistics, 2012. CA Cancer J Clin. 2012;62:220–241. doi: 10.3322/caac.21149. [DOI] [PubMed] [Google Scholar]
- Sun Y, Yokoi K, Li H, Gao J, Hu L, Liu B, Chen K, Hamilton SR, Fan D, Sun B, Zhang W. NGAL expression is elevated in both colorectal adenoma-carcinoma sequence and cancer progression and enhances tumorigenesis in xenograft mouse models. Clin Cancer Res. 2011;17:4331–4340. doi: 10.1158/1078-0432.CCR-11-0226. [DOI] [PMC free article] [PubMed] [Google Scholar]
- TCGA. Integrated genomic analyses of ovarian carcinoma. Nature. 2011;474:609–615. doi: 10.1038/nature10166. [DOI] [PMC free article] [PubMed] [Google Scholar]
- Tellez CS, Juri DE, Do K, Bernauer AM, Thomas CL, Damiani LA, Tessema M, Leng S, Belinsky SA. EMT and stem cell-like properties associated with miR-205 and miR-200 epigenetic silencing are early manifestations during carcinogen-induced transformation of human lung epithelial cells. Cancer Res. 2012;71:3087–3097. doi: 10.1158/0008-5472.CAN-10-3035. [DOI] [PMC free article] [PubMed] [Google Scholar]
- Tessema M, Willink R, Do K, Yu YY, Yu W, Machida EO, Brock M, Van Neste L, Stidley CA, Baylin SB, Belinsky SA. Promoter methylation of genes in and around the candidate lung cancer susceptibility locus 6q23-25. Cancer Res. 2008;68:1707–1714. doi: 10.1158/0008-5472.CAN-07-6325. [DOI] [PubMed] [Google Scholar]
- Thiery JP, Acloque H, Huang RY, Nieto MA. Epithelial-mesenchymal transitions in development and disease. Cell. 2009;139:871–890. doi: 10.1016/j.cell.2009.11.007. [DOI] [PubMed] [Google Scholar]
- Tothill RW, Tinker AV, George J, Brown R, Fox SB, Lade S, Johnson DS, Trivett MK, Etemadmoghadam D, Locandro B, et al. Novel molecular subtypes of serous and endometrioid ovarian cancer linked to clinical outcome. Clin Cancer Res. 2008;14:5198–5208. doi: 10.1158/1078-0432.CCR-08-0196. [DOI] [PubMed] [Google Scholar]
- Trang P, Medina PP, Wiggins JF, Ruffino L, Kelnar K, Omotola M, Homer R, Brown D, Bader AG, Weidhaas JB, Slack FJ. Regression of murine lung tumors by the let-7 microRNA. Oncogene. 2009;29:1580–1587. doi: 10.1038/onc.2009.445. [DOI] [PMC free article] [PubMed] [Google Scholar]
- Varambally S, Cao Q, Mani RS, Shankar S, Wang X, Ateeq B, Laxman B, Cao X, Jing X, Ramnarayanan K, et al. Genomic loss of microRNA-101 leads to overexpression of histone methyltransferase EZH2 in cancer. Science. 2008;322:1695–1699. doi: 10.1126/science.1165395. [DOI] [PMC free article] [PubMed] [Google Scholar]
- Wiggins JF, Ruffino L, Kelnar K, Omotola M, Patrawala L, Brown D, Bader AG. Development of a lung cancer therapeutic based on the tumor suppressor microRNA-34. Cancer Res. 2010;70:5923–5930. doi: 10.1158/0008-5472.CAN-10-0655. [DOI] [PMC free article] [PubMed] [Google Scholar]
- Xu L, Xie K, Mukaida N, Matsushima K, Fidler IJ. Hypoxia-induced elevation in interleukin-8 expression by human ovarian carcinoma cells. Cancer Res. 1999;59:5822–5829. [PubMed] [Google Scholar]
- Yang D, Khan S, Sun Y, Hess K, Shmulevich I, Sood AK, Zhang W. Association of BRCA1 and BRCA2 mutations with survival, chemotherapy sensitivity, and gene mutator phenotype in patients with ovarian cancer. JAMA. 2011;306:1557–1565. doi: 10.1001/jama.2011.1456. [DOI] [PMC free article] [PubMed] [Google Scholar]
- Zhang L, Volinia S, Bonome T, Calin GA, Greshock J, Yang N, Liu CG, Giannakakis A, Alexiou P, Hasegawa K, et al. Genomic and epigenetic alterations deregulate microRNA expression in human epithelial ovarian cancer. Proc Natl Acad Sci U S A. 2008;105:7004–7009. doi: 10.1073/pnas.0801615105. [DOI] [PMC free article] [PubMed] [Google Scholar]
- Zhao Y, Liu H, Li Y, Wu J, Greenlee AR, Yang C, Jiang Y. The role of miR-506 in transformed 16HBE cells induced by anti-benzo[a]pyrene-trans-7,8-dihydrodiol-9,10-epoxide. Toxicol Lett. 2011;205:320–326. doi: 10.1016/j.toxlet.2011.06.022. [DOI] [PubMed] [Google Scholar]
- Zhou L, Chen J, Li Z, Li X, Hu X, Huang Y, Zhao X, Liang C, Wang Y, Sun L, et al. Integrated profiling of microRNAs and mRNAs: microRNAs located on Xq27.3 associate with clear cell renal cell carcinoma. PLoS One. 2011;5:e15224. doi: 10.1371/journal.pone.0015224. [DOI] [PMC free article] [PubMed] [Google Scholar]
- Zhu Y, Nilsson M, Sundfeldt K. Phenotypic plasticity of the ovarian surface epithelium: TGF-beta 1 induction of epithelial to mesenchymal transition (EMT) in vitro. Endocrinology. 2010;151:5497–5505. doi: 10.1210/en.2010-0486. [DOI] [PubMed] [Google Scholar]
Associated Data
This section collects any data citations, data availability statements, or supplementary materials included in this article.