Abstract
To extend our current understanding of the teratogenic effects of prenatal alcohol exposure on the control of isometric force, the present study investigated the signal characteristics of power spectral density functions resulting from sustained control of isometric force by children with and without heavy prenatal exposure to alcohol. It was predicted that the functions associated with the force signals would be fundamentally different for the two groups. Twenty-five children aged between 7 and 17 years with heavy prenatal alcohol exposure and 21 non-alcohol exposed control children attempted to duplicate a visually represented target force by pressing on a load cell. The level of target force (5 and 20% of maximum voluntary contraction) and the time interval between visual feedback (20ms, 320ms and 740ms) were manipulated. A multivariate spectral estimation method with sinusoidal windows was applied to individual isometric force-time signals. Analysis of the resulting power spectral density functions revealed that the alcohol-exposed children had a lower mean frequency, less spectral variability, greater peak power and a lower frequency at which peak power occurred. Furthermore, mean frequency and spectral variability produced by the alcohol-exposed group remained constant across target load and visual feedback interval, suggesting that these children were limited to making long-time scale corrections to the force signal. In contrast, the control group produced decreased mean frequency and spectral variability as target force and the interval between visual feedback increased, indicating that when feedback was frequently presented these children used the information to make short-time scale adjustments to the ongoing force signal. Knowledge of these differences could facilitate the design of motor rehabilitation exercises that specifically target isometric force control deficits in alcohol-exposed children.
Keywords: Fetal alcohol syndrome, power spectrum density
1.0 Introduction
Fetal alcohol syndrome (FAS) results from maternal consumption of alcohol during pregnancy and represents the extreme end of a continuum of fetal alcohol spectrum disorders (FASD). A diagnosis of FAS is made on the basis of three defining characteristics: central nervous system (CNS) damage or dysfunction, pre- and/or post-natal growth retardation with height or weight at/or below the 10th percentile, and distinct dysmorphic facial anomalies including a smooth philtrum, thin upper lip and small palpebral fissures (Jones and Smith, 1973). It is estimated that in the United States 2 to 7 children per 1,000 live births have FAS (May, Gossage, Kalberg et al., 2009), while incidence rates are reported to be as high as 4 to 12 per 1,000 children in Italy (May, Fiorentino, Coriale, et al., 2011) and 68 to 89 per 1,000 children in South Africa (May, Gossage, Marais, et al., 2007). Estimates are substantially higher when children without the distinctive facial characteristics of FAS, but with in utero alcohol exposure, are considered (Viljoen, Gossage, Brooke, et al., 2005).
With regard to performance of motor skills, initial clinical observations and empirical studies of infants and very young children prenatally exposed to alcohol reported developmental delays of motor milestones. Subsequent studies demonstrated these motor deficits extend into childhood and adolescence in the form of compromised postural control (Roebuck, Simmons, Mattson, et al., 1998) and slower and more variable motor timing in the CNS and peripheral nervous system (PNS) (Simmons, Levy, Riley, et al., 2010; Simmons, Nguyen, Levy, et al., 2012; Wass, Simmons, Thomas, et al., 2002; Simmons, Thomas, Levy, et al., 2006; Simmons, Thomas, Levy et al., 2010). Much less is known about how this clinical group regulates force even though appropriate control of this parameter is essential to performing daily functional activities. In the only two studies of force completed to date, children with and without prenatal exposure to alcohol duplicated isometric (Simmons, Nguyen, Levy, et al., 2012) and concentric isotonic (Nguyen, Simmons, Levy, et al., 2012) target forces at different levels of force and under different visual feedback conditions. Isometric force is defined as the development of neuromuscular force without a change in muscle length and is used in daily tasks such as holding a pencil or grasping a bicycle brake handle. Concentric isotonic force occurs when a muscle shortens to produce a movement, as in lifting a cup. Results indicated that for both isometric and concentric isotonic force alcohol-exposed children were less accurate and more variable in maintaining the target force, and produced a relatively simple harmonic force signal with high organizational structure in the time domain.
These analyses revealed significantly different results between the two groups, but only the time domain results provided a profile of the underlying organizational structure of the force signal. That is, measures of response structure often reveal changes in response organization when measures of motor performance outcome, such as response accuracy, fail to do so (Deutsch and Newell, 2004). Additionally, knowledge of signal structure and how structure differs between clinical and control populations not only advances our general understanding of force control but also could facilitate the design of therapeutic programs that target deficits in motor force.
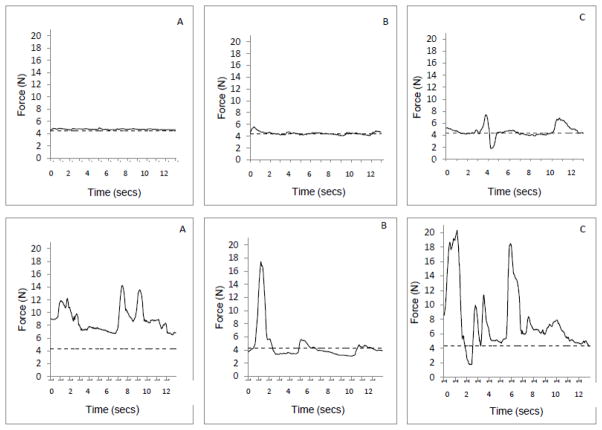
The present study examined whether organization of an isometric force signal differs between children with and without prenatal alcohol exposure when the signal is examined in the frequency domain. This was accomplished by applying a multivariate spectral estimation method with sinusoidal windows to the force-time signals produced by each participant (Thomson, 1982; Riedel and Sidorenko, 1995). Exemplar force-time records produced by a child from each group are presented in Figure 1. The spectral estimation method incorporates algorithms based on signal processing concepts that decompose the force-time signal into elements of different frequencies to produce a power spectral density function, with power associated with the force signal (the y-axis) expressed as a function of the frequency spectrum (the x-axis) as illustrated in Figure 2.
Figure 1.
Representative force-time signal records for two 8-year old participants without (top three panels) and with (bottom three panels) prenatal alcohol exposure. Panels A, B, and C are for visual feedback intervals of 20ms, 320ms and 740ms, respectively. The horizontal line in each graph represents a target force value (20% MVF). Data are for the last 13 seconds of each trial.
Figure 2.
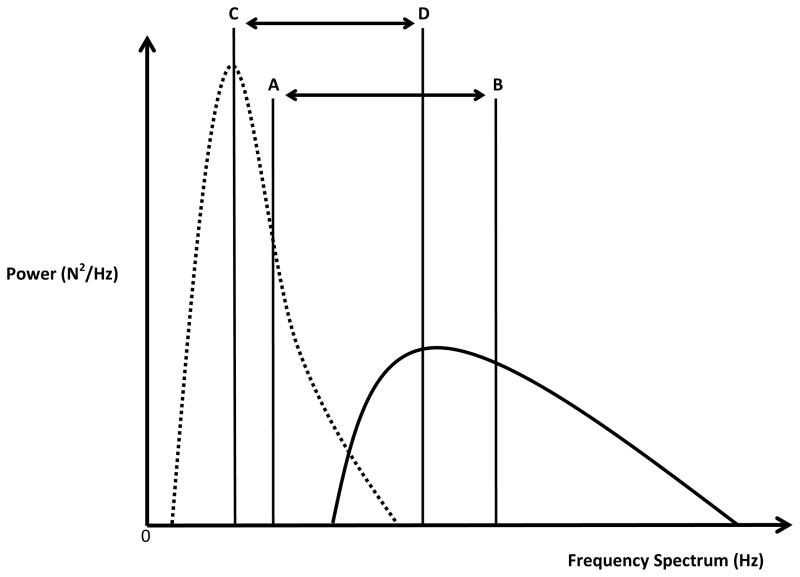
Stylized power spectral density functions for the ALC (dotted line waveform) and CON (solid line waveform) groups illustrating the predicted outcomes of the experiment. Letters A and B represent points of mean frequencies for the ALC and CON groups respectively, with a lower mean frequency predicted for the ALC group. Letters C and D indicate the frequencies at which peak power is expected to occur for the ALC and CON groups, respectively, with the ALC group producing a lower frequency value. The functions also illustrate the predictions of less spectral variability and greater peak power for the ALC group in comparison to the CON group.
Power spectral density represents how the total energy of a signal, which is comprised of various waveforms representing different signal frequencies, is distributed across the frequency spectrum. For example, a force-time response characterized by rapid (i.e., short-time scale) and variable (i.e., non-constant periodicity) changes to the signal will have power distributed across multiple frequencies that reflect the inherent variability of the signal. With power spectral density spread across the frequency spectrum, peak power will be relatively low. This form of signal could result from a variety of factors that impact the response, including the availability of frequent visual feedback information that facilitates fast on-line corrections to the force signal in order to reduce error about a target force. In contrast, the power of a slow (i.e., long-time scale) repeating (i.e., constant periodicity) signal will be concentrated within a small frequency bandwidth and peak power will be relatively high. This type of signal reflects on-line corrections that are slow in nature, as would occur if infrequent or no visual feedback information was available to guide the response.
Based on these two forms of responding, we predicted that the power spectral density function produced by children with prenatal alcohol exposure would differ from the function produced by control children in four ways. A graphical representation of the predictions are presented in Figure 2 as stylized power spectral density functions for the ALC (dotted curve) and CON (solid curve) groups. First, alcohol-exposed children are predicted to produce a force signal with long-time scale corrections of relative constant periodicity (Nguyen, Simmons, Levy, et al., 2012; Simmons, Nguyen, Levy, et al., 2012), resulting in a significantly lower mean frequency value of the power spectral density function. Letters A and B indicate the expected differences in mean frequencies for the ALC and CON groups, respectively. Second, the relative constant periodicity of the force signal would result in the energy of the force signal being concentrated about the mean frequency, which will be observed as significantly less spectral variability. Figure 2 illustrates the relatively smaller bandwidth of spectral variability for the ALC group compared to that of the CON group. Third, concentration of the power within a smaller frequency bandwidth would produce a significantly greater peak power value, as illustrated in Figure 2. Fourth, peak power of the function produced by the alcohol-exposed group is expected to occur at a significantly lower frequency. Group differences in the frequencies at which peak power occurs are indicated in Figure 2 by the letters C and D for the ALC and CON groups, respectively.
2.0 Methods
2.1 Participants
Twenty-five children (7–17 years) with histories of heavy prenatal alcohol exposure (ALC group) were recruited from a pool of children registered with the Center of Behavioral Teratology (CBT) at San Diego State University. As part of their regular participation within the CBT, all children were evaluated by a trained psychometrist using a comprehensive neuropsychological battery that included assessment of Full Scale IQ (FSIQ) using the Wechsler Intelligence Scale for Children – Third and Fourth Editions to assess level of global cognitive functioning between groups. Additionally, all participants were screened by a pediatric dysmorphologist using established criteria of specific facial anomalies (e.g., short palpebral fissures, long philtrum, and short epicanthal folds), pre- and/or post-natal growth deficiency (at or below the 10th percentile for either height or weight) and evidence of CNS dysfunction (Jones and Smith, 1973). Based on this screening process, the ALC group comprised 9 children with a diagnosis of FAS and 16 non-dysmorphic alcohol-exposed children. For the sample included in this retrospective study, heavy alcohol exposure was defined as more than 4 drinks/occasion at least once/week or greater than 13 drinks per week. Heavy maternal alcohol consumption was confirmed using social service and medical records, and responses to questionnaires completed by the biological mother or legal guardian.
Twenty-one control children without prenatal alcohol exposure (CON group) were recruited through referral to the CBT, electronic and non-electronic public notices, and through community events such as health fairs. All children in this group had also been previously evaluated by the same comprehensive neuropsychological battery used for the alcohol-exposed children. To be eligible for the CON group, children must not have had more than minimal prenatal exposure to alcohol, defined as ≤1 drink per week on average and never more than 2 drinks on any one occasion. The two groups were matched as closely as possible on age, gender, socioeconomic status and handedness. Demographic information is presented in Table 1.
Table 1.
Demographic information.
| ALC CON | ||
|---|---|---|
| Sex [M:F (M:F%)] | 15:10 (60.0:40.0) | 14:7 (66.6:33.3) |
| Age (years) [M (SD)] | 11.1 (2.5) | 12.1 (2.3) |
| FSIQ1[M (SD)] | 88.5 (17.8) | 107.8(12.6)* |
| SES2[M (SD)] | 48.2 (11.1) | 49.1(5.9) |
| Handedness [L:R(L:R%)] | 3:22(12.0:88.0) | 3:18(14.3:85.7) |
| Race N (%) | ||
| African American | 6(24.0) | 1 (4.7) |
| Caucasian | 16 (64.0) | 14 (66.6) |
| Mixed | 3(12.0) | 6 (28.5) |
p < .001; with the exception of FSIQ, no other group differences were found for any other demographic variable.
Intelligence scores were derived from either the Wechsler Intelligence Scale for Children-III or Wechsler Intelligence Scale for Children-IV depending on the time the child enrolled at the CBT.
Socioeconnomic status (SES) was estimated using the Hollingshead Four Factor Index of Social Status (Hollingshead 1975, unpublished data)
2.2 Apparatus and procedure
A flat screen computer monitor (51-cm diagonal) was positioned 0.5 m in front of the child. Between the participant and the monitor was a circular response key (15-mm diameter) mounted directly above a force transducer (ELFS-B3: 1.27 cm diameter; range 2–20 lbs; sensitivity 7.8 mV/lb: Entran Devices, Fairfield NJ). Force applied to the response key was registered by the load cell and sampled at 100 samples per second using a 16-bit analog-to-digital board and customized LabView programming (National Instruments, Austin, Texas, USA). Equipment was calibrated prior to testing so that without force applied to the response key the visual feedback display and recorded data registered a zero reading.
The experimental protocol and collection of informed consent and assent were conducted in accordance with procedures established by the Institutional Review Board at San Diego State University. While sitting in a height-adjusted chair, the child placed his/her dominant hand (defined as the hand used for writing) in a neutral, pronated position on two computer wrist pads with the distal pad of the extended index finger placed on the response key. The participant was positioned so that the dominant shoulder and arm were aligned with the response key. The participant’s non-dominant hand was placed on his or her lap or on the tabletop. The response involved increasing or decreasing force on the load cell but without movement of the index finger (i.e., isometric force) or the response key. In order to compare responses across participants, force signals were normalized with respect to maximum voluntary force (MVF), which was estimated by having each child exert maximum isometric force on the load cell over four trials (4 seconds long). The average of the last three trials defined MVF.
The experimenter provided a verbal description and demonstration of the task. Each 20-second trial was initiated by applying force to the response key that caused a series of yellow dots to appear in a left-to-right direction over time across the monitor. Up and down movement of the yellow dots was controlled by increasing and decreasing force on the load cell, respectively. Visual feedback information was programmed to appear every 20ms, 320ms, or 740ms. A target force of 5% or 20% of MVF was also displayed across the width of the monitor as a single, straight, red horizontal line. Children were instructed to superimpose the yellow dots over the red target force line. At the end of each trial a dialogue box appeared for 10 seconds and provided a root-mean-square (RMS) accuracy score that served as quantitative feedback. Children were instructed to keep the score as low as possible.
Participants completed six trials for each combination of target force (5% or 20% MVF) and visual feedback interval (20ms, 320ms or 740ms) (a total of 36 trials), which were separately counter-balanced across participants. An initial practice trial was followed by five test trials. To exclude initial adjustments in matching the target force, only data from the last 13 seconds (1300 data points) of the trial were used for the statistical analyses. At the conclusion of testing, each child was provided a small monetary reward.
2. 3 Data and statistical analysis
Demographic information for participant age, FSIQ and socioeconomic status (SES) was independently assessed using t-tests for independent samples. Data for each isometric force trial were analyzed using MATLAB (version 7.11) as previously described. An initial statistical comparison of children with FAS and non-dysmorphic children did not yield any differences between the two sub-groups and children were formed into a single alcohol-exposed group (ALC). The four dependent variables- the mean frequency of the power spectral density curve, spectral variability, peak power, and the frequency at which peak power occurred- were averaged across conditions within each participant and analyzed using a 2 (group) × 2 (target force level) × 3 (visual feedback interval) repeated measures analysis of covariance (ANCOVA). Group (ALC and CON) was a between-subject variable and force level (5% and 20% MVF) and visual feedback interval (20ms, 320ms and 740ms) were within-subject variables. Age was entered into each analysis as a covariate. Mauchly’s test was used to determine whether assumptions of sphericity and homogeneity of variance were violated. The Greenhouse-Geisser conservative estimate of degrees of freedom was used if assumptions of sphericity were not met and ε < .75. Additionally, for each of the dependent variables, regression slopes were examined to ensure linearity and homogeneity of regression. For all ANCOVA analyses, data met these assumptions across groups and conditions, therefore age was retained as a covariate. The assumption of independence of the covariate is less relevant, as random assignment of children was not a factor in the designation of groups/treatment, and the interpretation of adjusted mean values is appropriate (Overall & Woodward, 1977). A FSIQ was not included as a covariate in the analyses given the inappropriateness of covarying a variable on which populations differ (Adams et al., 1985; Dennis et al., 2009) and because controlling for IQ might remove important variance explained given its relationship with motor tasks. Alpha was set to 0.05 for main ANCOVA procedures and at 0.05 for each dependent variable when post hoc comparisons were performed. All statistical procedures were completed using IBM SPSS Statistics 19 software.
3.0 Results
3.1 Demographics
There were no significant differences between the two groups for age and SES (p> .05). Analysis of FSIQ revealed a significant difference (p = .001) with the ALC group having a lower average FSIQ than the CON group (see Table 1).
3.2 Mean Frequency
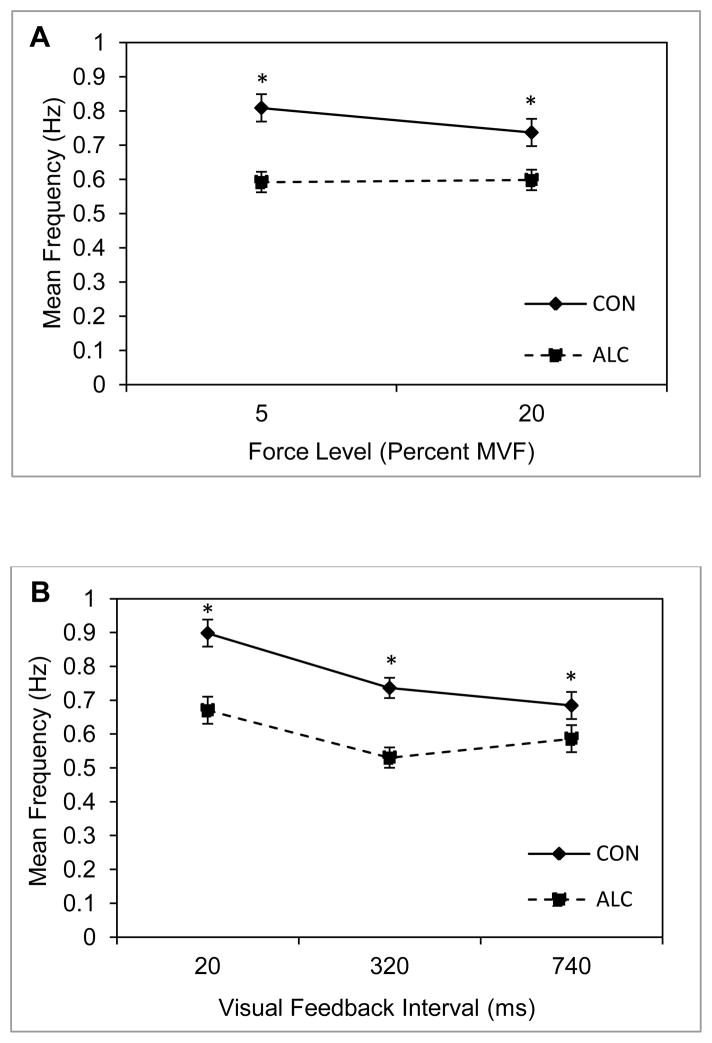
Results of the mean frequency analysis (presented in Figure 3) revealed a significant group main effect, F(1, 31) = 15.27, p = .0001, η2 = .33, together with a significant group by target force level interaction, F(1, 31) = 5.53, p = .003, η2 = .15. Inspection of Figure 3 reveals that the ALC group produced significantly lower mean frequency values at both levels of MVF than the CON group, with the difference between the two groups being greater at the 5% MVF level (p = .003) than at the 20% level (p = .049). A significant group by visual feedback interaction was also found, F(1.87, 57.86) = 4.48, p = .02, η2 = .13, ε < .75. Mean frequency was significantly lower for the ALC group for all three visual feedback conditions (20ms condition p = .013; 320ms condition p = .002; 740ms condition p = .04), but the magnitude of the difference between the two groups decreased as visual feedback interval increased from 20ms to 740ms (i.e., visual feedback availability decreased).
Figure 3.
Mean frequency and standard error of the mean for the ALC (N = 25) and CON (N = 21) groups. Panels A and B are for the two criterion isometric loads and three intervals of visual feedback, respectively. Asterisks indicate significance at alpha = .05 for between group post hoc comparisons.
3.3 Spectral Variability
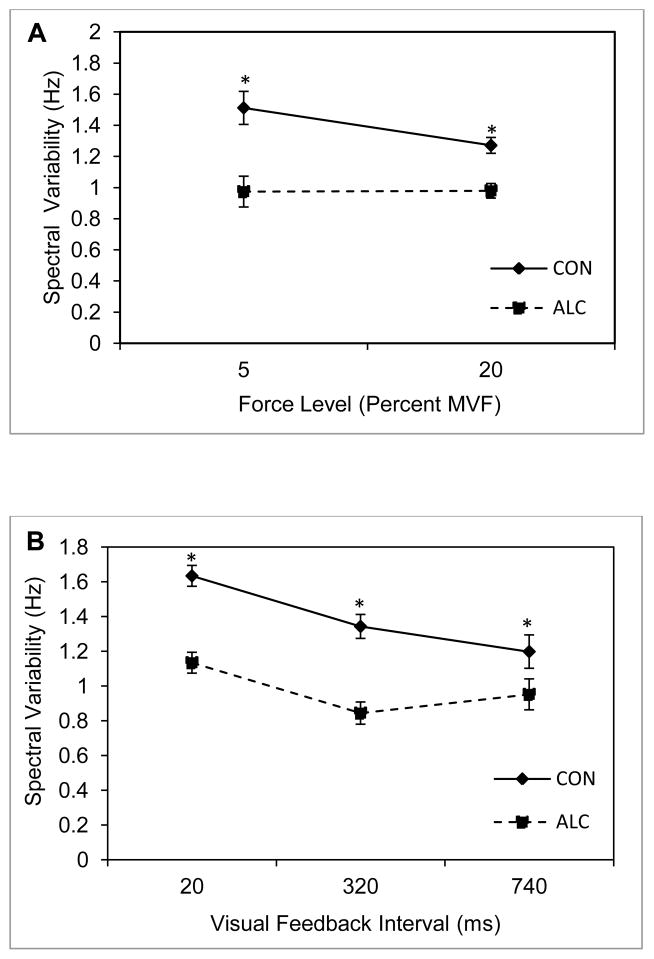
Figure 4 illustrates the results of the spectral variability analysis. A significant group main effect was found, F(1,40) = 22.49, p = .0001, η2 = .36, together with a significant group by visual feedback interval interaction, F(1.45, 57.81) = 4.13, p = .03, η2 = .09, ε < .75. Group mean values reveal that the ALC group produced less spectral variability than the CON group at all levels of visual feedback interval (20ms condition p = .008; 320ms condition p = .001; 740ms condition p = .016), but the difference between groups decreased as the visual feedback interval increased. With regard to force level, the ALC group produced significantly less spectral variability than the CON group for the 5% (p = .04) and 20% MVF conditions (p = .03). The main effect for target force level was not significant, F(1, 40) = 3.09, p = .09, η2 = .07.
Figure 4.
Mean spectral variability and standard error of the mean for the ALC (N = 25) and CON (N = 21) groups. Panels A and B are for two criterion isometric loads and three intervals of visual feedback, respectively. Asterisks indicate significance at alpha = .05 for between group post hoc comparisons.
3.4 Peak Power
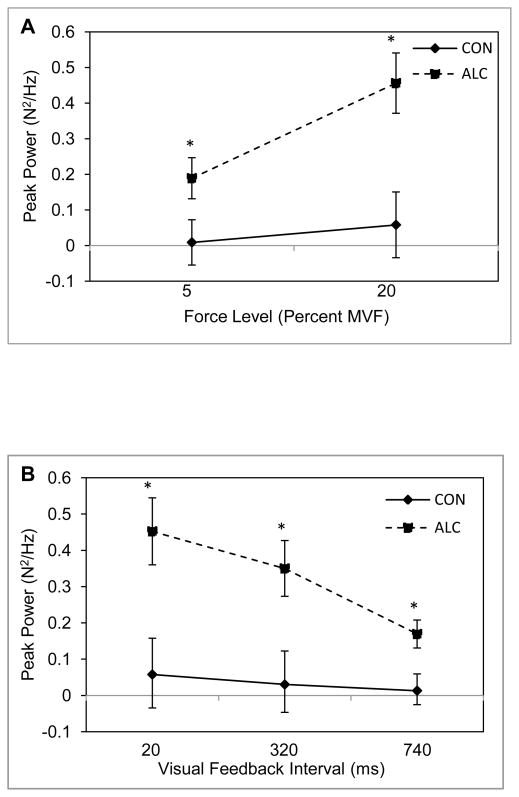
Analysis of peak power revealed a significant group main effect, F(1,28) = 8.48, p = .007, η2 = .23, and a group by target force level interaction, F(1,28) = 6.66, p = .02, η2 = .19. As illustrated in Figure 5, the ALC group produced greater peak power at both levels of MVF but the difference between the ALC and CON groups was greater at the 20% force level (p = .001) than the 5% force level (p = .005). A significant group by visual feedback interaction was also found, F(1.68, 47.04) = 4.68, p = .02, η2 = .14, ε < .75. Inspection of the means for each group revealed that the ALC group produced greater peak power values for all visual feedback intervals (20ms condition p = .003; 320ms condition p = .003; 740ms condition p = .001), but the difference in peak power between groups decreased as the visual feedback interval increased.
Figure 5.
Mean peak power and standard error of the mean for the ALC (N = 25) and CON (N = 21) groups. Panels A and B are for two criterion isometric loads and three intervals of visual feedback, respectively. Asterisks indicate significance at alpha = .05 for between group post hoc comparisons.
3.5 Peak Power Frequency
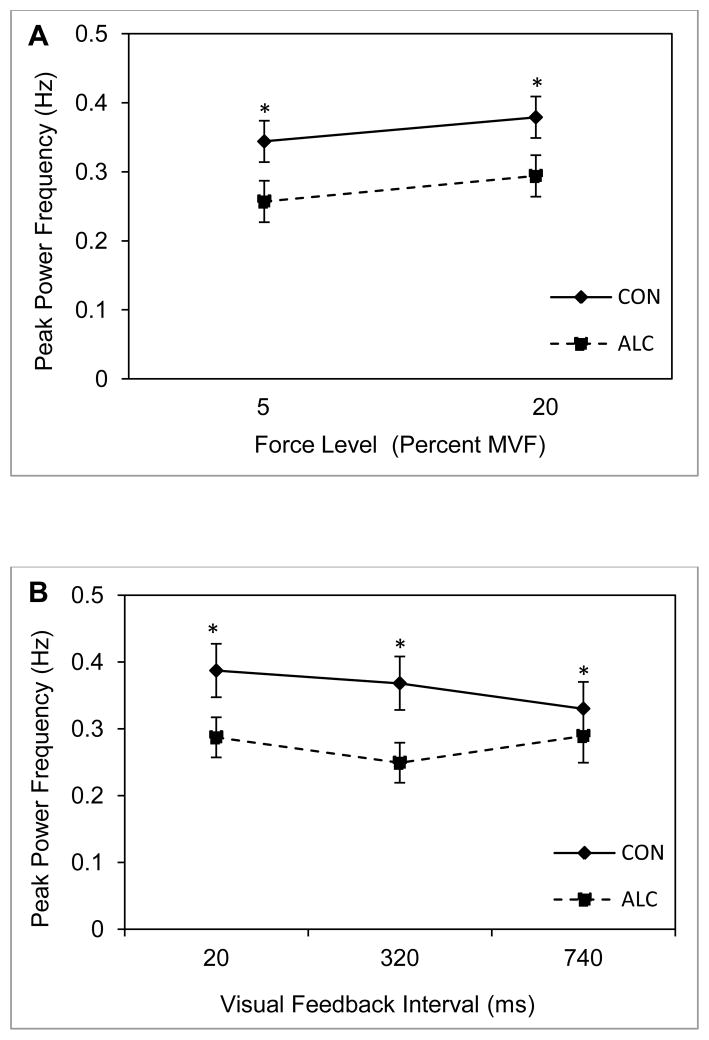
Results of the analysis of the frequency at which peak power occurred are presented in Figure 6 and reveal a significant group main effect, F(1,29) = 5.59, p = .03, η2 = .16. Regardless of target force level or visual feedback interval, peak power for the ALC group occurred at a significantly lower frequency than for the CON group. The main effect for target force level, F(1, 29) = .03, p = .87, η2 = .001, and the group by target force level interaction, F(1, 29) = .002, p = .97, η2 = .0001, were not significant. The variable of visual feedback also was not significant, F(1.84, 53.3) = 1.06, p = .35, η2 = .06, ε < .75.
Figure 6.
Mean peak power frequency and standard error of the mean for the ALC (N = 25) and CON (N = 21) groups. Panels A and B are for two criterion isometric loads and three intervals of visual feedback, respectively. Asterisks indicate significance at alpha = .05 for between group post hoc comparisons.
4.0 Discussion
For the two target force levels and three visual feedback conditions used in this study, results indicated that compared to the control group, the power spectral density function produced by the alcohol-exposed group had a significantly lower mean frequency, smaller spectral variability, greater peak power and a lower frequency at which peak power occurred. Eta squared values indicated that the ratio of variance for each dependent variable attributable to group assignment ranged from 16 to 36 percent. For mean frequency (33 percent) and spectral variability (36 percent), the contribution of group in explaining the variance was particularly high and indicates that for these two dependent variables group is a strong predictor of differences in force regulation.
However, the results also indicated that visual feedback interval and target force level differentially affected the frequency response characteristics associated with each group. With regard to visual feedback interval, mean frequency and spectral variability values for children with prenatal alcohol exposure were relatively comparable for each visual feedback condition, which indicates these children responded using the same long-time scale corrections regardless of how much visual feedback was available. In contrast, control group children experienced a change in frequency measures as visual feedback interval increased. This change reflects a shift from using short-time scale corrections when visual feedback was presented more often to use of long-time scale corrections, similar to those used by alcohol-exposed children, as visual feedback information was presented less often. The contribution of the visual feedback interval variable to the total variance was comparatively low (mean frequency = 2 percent and spectral variability = 9 percent) but differences in the way in which the two groups regulate force as feedback interval changes are apparent.
For the variable of peak power, the control group produced comparable values across visual feedback intervals while the alcohol-exposed group decreased peak power as visual feedback interval increased. That is, not only are alcohol-exposed children less able than control children to use visual feedback information to guide the isometric force response, but on-line corrections are slower (i.e., less frequent) when more visual more feedback information was available. This outcome may be caused by alcohol-related injury to the splenium (Sowell, Johnson, Kan, et al., 2008) leading to deficits in visuomotor integration (Mattson and Riley, 1998) and by alcohol-exposed children experiencing dysfunction in rapid visual information processing and executive function, particularly as information complexity increases (Rasmussen, Soleimani and Pei, 2011).
For the variable of target force level, mean frequency and spectral variability values produced by the alcohol-exposed group were comparable at the 5% and 20% MVF levels, whereas the control group had significantly lower values for these two measures at the 20% MVF level compared to the 5% MVF level. These results indicate that force level did not differentially affect isometric force regulation in alcohol-exposed children, but responding at the higher force level caused control children to use longer-time scale corrections to the force signal. Both groups experienced an increase in peak power at the 20% target force level, but the increase was disproportionately larger for the alcohol-exposed group. The energy associated with the force signal was highest for the 20% force load that, again, suggests that on-line corrections were slower at this force load level than for the 5% MVF level.
The different frequency response profiles for the two groups likely reflect the teratogenic effects of gestational alcohol exposure on the CNS. Structural neuroimaging studies reveal that alcohol exposure results in significant volume and size reductions in the basal ganglia, cerebellum, and corpus callosum, disproportionate white matter hypoplasia of the anterior vermis of the cerebellum, and abnormalities in white matter integrity of the corpus callosum (Mattson, Croker and Nguyen, 2011). Many of these neural systems are involved in regulating isometric force, particularly when scaling fine motor force (Brandauer, Hermsdorfer, Beck, et al., 2008; Haller, Chapuis, Gassert, et al., 2009; Keisker, Hepp-Reymond, Blickensdorfer, et al., 2010). We are currently conducting further studies to examine neuroanatomical correlates of force parameters.
The atypical frequency response characteristics produced by alcohol-exposed children have clinical implications. Animal models have shown that motor learning-based therapies attenuate alcohol related motor deficits and prompt plastic changes in the cerebellum (Klintsova, Scamra, Hoffman, et al., 2002). Whether the benefits of motor training can be extended to include alcohol-exposed children has yet to be investigated, but isometric force deficits in this clinical group are significant and should be targeted for remediation. Additionally, rehabilitation exercises should emphasize visuomotor integration skills and practice with different force loads that promote efficient perception-action coupling through the use of short-time scale corrections (Kelso, 2012).
Based on our results it is reasonable to expect that children with heavy prenatal alcohol exposure will perform some motor skills below levels attained by typically developing children. However, the ramifications of this difference in motor skill go beyond performing functional skills of daily life, because children perceived as being different from their contemporaries are frequently the targets of peer-generated stigmatization and ridicule that is socially, emotionally and psychologically isolating. This negative environment can result in life-long damage to the child’s self-confidence and esteem (Twyman, Saylor, Saia, et al., 2010).
It should be noted that IQ was not treated as a covariate in the present study. While we do not minimize the influence of overall level of cognitive functioning in determining patterns of performance in alcohol-exposed children, we believe that controlling for IQ in primary analyses via covarying is problematic for several reasons. First, it creates unrepresentative groups of subjects, thereby limiting generalizability of findings for clinicians and practitioners and, second, it produces overcorrected results by inappropriately removing a proportion of variance explained by the domain of interest (Dennis et al., 2009). However, future studies assessing the relation between prenatal alcohol exposure and motor performance might include an IQ-matched comparison group to control for any possible confounding effects.
In summary, children with prenatal alcohol exposure experience significant deficits in isometric force control when producing two force levels with three levels of visual feedback interval. These deficits likely result from the teratogenic effects of prenatal alcohol exposure on key structures of the CNS that are involved in force regulation and could affect daily activities in the lives of children with fetal alcohol spectrum disorders.
Acknowledgments
This study was supported in part by grants AA017256 and AA12446 awarded by the National Institute on Alcohol Abuse and Alcoholism.
Footnotes
Publisher's Disclaimer: This is a PDF file of an unedited manuscript that has been accepted for publication. As a service to our customers we are providing this early version of the manuscript. The manuscript will undergo copyediting, typesetting, and review of the resulting proof before it is published in its final citable form. Please note that during the production process errors may be discovered which could affect the content, and all legal disclaimers that apply to the journal pertain.
References
- Adams KM, Brown GG, Grant I. Analysis of covariance as a remedy for demographic mismatch of research subject groups: some sobering simulations. J Clin Exp Neuropsychol. 1985;7:445–462. doi: 10.1080/01688638508401276. [DOI] [PubMed] [Google Scholar]
- Brandauer B, Hermsdorfer J, Beck A, Aurich V, Gizewski ER, Marquardt C, et al. Impairments of prehension kinematics and grasping forces in patients with cerebellar degeneration and the relationship to cerebellar atrophy. Clin Neurophysiol. 2008;119:2528–2537. doi: 10.1016/j.clinph.2008.07.280. [DOI] [PubMed] [Google Scholar]
- Dennis M, Francis DJ, Cirino PT, Schachar R, Barnes MA, Fletcher JM. Why IQ is not a covariate in cognitive studies of neurodevelopmental disorders. J Int Neuropsychol Soc. 2009;15:331–343. doi: 10.1017/S1355617709090481. [DOI] [PMC free article] [PubMed] [Google Scholar]
- Deutsch KM, Newell KM. Changes in the structure of children’s isometric force variability with practice. J Exp Child Psychol. 2004;88:319–333. doi: 10.1016/j.jecp.2004.04.003. [DOI] [PubMed] [Google Scholar]
- Haller S, Chapuis D, Gassert R, Burdet E, Klarhöfer M. Supplementary motor area and anterior intraparietal area integrate fine-graded timing and force control during precision grip. Eur J Neurosci. 2009;30:2401–2406. doi: 10.1111/j.1460-9568.2009.07003.x. [DOI] [PubMed] [Google Scholar]
- Jones KL, Smith DW. Recognition of fetal alcohol syndrome in early infancy. Lancet. 1973;2:999–1001. doi: 10.1016/s0140-6736(73)91092-1. [DOI] [PubMed] [Google Scholar]
- Keisker B, Hepp-Reymond MC, Blickensdorfer A, Kollias SS. Differential representation of dynamic and static power grip force in the sensorimotor network. Eur J Neurosci. 2010;31:1483–1491. doi: 10.1111/j.1460-9568.2010.07172.x. [DOI] [PubMed] [Google Scholar]
- Kelso JAS. Multistability and metastability: understanding dynamic coordination in the brain. Philos Trans R Soc Lond B Biol Sci. 2012;367:906–918. doi: 10.1098/rstb.2011.0351. [DOI] [PMC free article] [PubMed] [Google Scholar]
- Klintsova AY, Scamra C, Hoffman M, Napper RM, Goodlett CR, Greenough WT. Therapeutic effects of complex motor training on motor performance deficits induced by neonatal binge-like alcohol exposure in rats: II. A quantitative study of synaptic plasticity in female rat cerebellum. Brain Res. 2002;24:83–93. doi: 10.1016/s0006-8993(02)02492-7. [DOI] [PubMed] [Google Scholar]
- Mattson SN, Riley EP. A review of the neurobehavioral deficits in children with fetal alcohol syndrome or prenatal exposure to alcohol. Alcohol: Clin Exp Res. 1998;22:279–294. doi: 10.1111/j.1530-0277.1998.tb03651.x. [DOI] [PubMed] [Google Scholar]
- Mattson SN, Crocker N, Nguyen TT. Fetal alcohol spectrum disorders: neuropsychological and behavioral features. Neuropsychol Rev. 2011;21:81–101. doi: 10.1007/s11065-011-9167-9. [DOI] [PMC free article] [PubMed] [Google Scholar]
- May PA, Fiorentino D, Coriale G, Kalberg WO, Hoyme HE, Aragón AS, et al. Prevalence of children with severe fetal alcohol spectrum disorders in communities near Rome, Italy: new estimated rates are higher than previous estimates. Int J Environ Res Publ Health. 2011;8:2331–2351. doi: 10.3390/ijerph8062331. [DOI] [PMC free article] [PubMed] [Google Scholar]
- May PA, Gossage JP, Kalberg WO, Robinson LK, Buckley D, Manning M, et al. Prevalence and epidemiologic characteristics of FASD from various research methods with an emphasis on recent in-schools study. Dev Disabil Res Rev. 2009;15:176–192. doi: 10.1002/ddrr.68. [DOI] [PubMed] [Google Scholar]
- May PA, Gossage JP, Marais AS, Adnams CM, Hoyme HE, Jones KL, et al. The epidemiology of fetal alcohol syndrome and partial FGAS in a South African community. Drug Alcohol Depend. 2007;88:259–271. doi: 10.1016/j.drugalcdep.2006.11.007. [DOI] [PMC free article] [PubMed] [Google Scholar]
- Nguyen TT, Simmons RW, Levy SS, Thomas JD, Mattson SN, Riley EP. Children with heavy prenatal alcohol exposure experience reduced control of isotonic force. Alcohol: Clin Exp Res. 2012 doi: 10.1111/j.1530-0277.2012.01896.x. in press. [DOI] [PMC free article] [PubMed] [Google Scholar]
- Overall JE, Woodward JA. Nonrandom assignment and the analysis of covariance. Psycho Bull. 1977;84:588–594. [Google Scholar]
- Rasmussen C, Soleimani M, Pei J. Executive functioning and working memory deficits on the CANTAB among children with prenatal alcohol exposure. J Popul Ther Clin Pharmacol. 2011;18:44–53. [PubMed] [Google Scholar]
- Riedel KS, Sidorenko A. Minimum Bias Multiple Taper Spectral Estimation. IEEE Trans Signal Process. 1995;43:188–195. [Google Scholar]
- Roebuck TM, Simmons RW, Mattson SN, Riley EP. Prenatal exposure to alcohol affects the ability to maintain postural balance. Alcohol: Clin Exp Res. 1998;22:252–258. [PubMed] [Google Scholar]
- Simmons RW, Levy SS, Riley EP, Madra NM, Mattson SN. Central and peripheral timing variability in children with heavy prenatal alcohol exposure. Alcohol: Clin Exp Res. 2010;33:400–407. doi: 10.1111/j.1530-0277.2008.00849.x. [DOI] [PMC free article] [PubMed] [Google Scholar]
- Simmons RW, Nguyen TT, Levy SS, Thomas JD, Mattson SN, Riley EP. Children with heavy prenatal alcohol exposure exhibit deficits when regulating isometric force. Alcohol: Clin Exp Res. 2012;36:302–309. doi: 10.1111/j.1530-0277.2011.01625.x. [DOI] [PMC free article] [PubMed] [Google Scholar]
- Simmons RW, Thomas JD, Levy SS, Riley EP. Motor response selection in children with fetal alcohol syndrome disorder. Neurotoxicol Teratol. 2006;28:278–85. doi: 10.1016/j.ntt.2006.01.008. [DOI] [PubMed] [Google Scholar]
- Simmons RW, Thomas JD, Levy SS, Riley EP. Motor response programming and movement time in children with heavy prenatal alcohol exposure. Alcohol. 2010;44:371–378. doi: 10.1016/j.alcohol.2010.02.013. [DOI] [PMC free article] [PubMed] [Google Scholar]
- Sowell ER, Johnson A, Kan E, Lu LH, Van Horn JD, Toga AW, et al. Mapping white matter integrity and neurobehavioral correlates in children with fetal alcohol spectrum disorders. J Neurosci. 2008;28:1313–1319. doi: 10.1523/JNEUROSCI.5067-07.2008. [DOI] [PMC free article] [PubMed] [Google Scholar]
- Thomson DJ. Spectrum Estimation and Harmonic Analysis. Proceedings IEEE. 1982;70:1055–1096. [Google Scholar]
- Twyman KA, Saylor CF, Saia D, Macias MM, Taylor LA, Spratt E. Bullying and ostracism experiences in children with special health care needs. J Dev Behav Pediatr. 2010;31:1–8. doi: 10.1097/DBP.0b013e3181c828c8. [DOI] [PubMed] [Google Scholar]
- Viljoen DL, Gossage JP, Brooke L, Adnams CM, Jones KL, Robinson LK, et al. Fetal alcohol syndrome epidemiology in a South African community: a second study of a very high prevalence area. J Stud Alcohol. 2005;66:593–604. doi: 10.15288/jsa.2005.66.593. [DOI] [PMC free article] [PubMed] [Google Scholar]
- Wass TS, Simmons RW, Thomas JD, Riley EP. Timing accuracy and variability in children with prenatal exposure to alcohol. Alcohol: Clin Exp Res. 2002;26:1887–1896. doi: 10.1097/01.ALC.0000042221.73478.4F. [DOI] [PubMed] [Google Scholar]


