

Abstract
The structure of F1-ATPase from Saccharomyces cerevisiae inhibited by the yeast IF1 has been determined at 2.5 Å resolution. The inhibitory region of IF1 from residues 1 to 36 is entrapped between the C-terminal domains of the αDP- and βDP-subunits in one of the three catalytic interfaces of the enzyme. Although the structure of the inhibited complex is similar to that of the bovine-inhibited complex, there are significant differences between the structures of the inhibitors and their detailed interactions with F1-ATPase. However, the most significant difference is in the nucleotide occupancy of the catalytic βE-subunits. The nucleotide binding site in βE-subunit in the yeast complex contains an ADP molecule without an accompanying magnesium ion, whereas it is unoccupied in the bovine complex. Thus, the structure provides further evidence of sequential product release, with the phosphate and the magnesium ion released before the ADP molecule.
Keywords: F1-ATPase, natural inhibitor, catalysis, intermediate
2. Introduction
The hydrolysis of ATP by the F-ATPase isolated from mitochondria is inhibited by a small basic protein, known as IF1 [1]. When the purified enzyme was co-reconstituted into phospholipid vesicles with bacteriorhodopsin, IF1 had no effect on ATP synthesis, whereas ATP hydrolysis by the purified enzyme was inhibited [2]. The binding of IF1 to the enzyme requires the hydrolysis of ATP to drive the anticlockwise rotation of the central stalk (as viewed from the membrane domain of the intact enzyme) and entrap the inhibitor in its binding site. Bovine IF1, the most extensively characterized ATPase inhibitor protein, consists of a chain of 84 amino acids [3,4]. Residues 21–83 are folded into a long α-helix, and the active form is a dimer held together by an antiparallel coiled-coil of α-helices from residues 49 to 81 [5–7]. The inhibitory region is found in residues 1–46 [8], and the dimeric inhibitor can inhibit two F1-ATPase complexes simultaneously [9]. A monomeric form, prepared by deleting residues 61–84, is also an effective inhibitor. The structure of bovine F1-ATPase inhibited with this monomeric inhibitor (known as F1-I1–60) shows the N-terminal region of IF1 from residues 1–13 lying within the aqueous cavity surrounding an α-helical coiled-coil in the γ-subunit that forms the rotor of F1-ATPase; residues 1–7 were unresolved and residues 8–13 form an extended structure [8]. Residues 14–18 are folded into a single turn of an α-helix, which interacts with the coiled-coil region of the γ-subunit; residues 19 and 20 link this short α-helix to the long α-helix of the inhibitor, which extends outwards from residue 21 beyond the external surface of the α3β3-domain of the enzyme. Residues 21–46 of this long α-helix occupy a deep groove, formed mainly by α-helices and loops in the C-terminal domains of the αDP- and βDP-subunits in a catalytic interface of F1-ATPase, and hydrophobic interactions between the inhibitor and the βDP-subunit provide most of the binding energy [10].
The ATPase inhibitor protein from Saccharomyces cerevisiae is 63 amino acids long. The poorly conserved N-terminal region (residues 1–16; figure 1), is followed by a well-conserved segment from residues 17 to 45, corresponding to the long α-helix in the inhibitory region of the bovine protein. However, the C-terminal segment responsible for the formation of dimers in the bovine protein is truncated and not conserved in the yeast protein.
Figure 1.

Alignment of the sequences of residues 1–60 of bovine IF1, and the equivalent region of yeast IF1, with the same regions from other species. The purple, green and yellow stripes denote identical, highly conserved and poorly conserved residues, respectively. The alignment was performed with ClustalW. The bars above the sequences denote α-helical regions in the bovine protein. The yIF1 used in crystallization experiments contained the mutation E21A.
As described here, the structure of yeast F1-ATPase inhibited with residues 1–53 of yeast IF1 (yI1–53) has been determined at 2.5 Å resolution. Many features of this structure are similar to those of the structure of bovine F1-I1–60. However, one significant difference is that the yeast inhibitor has arrested the catalytic cycle of ATP binding and hydrolysis followed by product release at an earlier stage in the cycle than the bovine inhibitor. This structure provides independent confirmation of a new intermediate in the catalytic cycle of F1-ATPase, observed in a structure of bovine F1-ATPase [11], which immediately precedes the formation of the ‘open’ or ‘empty’ state observed in the ‘ground state’ structure.
3. Results
3.1. Oligomeric states of inhibitor proteins
The complex of yeast F1-ATPase inhibited with full-length yeast IF1 was estimated by gel filtration chromatography to have an apparent molecular mass of 385 kDa, whereas the value for the complex between the bovine F1-ATPase and full-length bovine IF1 was 670 kDa (figure 2). These data are consistent with the yeast and bovine F1-IF1 complexes being monomeric and dimeric, respectively, with the dimeric bovine inhibitor bound to two F1-ATPase complexes, as demonstrated before [6].
Figure 2.

Gel filtration chromatography of yeast and bovine F1-ATPase-IF1 complexes. The yeast and bovine enzymes were inhibited with the inhibitor protein from S. cerevisiae (yF1) and with bovine IF1 (bIF1), respectively. (a) Column profiles of yF1–yIF1, active yF1 and bF1–bIF1 complexes, respectively. V0 is the void volume of the column. (b) SDS–PAGE analysis of peaks 1, 2 and 3 from (a).
3.2. Structure determination
The inhibited complex between yeast F1-ATPase and yeast I1–53, known as yF1-I1–53, was formed in the presence of Mg-ATP as described in §5. Its structure (figure 3) was determined by X-ray crystallography, and was solved by molecular replacement (see §5) with data at 2.5 Å resolution. The asymmetric unit contains two yF1-I1–53 complexes. Data processing and refinement statistics are summarized in table 1. The final model of yF1-I1–53 contains the following residues: αE, 26–509; αTP, 25–406 and 412–509; αDP, 26–509; βE, 8–475; βTP, 7–475; βDP, 6–475; γ, 1–59 and 71–276; δ, 11–23 and 27–137; ε, 1–49 and 53–61 and yI1–53, 1–36. The refined temperature factors suggested the presence of a mixture of Mg-ATP (75%) and Mg-ADP (25%) in the nucleotide binding site of the non-catalytic αE-subunit, whereas the nucleotide binding sites in the αTP-, βDP- and βTP-subunits all contained Mg-ADP only. The nucleotide binding site of the αDP-subunit was occupied almost entirely by Mg-ADP, but there was also evidence for the presence of Mg-ATP at low occupancy. The βE-subunit contained a bound ADP molecule only, and there was no electron density corresponding to either bound phosphate or a magnesium ion. The models of both assemblies in the asymmetric unit contain the same residues and have the same nucleotide occupancy. Their structures are essentially identical (the r.m.s. value from a global superimposition was 0.34 Å; the values for individual subunits are between 0.01 and 0.02 Å).
Figure 3.

The structure of the F1-I1–53 complex from S. cerevisiae. The α-, β-, γ-, δ- and ε-subunits are depicted in ribbon form in red, yellow, dark blue, green and magenta, respectively, and residues 1–36 of I1–53 are light blue. (a) Overall view of the complex viewed from the side with IF1 shown in solid representation. (b) View (upwards from the foot of the central stalk) along the axis of the γ-subunit showing the position of the α-helix of yeast IF1 in ribbon representation relative to the C-terminal domains of α- and β-subunits.
Table 1.
Data collection and refinement statistics for the complex between yeast F1-ATPase and the yeast inhibitor protein, yI1–53. Statistics for the highest resolution bin (2.64–2.5 Å) are shown in parentheses.
| space group | P21 |
| unit cell dimensions a, b, c (Å); β (o) | 118.2, 187.8, 181.8; 90.0 |
| resolution range, Å | 43.84–2.5 (2.64–2.5) |
| no. unique reflections | 268 620 (38 863) |
| multiplicity | 3.9 (3.9) |
| completeness, % | 98.4 (97.6) |
| Rmergea | 10.9 (74.8) |
| 〈I/σ(I)〉 | 8.7 (2.0) |
| B factor, from Wilson plot, Å2 | 56.0 |
| water molecules | 735 |
| R factorb | 22.44% |
| free R factorc | 26.19% |
| r.m.s. of bonds, Å | 0.009 |
| r.m.s. of angles, ° | 1.2 |
aRmerge = ∑h∑i|I(h) − I(h)i|∑h∑iI(h)i, where I(h) is the mean weighted intensity after rejection of outliers.
bR factor = ∑hlk||Fobs| − k|Fcalc||/∑hlk|Fobs|, where Fobs and Fcalc are the observed and calculated structure factor amplitudes, respectively.
cRfree = ∑hkl⊂T||Fobs| − k|Fcalc||/∑hkl⊂T||Fobs|, where Fobs and Fcalc are the observed and calculated structure factor amplitudes, respectively, and T is the test set of data omitted from refinement (5% in this case).
3.3. Structure of the yeast F1-IF1 complex
In the structure (figure 3), the resolved part of yeast I1–53 is found between the C-terminal domains of the αDP- and βDP-subunits. This region consists of an extended structure from residues 1 to 16, bent into a loop from residues 6 to 16 (figure 4a), with residues 17–36 folded into an α-helix 29 Å long (figure 4b). Residues 17–35 of the α-helix are bound into a deep groove between the C-terminal domains of the αDP- and βDP-subunits (figure 4c). The polypeptide chain beyond residue 36 presumably extends from the external surface of the F1-domain. Residues 1–5 of the inhibitor are in the aqueous chamber surrounding the γ-subunit in the central region of the F1-domain. Residue E2 makes a salt bridge with residue αE-K361 in α-helix H (see Abrahams et al. [12] for definition of secondary structure elements) in the nucleotide binding region of the αE-subunit. Residues 6–16 form a loop region held together by a salt bridge between residues R9 and D15 of the inhibitor, and by a hydrogen-bonding network involving residues S4, R9 and D15 of the inhibitor (figure 4a). In this region, the structure of the yeast inhibitor differs from that of the N-terminal region of the bovine inhibitor bound to bovine F1-ATPase (figure 4b), reflecting the difference in length between the yeast and bovine inhibitors and the lack of sequence similarity in their N-terminal regions (figure 1). Nonetheless, the two N-terminal regions occupy a similar space in the respective F1-ATPases (figure 4b). The loop motif in residues 6–16 of the yeast inhibitor protein replaces the motif consisting of the α-helical turn and the following extended region in the bovine protein. However, both motifs are in contact with the N-terminal α-helix of the γ-subunit. From residue 17, the yeast inhibitor forms an α-helix that extends to residue 36 in the structure. The bovine protein contains a similar α-helix beginning at residue 21, one residue before the yeast protein in the aligned sequences and structures, and continuing up to residue 50. These α-helical regions of the bovine and yeast inhibitor proteins are bound in a related way, and occupy the same cleft between the C-terminal domains of the αDP- and βDP-subunits. Most of the cleft lies between the C-terminal ends of helices 1 and 2 in the C-terminal domains of the βDP- and αDP-subunits. The entrance to the cleft from the central cavity is close to the C-terminal end of helix 1 in the C-terminal domain of the βTP-subunit, and the exit to the exterior surface of the F1-domain is completed by loops between helices 1 and 2 in the C-terminal domain of the αDP-subunit, and between helices 4 and 5 in the C-terminal domain of the βDP-subunit.
Figure 4.

The binding site for yeast I1–53 in the structure of yeast F1-ATPase. (a) The N-terminal loop region of the inhibitor protein (light blue) in juxtaposition with the C-terminal helix of the γ-subunit (dark blue). Dotted lines represent possible interactions with distances in angstrom. (b) View from the side of the central stalk showing the orientations of the yeast and bovine inhibitor proteins (light blue and brown, respectively) relative to the central stalk. (c) View from outside the F1-domain towards the γ-subunit of the enzyme (dark blue) of the deep cleft between the C-terminal domains of the αDP- and βDP-subunits (red and yellow, respectively) where the α-helical region of I1–53 (light blue) is bound. The position of the equivalent region of the bovine inhibitor protein in the structure of bovine F1-I1–60 is shown in brown. (d) View of the bovine inhibitor (brown) superposed onto the yeast inhibitor protein (light blue) via residues 22–25 and 17–20 in the bovine and yeast inhibitors, respectively.
Although there are similarities between the binding modes of the α-helices of the yeast and bovine inhibitor proteins, they are not identical. Global superimposition via the Cα-atoms of the two inhibited structures demonstrates their overall similarity (figure 4b; r.m.s. value 2.48 Å), and the structures of the inhibitors themselves in the inhibited complexes are also similar (figure 4d). However, in the inhibited complexes, the α-helices of yeast I1–53 and bovine IF1 do not lie exactly on the same axis; the α-helix of the yeast protein follows a steeper path, relative to the approximately vertical central stalk of F1-ATPase, and the paths of the bound inhibitors diverge increasingly towards the outside the F1-domain with an angle of ca 7° between the α-helices. The most obvious reason for the slightly different binding position of IF1 in the bovine and yeast enzymes is a significant alteration in the conformation of residues 391–398 of the βDP-subunit of F1-ATPase; for example, the positions of the Cα atoms of residues 392 and 393 differ by 1.6 and 2.7 Å, respectively. Residues 391–398 of the βDP-subunit help to form the ‘base’ of the binding pocket for IF1, and the displacement of this region in the yeast enzyme relative to the bovine enzyme accompanies the downward displacement of the long α-helix of IF1. In both the bovine and yeast F1-IF1 structures, residues 382–398 of the βDP-subunit are the region that deviates most from the bovine ground state structure. Its change in conformation is associated with the binding of IF1, and it is reasonable to suggest that this difference between the bovine and yeast F1-IF1 structures reflects how each enzyme adapts in order to bind the different sequences of bovine and yeast IF1, resulting in the slightly different binding modes. These slightly differing binding modes are illustrated by the superimposed structures of the yeast and bovine inhibitor proteins in the F1-IF1 complexes (figure 4b,c). One specific interaction supports this interpretation. In the bovine complex, βDP-D394 interacts with R32 of IF1 to form a salt bridge, and the position of the loop containing residues 391–398 is influenced and displaced by γR133. In the yeast enzyme, βD394 is conserved, but the bovine IF1 residue R32 is replaced by F27 in yeast IF1, and the different conformation of yeast βDP-residues 391–398 arises from βDP-D394 moving away from the hydrophobic side chain of yeast inhibitor residue F27, and the position of the loop is no longer influenced by γK135, the equivalent of bovine γR133 (see the electronic supplementary material, figure S1).
In consequence of these slightly different modes of binding, there are both similarities and differences in the detailed interactions between the inhibitor proteins and their cognate F1-ATPases. The residues in the long α-helix of bovine IF1 that contribute significantly to its binding to bovine F1-ATPase have been identified by mutagenesis of each residue in the α-helix, and by quantitative measurement of the impact of each mutation on binding [10]. These experiments have shown that the bovine α-helix is bound mainly by hydrophobic interactions between residues Y33, F34, Q41, L42 and L45 of the inhibitor protein and hydrophobic side chains in the C-terminal domain of the βDP-subunit, and F22 with the C-terminal domain of the βTP-subunit. In addition, bovine inhibitor residue Q41 contributes by making polar interactions with the same region of the βDP-subunit, and there is a salt bridge between inhibitor residue E30 and residue R408 in the βDP-subunit.
The structure of yF1-I1–53 shows that residues F17, E25 and F28 in yI1–53 and the equivalent residues, F22, E30 and Y33, in the bovine inhibitor, interact with their cognate F1-ATPases in the same manner. However, the other interactions noted in the bovine complex are not conserved, but the structure indicates that there are additional significant interactions that are specific to the yeast complex. They are a salt bridge between residue E2 of the inhibitor with residue K361 in α-helix H of the αE-subunit (figure 4c), and between R32 of the inhibitor and E398 and E405 in the βDP-subunit, and an electrostatic interaction between inhibitor residue D15 and R9 in the γ-subunit. In addition, inhibitor residues D15 and R9 form an ionic interaction, evidently helping to stabilize the loop from inhibitor residues 6–16 (figure 4a), and E33 makes a backbone interaction with the amide nitrogen of βDP-E454. There are other yeast specific interactions between inhibitor residues T5, G6 and S11 with γS12, βDPD386 and βDPE341, respectively.
In order to investigate some of these detailed differences between the mode of binding of the yeast and bovine inhibitors, residues E2, R9 and D15 of yeast IF1 were substituted singly by alanine residues, as was residue R30, which has been proposed to be important for forming the inhibited complex [13]. In addition, two conserved leucine residues, L37 and L40, were mutated to alanine. The corresponding residues L42 and L45 interact with F1-ATPase in the bovine-inhibited complex, but no equivalent interaction is found in yF1-I1–53. The results of the quantitative study of the binding properties of each of these mutated proteins are presented in table 2, and the effects of the mutations are summarized in figure 5 as Kimut/Kiwt, the quotient of the dissociation constants of the mutant and wild-type proteins. Values of the quotient that are greater than and less than unity correspond to proteins with decreased and increased binding to F1-ATPase, respectively. The experiments show that among the three N-terminal residues E2, R9 and D15 that were mutated, only the mutation of R9A had a significant effect in increasing the quotient. However, because the substitution D15A had little effect on the quotient (although it changed the dynamics of binding significantly), the importance of R9 in the formation of the inhibited complex does not involve the formation of a salt bridge with residue D15. In the absence of detailed structures of the mutated forms bound to F1-ATPase, the impact of these mutations is difficult to assess. The mutation L40A leads to an increase in the quotient, indicating that this residue may have a role at some unidentified intermediate state in the pathway of the formation of the final inhibited complex, as has been suggested for other residues in the bovine complex [10]. The substitution L37A had little impact on the quotient, and the reason for its conservation remains obscure. Finally, the mutation R30A, rather than abolishing the inhibitory activity of yIF1, as reported [13], decreased the quotient slightly.
Table 2.
The binding and dissociation rate constants for yI1–53His proteins containing point mutations.
| mutation | kon × 10−2 (μM−1 s−1) | koff × 10−2 (s−1) | Ki × 10−2 (μM−1) |
|---|---|---|---|
| none | 58.3 ± 5.6 | 2.8 ± 0.3 | 4.8 ± 0.7 |
| E2A | 12.3 ± 0.3 | 0.1 ± 0.0 | 1.0 ± 0.1 |
| R9A | 11.4 ± 0.8 | 1.9 ± 0.2 | 17.0 ± 2.1 |
| D15A | 170.7 ± 2.1 | 1.4 ± 0.6 | 0.8 ± 0.4 |
| R30A | 127.8 ± 6.8 | 0.3 ± 0.2 | 0.2 ± 0.2 |
| L37A | 19.1 ± 1.0 | 0.4 ± 0.4 | 2.2 ± 1.9 |
| L40A | 11.6 ± 1.2 | 1.8 ± 0.3 | 15.6 ± 2.9 |
Figure 5.

Influence of point mutation of selected residues in yI1–53 on its inhibition of yeast F1-ATPase. The quantitative data from which the figure is derived are given in table 2. Kiwt and Kimut are the dissociation constants for the wild-type and mutant proteins, respectively.
4. Discussion
4.1. The inhibited state
One highly significant difference between the structures of the bovine and yeast inhibited complexes is in the occupancy of nucleotides in the βE-subunit. In the bovine structure, there is no nucleotide bound to this subunit, whereas in the yeast complex, the still partially formed nucleotide binding site of the βE-subunit is occupied by ADP, but without an accompanying bound magnesium ion, despite the presence of 13 mM magnesium sulphate during formation and crystallization of the inhibited complex. In the yeast complex, the C-terminal domains of the αDP- and αTP-subunits are displaced downwards and outwards, opening the αDP–βDP and αTP–βTP interfaces slightly relative to the bovine complex. This opening of these two interfaces is accompanied by small, but significant, changes in the βE-subunit, where βE-Y345 and βE-F424 remain sufficiently close to provide a pocket into which the adenosine moiety of ADP can bind (albeit presumably weakly). However, the amino acid side chains that are involved in coordinating a magnesium ion indirectly by binding ligand water molecules (βE189, βE193 and βD256) have moved away from the positions that provide the coordinating environment (as found in the βDP- and βTP-subunits), and the magnesium ion has been released from the βE-subunit (figure 6). Thus, the present structure indicates that the magnesium ion is released before ADP, and that the inhibitor has arrested the catalytic cycle of ATP hydrolysis immediately preceding the release of the nucleotide. Subsequent release of the nucleotide would provide the βE-state observed in the ‘ground state’ structures of F1-ATPase where no nucleotide is bound to this subunit. One cautionary note is that it is possible that the position of α-helix C3 in the C-terminal domain of the βE-subunit, carrying residue βE-F424, could be influenced by a contact in the crystal lattice with α-helix b (residues 102–110) in the δ-subunit of an adjacent F1-complex (figure 7). As residues βE-F424A and βE-Y345 provide the pocket for binding the adenosine moiety of ADP molecule, one possible interpretation is that α-helix C3 and the adenosine binding pocket are being held artificially in this position by the crystal contact. However, one significant argument against this interpretation is that a closely related conformation of a βE-subunit, containing a bound ADP molecule, also lacking an associated magnesium ion, has been observed independently in a structure of bovine F1-ATPase, known as F1-PH, crystallized in the presence of nucleotides, magnesium ions and phosphonate, a chelating agent for magnesium [11]. Global superimposition of the βE-subunits in the yF1-I1–53 and F1-PH structures demonstrates that the conformations and nucleotide occupancies of the nucleotide binding sites are essentially identical (r.m.s. value 0.79 Å; figure 7), and that there are no similar crystal contacts that could influence the conformation of the βE-subunit in F1-PH. Thus, both structures appear to represent a post-hydrolysis pre-nucleotide release step in the catalytic cycle of the enzyme.
Figure 6.

Change in the coordination of a magnesium ion in the active site of yeast F1-ATPase. (a) Hexacoordination of the magnesium ion (green) in the catalytic site of the βDP-subunit. The ligands are provided by water molecule a–d (red), by the oxygen atom βO2 of ADP (or ATP), and by the β-hydroxy-group of βDP-T164. The water molecules a–d are themselves hydrogen-bonded to other water molecules e–g (grey), by the oxygen atom βO1 of the nucleotide, and by the side chain functionalities of residues βDP-E189, βDP-R190 and βDP-D256. (b) Schematic of the disposition of the magnesium ion and bound ADP in the catalytic site of the βDP-subunit. The P-loop sequence (upper left) helps to bind the magnesium ion and the nucleotide. The adenosine moiety of the nucleotide is bound in the hydrophobic pocket between the side chains of residues βDP-Y345 and βDP-F424. Distances are given in angstrom, and those to the phosphate group are to the closest oxygen atom. (c) Rotation of γ-subunit driven by hydrolysis of ATP has opened the nucleotide binding domain of the subunit, converting the βDP-site to the βE-site. The catalytic ‘arginine finger’ residue, αR375 becomes disordered, and the coordination sphere of the magnesium ion is disrupted, releasing the metal ion. In the structure of yF1-I1–53, the inhibitor protein has arrested the conversion of the site just before the formation of a fully ‘empty’ or ‘open’ site. The adenosine binding pocket is still intact, and ADP remains bound to the subunit. In the final step of the conversion of the site to a fully formed βE-site (as observed in ‘ground state’ structures of F1-ATPase), the side chain of βE-F424 rotates through 90°, releasing the ADP molecule.
Figure 7.
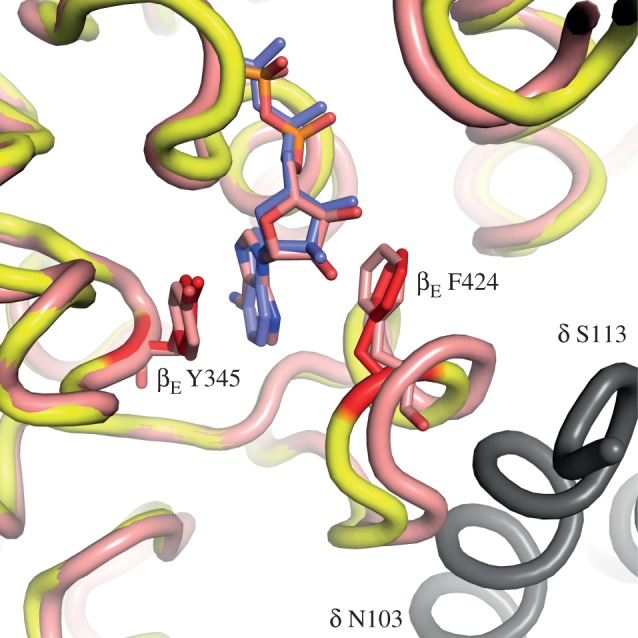
Comparison of the nucleotide binding pockets in the βE-subunits in the structures of yF1-I1–53 and bovine F1-PH. The yeast and bovine protein backbones are coloured yellow and pink, respectively. The side chains of residues βE-F424 and βE-Y345 are red in the yeast enzyme and pink in the bovine enzyme. They provide the pocket for binding the adenosine moieties of the ADP molecules (blue and pink, respectively in the yeast and bovine enzymes). In grey is shown α-helix b (residues 102–110) in the δ-subunit of an adjacent yeast F1-complex in the crystal lattice of yeast F1-I1–53. It approaches to within 4 Å of α-helix C3 carrying βE-F424 in the yeast structure. Thus, it makes a crystal contact that may influence the position of α-helix C3 in the βE-subunit of the yeast enzyme.
Alternatively, it can be argued that the presence of the bound inhibitor protein distorts the structure of F1-ATPase and leads to an inhibited state that is not on the active pathway of ATP hydrolysis. The close similarity of the βE-subunit in the present and bovine F1-PH structures (figure 7) can be taken as evidence against this interpretation. There is no inhibitor protein bound to F1-PH, and the structure of the βE-subunit fits well with the interpretation that it represents a post-hydrolysis, pre-nucleotide release state in the catalytic cycle. The other structural changes in yeast F1-ATPase, described earlier, associated with the presence of the bound inhibitor are quite minor, as a global superimposition of the current structure with the yeast ground state structure demonstrates. Using ‘complex I’ from the yeast ground state structure, the r.m.s values are 1.27 Å for the whole complexes and 1.02 Å for the α3β3-domains. Therefore, the preferred interpretation is that the structure represents an intermediate in the catalytic cycle.
At present, there is no clear explanation of why the bovine and yeast inhibitors arrest the catalytic cycle of their cognate F1-ATPases at different points. Structures of the bovine enzyme inhibited with the yeast inhibitor and vice versa might help to elucidate this point. However, the observation does raise the prospect that it may be possible to engineer inhibitor proteins to arrest the catalytic cycle of the active enzyme at other points and thereby capture other states in the catalytic cycle for structural analysis.
4.2. Mechanism of hydrolysis of ATP by F1-ATPase
One important conclusion reached from pairwise comparisons of all the known structures of F1-ATPase (with the possible present exception of yeast F1-I1–53) is that the conformations of the catalytic sites in the three β-subunits of the enzyme are not influenced by contacts between neighbouring complexes in the lattice of the crystals used to determine the structures [14], contrary to what has been proposed [15–19]. Therefore, the structures of the catalytic sites in a ‘ground state’ structure [20,21] and in a ‘transition state’ analogue structure [22] define steps in the catalytic pathway of ATP hydrolysis by F1-ATPase, as described previously and summarized in the electronic supplementary material, figure S3. In the ‘ground state’ structure, the three catalytic sites in the β-subunits of the enzyme have different structures that are imposed by the asymmetry of the γ-subunit in the central stalk of the enzyme. They are usually referred to as the βDP-, βTP- and βE-subunits. In a catalytic cycle, each catalytic subunit passes through each of these states, and the conversion of one state to another is brought about by the rotation in 120° steps of the central stalk in an anticlockwise fashion (as viewed from the membrane domain of the intact F-ATPase). Each 360° rotation is accompanied by the hydrolysis of three ATP molecules. In the ground state structure, the βE-subunit has no nucleotide bound to its nucleotide binding site. A 120° rotary step converts the βE-subunit to the βTP-subunit, entrapping an ATP molecule in the nucleotide binding site. The next 120° step converts the βTP-subunit to the βDP-subunit, poising the site for ATP hydrolysis. In the next 120° step hydrolysis occurs; the products magnesium.ADP and phosphate are released from the enzyme and the βE-subunit is regenerated. In the transition state analogue complex, the conformation of the βE-subunit is intermediate between those of the βDP- and βE-subunits, and it defines the state of the enzyme during the cleavage of the γ-phosphate from ATP by nucleophilic attack by a water molecule, itself activated by βDP-E189 (βDP-E188 in the bovine enzyme). The present structure defines the conformation of the βE-subunit after the βE-subunit in the transition state analogue structure, and before the formation of that of the βE-subunit in the ground state structure. In this state, the magnesium ion and phosphate have been released, but the nucleotide, ADP, is still bound to the βE-subunit. It is incorporated into the pathway of ATP hydrolysis (see electronic supplementary material, figure S3). In two other NTPases, protein-1A (a member of the kinesin superfamily) [23] and rasp21 [24], it has been shown similarly that following the hydrolysis of an NTP molecule, the magnesium ion is released before the product NDP.
The evidence concerning the order of release of the magnesium ion and phosphate from F1-ATPase is at first sight somewhat contradictory. In one of the three copies of the enzyme in the ‘ground state’ crystal structure of yeast F1-ATPase, phosphate (or sulphate) remains bound in the βE-subunit in a position approximately 8 Å from the γ-phosphate of AMP–PNP in other nucleotide binding sites, suggesting that it is released last [25]. However, there is no phosphate bound in the other two copies of the enzyme in the crystal lattice, or in the current structure, suggesting that in the yeast enzyme, both the magnesium ion and phosphate are released before the nucleotide in an unknown order. In the bovine enzyme, the evidence also suggests that both magnesium and phosphate are released before the nucleotide. Although there is often density in ‘ground state’ structures of bovine F1-ATPase close to the P-loop that can be interpreted as a bound anion, when this density is modelled as a phosphate group the temperature factors are very high, and there are only a few favourable interactions with the protein. In addition, this feature lies in a position midway between the α- and β-phosphates of a bound nucleotide, and therefore could not be occupied at the same time. Also, it is remote (7–8 Å) from the clearly identified phosphate binding site in the ‘half-closed’ βE-subunit of the bovine transition state complex [22] and in the βE-subunit of the yeast ‘ground state’ structure [25]. Therefore, probably this site is an anion binding pocket that is occupied fortuitously by phosphate or sulphate in the crystal structures, and it does not represent a catalytically or physiologically relevant phosphate binding site. In addition, in the structure of bovine F1-PH where nucleotide is bound to the βE-subunit, there is no bound phosphate or magnesium ion, suggesting that they are released before the nucleotide.
5. Material and methods
5.1. Analytical methods
Protein concentrations were estimated by the bicinchoninic acid assay (Pierce, Thermo Scientific, Rockford, IL, USA). Purified proteins were analysed by SDS–PAGE [26] and stained with Coomassie blue dye. ATPase activity was measured as described before [1]. Molecular masses of proteins were measured following electrospray ionization in a Quattro Ultima triple quadrupole mass spectrometer (Waters, Milford, MA, USA).
5.2. Protein overexpression
A fragment of bovine IF1 from residues 14 to 60 fused to glutathione-S-transferase (GST) with a C-terminal His6 tag (known as bIF114–60-GST-His6) was over-expressed as described before [10]. The sequence encoding residues 1–53 of IF1 from S. cerevisiae (yI1–53) was amplified by PCR from a pRUN vector containing the coding sequence for yeast IF1 containing the mutation E21A. This mutation abolishes the pH sensitivity of the inhibitory action of the inhibitor protein [13], and therefore it offers the prospect of conducting crystallization experiments involving the inhibited complex over a wider range of pH values. The forward and reverse primers, respectively, were 5′-TAATACGACTCACTATAGGG-3′ and 5′-CAGAAGCTTTTAAGAATCAATCTTCTTTCGTTG-3′. The product was digested with NdeI and HindIII, and cloned into the pRun plasmid. yI1–53 was over-expressed for 12 h at 25°C in Escherichia coli strain BL21(DE3), as described previously [27].
The sequence encoding residues 1–53 of IF1 from S. cerevisiae (yI1–53) together with a hexahistidine tag was amplified by PCR from the yI1–53 pRun plasmid. Single point amino acid substitutions were introduced into this sequence with a series of pairs of synthetic complementary oligonucleotide primers containing the mutated codons and 24 bases 5′ and 3′ of the codon, respectively. This region was amplified by PCR, and extended in a second PCR with primers flanking the 5′ and 3′ ends of the coding sequence for yI1–53His. The modified sequences were cloned into the pRun vector. The mutant proteins plasmids were over-expressed from these expression plasmids for 4 h at 25°C in E. coli strain C41(DE3) [28].
5.3. Protein purification
The full-length bovine and yeast inhibitor proteins and bIF114–60-GST-His6 were expressed and purified as described previously [10]. The C-terminally truncated yeast inhibitor protein yI1–53 containing the mutation E21A and lacking a His-tag was used in crystallization experiments. It was expressed as described before and purified at 4°C as follows. Cells containing yI1–53 were suspended in buffer containing 50 mM Tris–HCl, pH 7.4, 100 mM NaCl, 25 mM imidazole, 5 mM benzamidine hydrochloride, 5 mM 6-aminocaproic acid, 0.005 per cent phenylmethylsulfonyl fluoride, 0.02 per cent sodium azide and one tablet per 50 ml of an EDTA-free protease inhibitor mixture (Roche Diagnostics, Mannheim, Germany). The cells were disrupted by two passages at 30 000 psi through a Z Plus 2.2 kW cell disruptor (Constant Systems, Daventry, UK). The broken cells were centrifuged (200 000g, 90 min), and the supernatant was filtered through a membrane (0.22 μm pore size, Sartorius, Göttingen, Germany). The filtrate was heated to 60°C under nitrogen for 20 min in the presence of 5 mM dithiothreitol, centrifuged (9000g, 15 min) and dialysed for 12 h against a buffer containing 20 mM 1,3-diaminopropane, pH 10.5, 1 mM EDTA, 1 mM benzamidine hydrochloride, 1 mM 6-aminocaproic acid, 0.005 per cent phenylmethylsulfonyl fluoride and 0.02 per cent sodium azide. It was loaded onto a Hi-Trap Q column (5 ml; GE Healthcare Bio-Sciences AB, Uppsala, Sweden). Pure yI1–53 was recovered in the breakthrough fractions. It was dialysed for 10 h against 20 mM Tris–HCl, pH 7.4, concentrated to 10 mg ml−1 and stored at −25°C. Cells containing mutant yI1–53His proteins were broken as described earlier. They were applied to a Hi-Trap nickel Sepharose column (GE Healthcare, Buckinghamshire, UK) equilibrated in buffer containing 20 mM Tris–HCl, pH 7.4, 10% (v/v) glycerol, 25 mM imidazole and 0.1 M sodium chloride. yI1–53His and mutant forms were eluted with a linear gradient of imidazole from 25 to 300 mM in a total volume of 100 ml. Fractions containing the proteins were pooled and dialysed for 4 h against 2 l of buffer consisting of 20 mM Tris–HCl, pH 7.4, and concentrated with a VivaSpin concentrator (molecular weight cut-off 5 kDa; Sartorius, Göttingen, Germany). The analysis of the purified inhibitors by SDS–PAGE and their mass spectrometric characterization are shown in electronic supplementary material, figure S2 and table S1, respectively.
5.4. Purification of F1-ATPase
Saccharomyces cerevisiae (strain W303-1A; kindly provided by B.L. Trumpower, Dartmouth Medical School, NH, USA) was grown at 30°C in an Applikon ADI 1075 fermenter (Applikon, Schiedam, Netherlands) in 55 l of medium consisting of 1 per cent yeast extract, 2 per cent peptone, 3% v/v glycerol and adenine (0.055 g l−1), pH 5.0. When the culture had reached late exponential phase (A600 8.0–9.0), the cells were cooled to 18°C and harvested at 18 000g in a continuous flow centrifuge. The following procedures were carried out at 4°C. Yeast cells (1.8 kg) were suspended in 2 vol (v/w) of buffer consisting of 100 mM Tris–HCl, pH 8.0, 650 mM sorbitol, 5 mM EDTA, 5 mM benzamidine, 5 mM 6-aminohexanoic acid, 0.005 per cent phenylmethylsulfonyl fluoride and 0.2 per cent bovine serum albumin. The suspension was passed through a Dyno-Mill bead mill (W. A. Bachofen Machinery, Basel, Switzerland). The pH of the broken cells was adjusted to pH 8.0 with Trizma (3 M). Debris was removed by centrifugation at 7500g for 30 min. Mitochondria were recovered from the supernatant by centrifugation at 26 000g for 45 min. They were washed twice with buffer containing 20 mM Tris–HCl, pH 7.5, 650 mM sorbitol, 1 mM EDTA, 5 mM benzamidine, 5 mM 6-aminohexanoic acid and 0.005 per cent phenylmethylsulfonyl fluoride, and re-suspended in buffer containing 50 mM Tris–HCl, pH 8.0, 250 mM sucrose, 5 mM benzamidine hydrochloride, 5 mM 6-aminocaproic acid and one tablet per 50 ml of an EDTA-free protease inhibitor mixture. Submitochondrial particles were prepared as described previously [29]. F1-ATPase from a 50 ml portion of submitochondrial particles (20 mg ml−1) was released with chloroform [29] in the presence of 2 mM ADP and 4 mM magnesium sulphate. A tablet of an EDTA-free protease inhibitor cocktail, a solution (250 μl) containing 1 M of each of benzamidine hydrochloride and 6-aminohexanoic acid, and of mixture (250 μl in methanol) of 10 mM each of amastatin, besatatin, pepstatin, leupeptin and diprotin were added. A twofold molar excess of bIF114–60-GST-His6 and 100 μl of a neutralized stock solution containing 500 mM ATP and 1 M magnesium sulphate were added at 23°C. Two further portions of 100 μl of the same solution were added after 5 and 10 min. Methanol (10%), sodium chloride (150 mM) and dithiothreitol (5 mM) were added to the solution of the inhibited complex. It was applied at 4°C with a flow rate of 0.5 ml min−1 to a GSTrap affinity column (5 ml; GE Healthcare Bio-Sciences AB) equilibrated in buffer consisting of 50 mM Tris–HCl, pH 8.0, 10 per cent methanol, 250 mM sucrose, 150 mM sodium chloride, 1 mM ATP, 2 mM magnesium sulphate, 5 mM benzamidine hydrochloride, 5 mM 6-aminocaproic acid, 5 mM dithiothreitol and one tablet per 50 ml of an EDTA-free protease inhibitor mixture. The column was washed with the same buffer, then transferred to 23°C and then washed again with the same buffer containing 50 mM EDTA and 50 mM EGTA, and no methanol or DTT, and with ADP instead of ATP, to release the active F1-ATPase. The recovered yeast F1-ATPase was passed through a column of Superdex 200 (10/300; GE Healthcare Bio-Sciences AB) at 0.5 ml min−1. The specific activity of the purified enzyme was 216 U mg−1. The analysis of the purified enzyme by SDS–PAGE and the mass spectrometric characterization of its subunits are shown in the electronic supplementary material, figure S2 and table S1, respectively.
5.5. Molecular mass estimation of inhibited complexes
All procedures were performed at 23°C. F1-ATPase (1 mg ml−1; 100 μl) from S. cerevisiae in F1 buffer consisting of 50 mM 3-morpholinopropanesulfonic acid, pH 6.6, 10% (w : v) glycerol, 1 mM ADP, 2 mM magnesium sulphate and 0.002% (w/v) phenylmethanesulfonylfluoride was mixed with a 15-fold molar excess of IF1 from S. cerevisiae (10 mg ml−1; 3 μl) or a fivefold molar excess of bovine IF1 (10 mg ml−1; 1.3 μl) together with 1 mM ATP and 2 mM magnesium sulphate (2 μl from a stock solution containing 20 mM ATP and 40 mM magnesium sulphate). Further portions (2 μl) of the solution of ATP and magnesium sulphate were added after 5 min and 10 min. The inhibited complexes and the active F1-ATPase were applied separately to a column of Superose 6 (10/300, GE Healthcare Bio-Sciences AB) pre-equilibrated with F1 buffer. The absorbance of the eluate was monitored at 280 nm, and fractions were analysed by SDS–PAGE. The void volume of the column was determined with Blue Dextran 2000. The column was calibrated with thyroglobulin, catalase and the monomeric and dimeric forms of ferritin.
5.6. Assay of inhibition of F1-ATPase
The ATP hydrolase activity of yF1-ATPase in the presence of the various mutant inhibitors was measured with an ATP-generating system as described before [1] by addition of 2.5 μg of F1-ATPase (specific activity; 101 μmol min−1 mg−1) to 1 ml of assay mixture at 37°C. The absorbance at 340 nm was recorded for 10 min with each inhibitor at six different concentrations.
The rate constants of binding to and dissociation from F1-ATPase, kon and koff, respectively, of each inhibitor protein were measured from the exponential decay of the rate of ATPase activity after addition of various amounts of inhibitor protein as described previously [10]. The dissociation constant, Ki, for the binding of the inhibitor to the enzyme was calculated from Ki = koff/kon.
5.7. Crystallization of the yeast F1-I1–53 complex
Active F1-ATPase (12 mg ml−1) was exchanged on a Biospin-6 desalting column (BioRad, Hemel Hempstead, UK) into crystallization buffer, prepared in D2O and consisting of 100 mM Bis–Tris propane, pH 7.5, 100 mM sucrose, 1 mM ADP and 10 mM magnesium sulphate. Then, the enzyme was inhibited at 23°C with a fourfold molar excess of yI1–53 (containing the mutation E21A and lacking a His-tag) in the presence of 1 mM ATP and 2 mM magnesium sulphate. Further portions (5 μl of a neutralized stock solution containing 200 mM ATP and 400 mM magnesium sulphate ml−1 protein solution) were added after 5 and 10 min. More than 95 per cent of the ATP hydrolysis activity of the enzyme was inhibited. Sodium–potassium tartrate was added to 100 mM, and the concentration of the protein solution was adjusted to 10 mg ml−1 with crystallization buffer. Crystals were grown at 23°C in 72 well micro-batch plates (Nunc International, Thermo Fisher Scientific, Roskilde, Denmark) under filtered paraffin oil (BDH laboratory supplies, Poole, UK). The crystallization drops (4 μl) contained a 1 : 1 mixture of protein solution and precipitant solution (20–26% polyethylene glycol 3000 and 600 mM NaCl prepared in D2O). Crystals appeared after 2 days and were fully grown after two weeks. They were harvested into a solution identical to the crystallization drop, but containing an additional 1% (w/v) polyethylene glycol 3000. They were cryoprotected with 20% (v/v) ethylene glycol introduced in 5 per cent steps with 3 min at each step. The cryoprotected crystals were harvested with Micro-Mount cryoloops (MiTeGen, Ithaca, NY, USA), plunge-frozen in liquid nitrogen and stored at 100 K.
5.8. Data collection
Diffraction data were collected at 100 K at 2.5 Å resolution using a MX300 charge-coupled detector (Rayonix, Evanston, IL, USA) on beamline I24 (λ = 0.977 Å) at the Diamond Light Source, Harwell, UK. The data were processed with iMOSFLM [30] and with programs POINTLESS, SCALA [31] and CTRUNCATE [32] from the Collaborative Computational Project Number 4 (CCP4) suite [33].
5.9. Solution and refinement of the structure
The structure of yF1-I1–53 from S. cerevisiae was solved by molecular replacement with PHASER [34]. The starting model was complex I taken from a ground state structure of F1-ATPase from S. cerevisiae (protein data bank 2HLD) [25]. Nucleotides, magnesium ions and water molecules were removed from the model. Rigid body refinement, restrained refinement and non-crystallographic symmetry refinement were performed with REFMAC5 [35]. Manual rebuilding and the addition of water molecules were performed with COOT [36], alternating with refinement performed with REFMAC5. For calculations of the Rfree value, 5 per cent of the diffraction data were excluded from the refinement. Stereochemistry was assessed with MolProbity [37] and figures were prepared with PyMol [38]. The structure was compared with other structures using the SUPER alignment tool in PyMol with refinement cycles set to zero. Coordinates and structure factors for the described structure have been deposited with the protein data bank under the accession code 3zia.
6. Acknowledgements
J.E.W. designed and supervised the project. G.C.R., J.V.B., M.G.M. and I.M.F. carried out the experiments. J.E.W., M.G.M., A.G.W.L. and G.C.R. analysed the data. J.E.W., G.C.R., M.G.M. A.G.W.L. and D.M.M. prepared the manuscript. We thank S. Palmer for growing cells of S. cerevisiae, D. M. Rees for a sample of pure bIF114–60-GST-His6, and the staff at beamline I24 at the DIAMOND Light Source for help with collection of data. Support for this work was provided by the Medical Research Council, UK, including a PhD studentship (to G.C.R.) and a Career Training Fellowship (to J.V.B.), by the European Drug Initiative in Channels and Transporters (EDICT; to J.E.W.), and by a grant from NIH no. R01GM66223 to D.M.M. The authors declare that they have no conflict of interest.
Supplementary Material
References
- 1.Pullman ME, Penefsky H, Datta A, Racker E. 1960. Partial resolution of the enzymes catalysing oxidative phosphorylation. Purification and properties of soluble, dinitrophenol-stimulated adenosine triphosphatase. J. Biol. Chem. 235, 3322–3329 [PubMed] [Google Scholar]
- 2.Runswick MJ, Bason JV, Montgomery MG, Robinson GC, Fearnley IM, Walker JE. 2013. The affinity purification of ATP synthase complexes from mitochondria. Open Biol. [DOI] [PMC free article] [PubMed] [Google Scholar]
- 3.Frangione B, Rosenwasser E, Penefsky HS, Pullman ME. 1981. Amino acid sequence of the protein inhibitor of mitochondrial adenosine triphosphatase. Proc. Natl Acad. Sci. USA 78, 7403–7407 10.1073/pnas.78.12.7403 (doi:10.1073/pnas.78.12.7403) [DOI] [PMC free article] [PubMed] [Google Scholar]
- 4.Walker JE, Gay NJ, Powell SJ, Kostina M, Dyer MR. 1987. ATP synthase from bovine mitochondria: sequences of imported precursors of oligomycin sensitivity conferral protein, factor 6, and adenosinetriphosphatase inhibitor protein. Biochemistry 26, 8613–8619 10.1021/bi00400a018 (doi:10.1021/bi00400a018) [DOI] [PubMed] [Google Scholar]
- 5.Cabezon E, Butler PJ, Runswick MJ, Walker JE. 2000. Modulation of the oligomerization state of the bovine F1-ATPase inhibitor protein, IF1, by pH. J. Biol. Chem. 275, 25 460–25 464 10.1074/jbc.M003859200 (doi:10.1074/jbc.M003859200) [DOI] [PubMed] [Google Scholar]
- 6.Cabezon E, Arechaga I, Jonathan P, Butler G, Walker JE. 2000. Dimerization of bovine F1-ATPase by binding the inhibitor protein, IF1. J. Biol. Chem. 275, 28 353–28 355 10.1074/jbc.C000427200 (doi:10.1074/jbc.C000427200) [DOI] [PubMed] [Google Scholar]
- 7.Cabezon E, Runswick MJ, Leslie AGW, Walker JE. 2001. The structure of bovine IF1, the regulatory subunit of mitochondrial F-ATPase. EMBO J. 20, 6990–6996 10.1093/emboj/20.24.6990 (doi:10.1093/emboj/20.24.6990) [DOI] [PMC free article] [PubMed] [Google Scholar]
- 8.Gledhill JR, Montgomery MG, Leslie AGW, Walker JE. 2007. How the regulatory protein, IF1, inhibits F1-ATPase from bovine mitochondria. Proc. Natl Acad. Sci. USA 104, 15 671–15 676 10.1073/pnas.0707326104 (doi:10.1073/pnas.0707326104) [DOI] [PMC free article] [PubMed] [Google Scholar]
- 9.Cabezon E, Montgomery MG, Leslie AGW, Walker JE. 2003. The structure of bovine F1-ATPase in complex with its regulatory protein IF1. Nat. Struct. Biol. 10, 744–750 10.1038/nsb966 (doi:10.1038/nsb966) [DOI] [PubMed] [Google Scholar]
- 10.Bason JV, Runswick MJ, Fearnley IM, Walker JE. 2011. Binding of the inhibitor protein IF1 to bovine F1-ATPase. J. Mol. Biol. 406, 443–453 10.1016/j.jmb.2010.12.025 (doi:10.1016/j.jmb.2010.12.025) [DOI] [PMC free article] [PubMed] [Google Scholar]
- 11.Rees DM, Montgomery MG, Leslie AGW, Walker JE. 2012. Structural evidence of a new catalytic intermediate in the pathway of ATP hydrolysis by F1-ATPase from bovine heart mitochondria. Proc. Natl Acad. Sci. USA 109, 11 139–11 143 10.1073/pnas.1207587109 (doi:10.1073/pnas.1207587109) [DOI] [PMC free article] [PubMed] [Google Scholar]
- 12.Abrahams JP, Leslie AGW, Lutter R, Walker JE. 1994. Structure at 2.8 Å resolution of F1-ATPase from bovine heart mitochondria. Nature 370, 621–668 10.1038/370621a0 (doi:10.1038/370621a0) [DOI] [PubMed] [Google Scholar]
- 13.Ichikawa N, Karaki A, Kawabata M, Ushida S, Mizushima M, Hashimoto T. 2001. The region from phenylalanine-17 to phenylalanine-28 of a yeast mitochondrial ATPase inhibitor is essential for its ATPase inhibitory activity. J. Biochem. 130, 687–693 10.1093/oxfordjournals.jbchem.a003035 (doi:10.1093/oxfordjournals.jbchem.a003035) [DOI] [PubMed] [Google Scholar]
- 14.Montgomery MG, Leslie AGW, Walker JE. 2013 in preparation.
- 15.Senior AE, Nadanaciva S, Weber J. 2002. The molecular mechanism of ATP synthesis by F1Fo-ATP synthase. Biochim. Biophys. Acta 1553, 188–211 10.1016/S0005-2728(02)00185-8 (doi:10.1016/S0005-2728(02)00185-8) [DOI] [PubMed] [Google Scholar]
- 16.Weber J, Senior AE. 2003. ATP synthesis driven by proton transport in F1Fo-ATP synthase. FEBS Lett. 545, 61–70 10.1016/S0014-5793(03)00394-6 (doi:10.1016/S0014-5793(03)00394-6) [DOI] [PubMed] [Google Scholar]
- 17.Masaike T, Koyama-Horibe F, Oiwa K, Yoshida M, Nishizaka T. 2008. Cooperative three-step motions in catalytic subunits of F1-ATPase correlate with 80° and 40° substep rotations. Nat. Struct. Mol. Biol. 15, 1326–1333 10.1038/nsmb.1510 (doi:10.1038/nsmb.1510) [DOI] [PubMed] [Google Scholar]
- 18.Nakamoto RK, Baylis Scanlon JA, Al-Shawi MK. 2008. The rotary mechanism of the ATP synthase. Arch. Biochem. Biophys. 476, 43–50 10.1016/j.abb.2008.05.004 (doi:10.1016/j.abb.2008.05.004) [DOI] [PMC free article] [PubMed] [Google Scholar]
- 19.Sielaff H, Rennekamp H, Engelbrecht S, Junge W. 2008. Functional halt positions of rotary F1Fo-ATPase correlated with crystal structures. Biophys. J. 95, 4979–4987 10.1529/biophysj.108.139782 (doi:10.1529/biophysj.108.139782) [DOI] [PMC free article] [PubMed] [Google Scholar]
- 20.Kagawa R, Montgomery MG, Braig K, Leslie AGW, Walker JE. 2004. The structure of bovine F1-ATPase inhibited by ADP and beryllium fluoride. EMBO J. 23, 2734–2744 10.1038/sj.emboj.7600293 (doi:10.1038/sj.emboj.7600293) [DOI] [PMC free article] [PubMed] [Google Scholar]
- 21.Bowler MW, Montgomery MG, Leslie AGW, Walker JE. 2007. Ground state structure of F1-ATPase from bovine heart mitochondria at 1.9 Å resolution. J. Biol. Chem. 282, 14 238–14 242 10.1074/jbc.M700203200 (doi:10.1074/jbc.M700203200) [DOI] [PubMed] [Google Scholar]
- 22.Menz RI, Walker JE, Leslie AGW. 2001. Structure of bovine mitochondrial F1-ATPase with nucleotide bound to all three catalytic sites: implications for the mechanism of rotary catalysis. Cell 106, 331–341 10.1016/S0092-8674(01)00452-4 (doi:10.1016/S0092-8674(01)00452-4) [DOI] [PubMed] [Google Scholar]
- 23.Nitta R, Okada Y, Hirokawa N. 2008. Structural model for strain-dependent microtubule activation of Mg-ADP release from kinesin. Nat. Struct. Mol. Biol. 15, 1067–1075 10.1038/nsmb.1487 (doi:10.1038/nsmb.1487) [DOI] [PubMed] [Google Scholar]
- 24.Vetter IR, Wittinghofer A. 2001. The guanine nucleotide-binding switch in three dimensions. Science 294, 1299–1304 10.1126/science.1062023 (doi:10.1126/science.1062023) [DOI] [PubMed] [Google Scholar]
- 25.Kabaleeswaran V, Puri N, Walker JE, Leslie AGW, Mueller DM. 2006. Novel features of the rotary catalytic mechanism revealed in the structure of yeast F1-ATPase. EMBO J. 25, 5433–5442 10.1038/sj.emboj.7601410 (doi:10.1038/sj.emboj.7601410) [DOI] [PMC free article] [PubMed] [Google Scholar]
- 26.Laemmli UK. 1970. Cleavage of structural proteins during the assembly of the head of bacteriophage T4. Nature 227, 680–685 10.1038/227680a0 (doi:10.1038/227680a0) [DOI] [PubMed] [Google Scholar]
- 27.van Raaij MJ, Orriss GL, Montgomery MG, Runswick MJ, Fearnley IM, Skehel JM, Walker JE. 1996. The ATPase inhibitor protein from bovine heart mitochondria: the minimal inhibitory sequence. Biochemistry 35, 15 618–15 625 10.1021/bi960628f (doi:10.1021/bi960628f) [DOI] [PubMed] [Google Scholar]
- 28.Miroux B, Walker JE. 1996. Over-production of proteins in Escherichia coli: mutant hosts that allow synthesis of some membrane proteins and globular proteins at high levels. J. Mol. Biol. 260, 289–298 10.1006/jmbi.1996.0399 (doi:10.1006/jmbi.1996.0399) [DOI] [PubMed] [Google Scholar]
- 29.Walker JE, Fearnley IM, Gay NJ, Gibson BW, Northrop FD, Powell SJ, Runswick MJ, Saraste M, Tybulewicz VL. 1985. Primary structure and subunit stoichiometry of F1-ATPase from bovine mitochondria. J. Mol. Biol. 184, 677–701 10.1016/0022-2836(85)90313-4 (doi:10.1016/0022-2836(85)90313-4) [DOI] [PubMed] [Google Scholar]
- 30.Battye TG, Kontogiannis L, Johnson O, Powell HR, Leslie AGW. 2011. iMOSFLM: a new graphical interface for diffraction-image processing with MOSFLM. Acta Crystallogr. D, Biol. Crystallogr. 67, 271–281 10.1107/S0907444910048675 (doi:10.1107/S0907444910048675) [DOI] [PMC free article] [PubMed] [Google Scholar]
- 31.Evans PR. 2011. An introduction to data reduction: space-group determination, scaling and intensity statistics. Acta Crystallogr. D, Biol. Crystallogr. 67, 282–292 10.1107/S090744491003982X (doi:10.1107/S090744491003982X) [DOI] [PMC free article] [PubMed] [Google Scholar]
- 32.French G, Wilson K. 1978. On the treatment of negative intensity observations. Acta Crystallogr. A 34, 517–525 10.1107/S0567739478001114 (doi:10.1107/S0567739478001114) [DOI] [Google Scholar]
- 33.Winn MD, et al. 2011. Overview of the CCP4 suite and current developments. Acta Crystallogr. D, Biol. Crystallogr. 67, 235–242 10.1107/S0907444910045749 (doi:10.1107/S0907444910045749) [DOI] [PMC free article] [PubMed] [Google Scholar]
- 34.McCoy AJ, Grosse-Kunstleve RW, Adams PD, Winn MD, Storoni LC, Read RJ. 2007. Phaser crystallographic software. J. Appl. Crystallogr. 40, 658–674 10.1107/S0021889807021206 (doi:10.1107/S0021889807021206) [DOI] [PMC free article] [PubMed] [Google Scholar]
- 35.Murshudov GN, Skubak P, Lebedev AA, Pannu NS, Steiner RA, Nicholls RA, Winn MD, Long F, Vagin AA. 2011. REFMAC5 for the refinement of macromolecular crystal structures. Acta Crystallogr. D, Biol. Crystallogr. 67, 355–367 10.1107/S0907444911001314 (doi:10.1107/S0907444911001314) [DOI] [PMC free article] [PubMed] [Google Scholar]
- 36.Emsley P, Lohkamp B, Scott WG, Cowtan K. 2010. Features and development of Coot. Acta Crystallogr. D, Biol. Crystallogr. 66, 486–501 10.1107/S0907444910007493 (doi:10.1107/S0907444910007493) [DOI] [PMC free article] [PubMed] [Google Scholar]
- 37.Davis IW, et al. 2007. MolProbity: all-atom contacts and structure validation for proteins and nucleic acids. Nucleic Acids Res. 35, W375–W383 10.1093/nar/gkm216 (doi:10.1093/nar/gkm216) [DOI] [PMC free article] [PubMed] [Google Scholar]
- 38.Schrodinger LLC. 2010. The PyMOL molecular graphics system, version 1.5. Http://www.pymol.org. [Google Scholar]
Associated Data
This section collects any data citations, data availability statements, or supplementary materials included in this article.