Abstract
A major problem in the treatment of schizophrenic patients with current antipsychotic drugs, mainly acting as dopamine-2 receptor antagonists, is the occurrence of side effects such as extrapyramidal symptoms (EPS). Meta-analyses of summary data of EPS occurrence, and receptor occupancies inferred from mean plasma concentrations, have shown the incidence of EPS to rise when receptor occupancy is above ~80%. In this analysis, individual longitudinal EPS data from 2,630 patients participating in one of seven different trials and treated with haloperidol, paliperidone, ziprasidone, olanzapine, JNJ-37822681, or placebo were analyzed using a continuous time probability model with Markov elements. The developed pharmacokinetic–pharmacodynamic model describes the longitudinal changes of spontaneously reported EPS-related adverse events and their severity levels rated by clinicians. Individual steady-state concentrations and occupancy levels were found to be predictors for EPS. The results confirm 80% occupancy as a level of increased EPS occurrence rates, also at the individual level.
Schizophrenia is a chronic psychiatric condition that includes positive (e.g., delusions), negative (e.g., lack of motivation), and cognitive symptoms (e.g., loss of memory). These symptoms can severely affect the social, educational, occupational, and health-related functioning of the individual.1 Antagonism at the dopamine D2-receptor is a common mechanism of action for currently available treatment of schizophrenia.2 However, central D2-receptor occupancies (D2RO) >80% increase the risk of adverse effects (AEs) such as extrapyramidal symptoms (EPS).3
Extrapyramidal side effects of antipsychotic drugs (APs) include acute movement disorders, such as akathisia, and chronic movement disorders, such as tardive dyskinesia. In addition to being uncomfortable to patients, these side effects could behave as confounding factors and may lead to an underestimation of efficacy of the APs.4 In drug development, EPS symptoms are often assessed using rating scales, e.g., Simpson–Angus Scale, or by spontaneous reporting by patients, with severity graded by clinicians at the time of planned visits.
Atypical antipsychotics (ATAPs) were introduced to the clinic in an attempt to lower the EPS incidence as compared with the typical antipsychotics (e.g., haloperidol) and to improve the negative and cognitive symptoms of schizophrenia. One of the claims during marketing ATAPs is “the absence of EPS side effects”.5,6 Recently, a meta-analysis of ATAPs vs. haloperidol using a central tendency statistical approach to evaluate such a claim was performed. It demonstrated that at least some ATAPs do produce EPS and that there are differences between drugs in their tendency to produce EPS.6 Previously described assessments of EPS either looked at mean differences in Simpson–Angus Scale or EPS incidence on a study level7 or at indirect measurements such as the prescription of anti-EPS treatment. No study has been published linking individual data of EPS to predictors such as plasma concentrations or receptor occupancy using pharmacokinetic–pharmacodynamic models that described the longitudinal aspect of EPS events following antipsychotic treatment. However, de Ridder and Vermeulen8 modeled the time to the first treatment-emergent EPS-related event using hazard models, without considering the severity of the EPS events.
The discrete nature of events or discrete scales as the ones used for EPS assessments may call for models that are appropriate for the data. In the field of pharmacokinetic–pharmacodynamic models, one usable approach is the proportional odds model. However, this model does not assume dependency between observations and the profiles, and frequencies of transitions between states generated from simulations can be inconsistent with data. Markov elements would be needed to handle that property of the data. Another approach would be to assess the time-to-EPS of a certain severity using survival models, but these would not take into account serial correlation or that the probability of states are correlated. A “compartmental” continuous time Markov type of model is capable of estimating parameters considering time factor and hence eliminating the need of having frequent observations at equal spaces of time needed in ordinary Markov models or discrete-type models.9 A Markov-type model allows predicting the probability of observing a patient at any of the EPS severity grades, depending on what severity grade he or she had at the last observation and the time elapsed since the last observation. Thus, Markov modeling approach can help to quantify and compare the potency of different APs to induce EPS AEs over time.
In this analysis, the aim was to develop a continuous time, population-based Markov model to describe the probability of EPS incidence and EPS severity as a function of dose, individual steady-state drug exposure (Css), or predicted dopamine D2RO of APs. All available EPS data after the administration of placebo, four ATAPs (paliperidone-extended release, ziprasidone, JNJ-37822681,10 and olanzapine), and haloperidol from seven clinical studies were included.
Results
EPS data
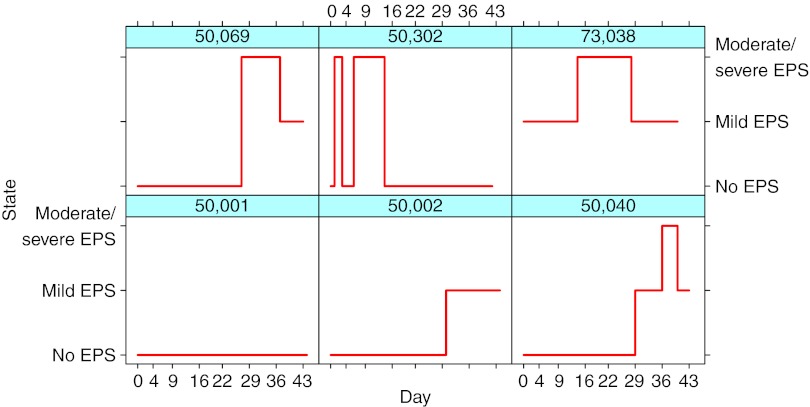
The EPS data set consisted of 16,598 observations (rated as no EPS, mild, moderate, or severe) collected from 2,630 subjects with acute schizophrenic condition. Of these, 594 subjects received placebo, 867 received paliperidone (3–15 mg/day), 437 received olanzapine (10 or 15 mg/day), 143 received haloperidol (2.5–40 mg/day), 285 received ziprasidone (40–200 mg/day), and 301 received JNJ-37822681 treatment (10–30 mg/day). Table 1 summarizes the trial designs and the observed EPS incidence rates of APs that were used in this study. Figure 1 shows six individuals and their changes between the no–mild–moderate/severe states. The calculated individual-level Css and the predicted D2RO range (min–max) were as follows: for haloperidol, 1–4 ng/ml (55–98%); olanzapine, 9–76 ng/ml (44–86%); paliperidone, 0.5–115 ng/ml (9–95%); ziprasidone, 24–282 ng/ml (38–89%); and JNJ-37822681, 8–178 ng/ml (35–92%).
Table 1. Overview of clinical trials in subjects with schizophrenia included in the development of the EPS model.
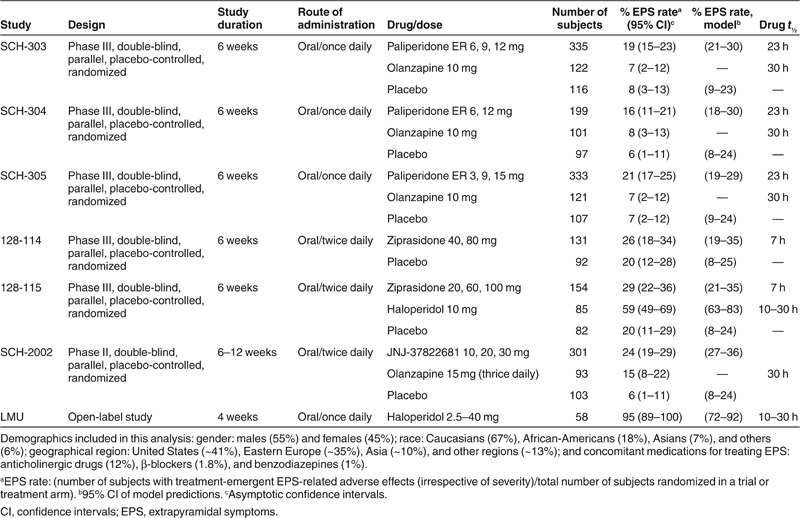
Figure 1.
Six representative individuals and their transitions between extrapyramidal symptom (EPS) states. Values on the x-axis are nominal visit days. The majority of the patients had no EPS, i.e., had a similar shape as patient 50,001.
Structural model for EPS incidence
To be able to calculate the probabilities of observing each EPS severity grade at any time point, the probabilities were determined by a Markov model with a compartmental structure using differential equations (Figure 2). The placebo model was first developed based on the placebo data alone. Thereafter, the combined placebo and drug effects model was built by estimating placebo and drug effect parameters. Following the start of the study, the decrease of the rate constants as a function of time over the study period was best described by the exponential model (Eqs. 1 and 2). A linear model described the relationship between the drug exposure (Eq. 3) and the effect of APs on the transition rate constants reasonably well. Modeling the drug effect, using dose or average Css, as proportional to the placebo effect resulted in a better model fit and lower relative standard errors of the parameter estimates, as compared with additive drug effects. Emax model was the best to link D2RO and EPS events (Eq. 4):
Figure 2.

Extrapyramidal symptoms (EPS) continuous-type Markov model structure with compartments representing probabilities (no EPS, mild EPS, and pooled moderate/severe defined as compartments 1, 2, and 3, respectively). The forward rate transitions constant KF12 and KF23 were allowed to be influenced by drug exposure or D2-receptor occupancies.
 |
Differential equations used to model the probability of observing EPS event
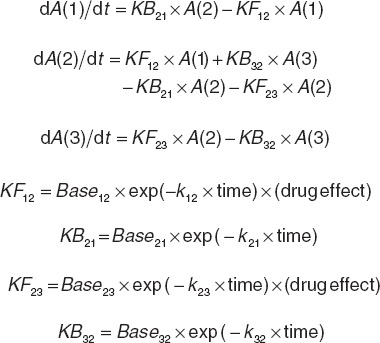 |
KFxy and KBxy are the forward and backward transition probability rate constants at any given time; Basexy, the transition probability rate constant at the start of the study; x, the present EPS state; y, future EPS state; t(1/2) = ln 2/kxy; t1/2, half-life describing the change in KFxy or KBxy with time; drug effect, the effect of antipsychotic drug on KFxy; EFF, the drug-dependent slope parameter in relation to drug exposure; Emax, the maximum drug effect on the transition rate from state x to state y; RO50, the model parameter that corresponds to compound-independent D2RO required for 50% of Emax effect on the linear scale, which is then exponentiated; and A(1), A(2), A(3) represent the compartments for EPS probabilities.
Inclusion of interindividual variability as an exponential function to describe differences between patients' sensitivity to treatment effects resulted in an improved model fit by objective function; however, the model was numerically unstable, and parameters were estimated with less precision and simulation properties worsened, possibly due to non-normal distributions of empirical Bayes estimates that frequently arise for categorical-type models. Therefore, the model was built without interindividual variability in the typical parameters. Visit 4, scheduled to be between day 14 and day 21 (except LMU study), corresponds to the point in the study at which subjects were allowed to enter into an outpatient status. The improvement in the model fit and in visual predictive checks showed that it was important to allow some parameters to have different values before and after visit 4 (~day 16).
The effect of predictors was only significant to estimate forward transition rate constants (i.e., KF12 and KF23). On the basis of NONMEM objective function value, Css was better than dose (decrease of ~45 objective function value units) in describing the drug–EPS relationships. The final EPS model structure (based on all drugs simultaneously) was able to describe the observed EPS occurrence adequately with acceptable low relative standard errors.
To characterize the relationship between D2RO by different APs and the emergence of EPS, predicted D2RO levels associated with Css were linked to the transition rate constants by either using a linear function (Eq. 3) or sigmoidal function (Eq. 4). The advantage of this transformation is that it allows Q to have a value from zero to infinity for D2RO from 0 to 100% and the drug effect to reach its maximum effect (Emax) for D2RO approaching 100% (Eq. 4). This parameterization resulted in statistically better and numerically more stable estimation than using D2RO directly.
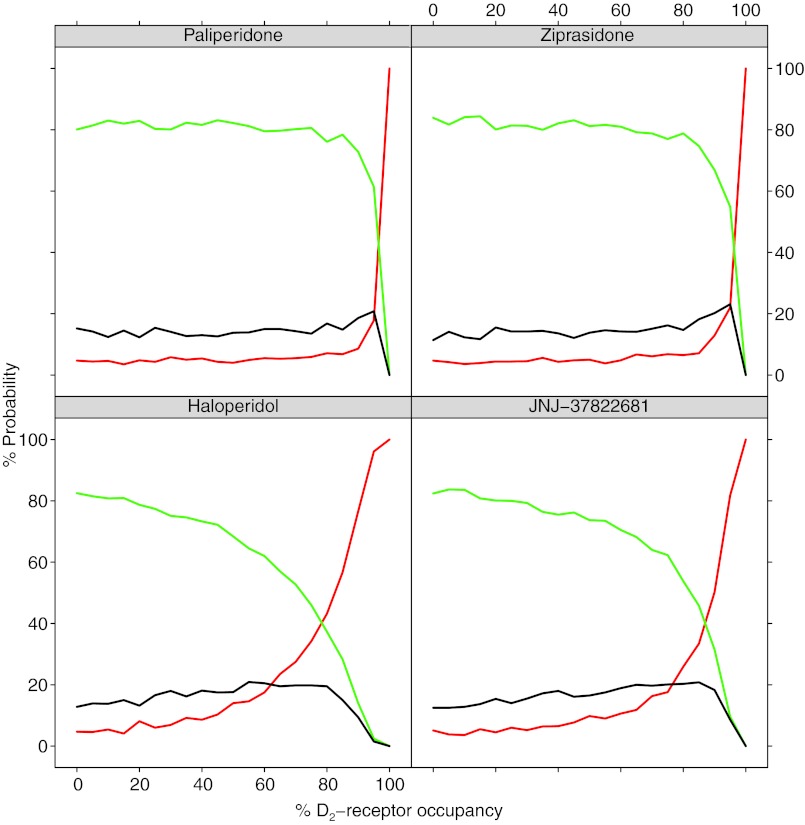
The parameter estimates of the EPS model when using Css and D2RO as predictors are shown in Table 2. The dopamine D2RO needed for half of the maximum effect of APs on the transition rate was found to be 86.5% on the linear scale and 89.5 counting the exponential parameterization (Eq. 4). The probabilities for the different states vs. predicted individual D2RO (based on Css and Kd) for different APs are depicted in Figure 3. Probabilities of experiencing EPS rapidly increase at above 80% occupancy. Haloperidol and JNJ-37822681 exhibited higher EPS probabilities at somewhat lower D2RO levels. Although different slopes were found for each compound, no statistically different differences between compounds were found for the effect parameters of the D2RO model.
Table 2. Parameter estimates (95% confidence intervals from bootstrap analysis) of the final EPS models using Css and D2-receptor occupancy as predictors of EPS.

Figure 3.
Probabilities of extrapyramidal symptom (EPS) events for the Css model vs. predictions of drug occupancy based on Css. Green is the probability of never experiencing EPS. Black is the probability of experiencing mild but never moderate/severe EPS. Red is the probability of ever experiencing moderate/severe EPS. All probabilities are based on 6-week trials.
For the placebo model, the maximum probability of experiencing mild EPS (7%) was estimated to be around day 25, whereas the maximum probability of experiencing moderate/severe EPS (1.6%) was estimated to occur at day 8. After these peaks, the probability slowly declines for both states.
Olanzapine was found to be less associated with EPS events than placebo treatment, causing difficulties in estimating the effect of olanzapine on EPS transitions and also causing model and estimation instability when analyzed simultaneously with the data from the other drugs. The EPS incidence was higher (15%) for the olanzapine arm as compared with the placebo treatment in one of the studies (SCH-2002), but individual plasma olanzapine profiles were not available from this study, which may have contributed to difficulties in estimating the effect of olanzapine exposure effect on the probability of EPS. The olanzapine data were therefore omitted from the analysis. Including the data and fixing the effect to zero yielded no significant changes to model parameters.
Covariate model
Covariates were included in the model based on their statistical and clinical significance. The final EPS model included only one covariate in addition to in/outpatient status (regional difference: Eastern Europe vs. others), which was added as a proportional linear term to the corresponding transition probability. Residing in Eastern Europe increased the chances of improvement of the EPS side effects as it increased backward movement probability rate constants (KB21 and KB32) by ~100% (Table 2). Not all covariate information was available for all trials to test the influence of covariates on the probability of EPS. Only paliperidone trials had co-medication and complete demographic details. On the basis of paliperidone data only, administration of anticholinergic drug for the treatment of EPS was found to be an influential covariate, decreasing the transition probability rate constant for movement from a mild EPS state to moderate/severe EPS states by ~80%.
Model evaluation
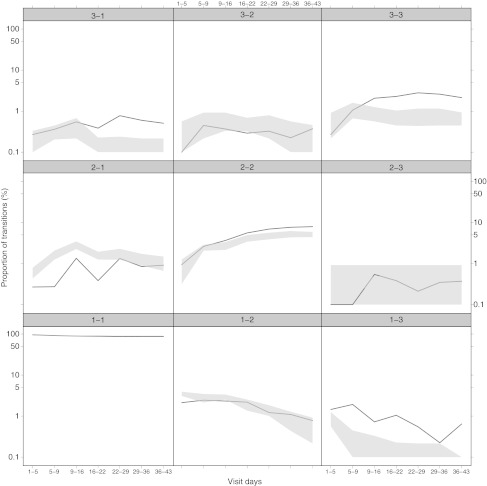
The final models (Table 2) were evaluated using a bootstrap analysis with 1,000 samples. Confidence intervals of 95% were constructed for each of the parameters and none of these overlapped zeros. The population estimates of the final model are in close agreement with the median values of the 952 successful bootstrap replicates. Visual predictive checks using 100 simulated data sets were made to evaluate the predictive ability of the model. The model was capable of satisfactorily predicting the proportions of the patients experiencing each of the EPS states across time (Figure 4). Predicted overall EPS incidence coincides with observed incidence (Table 2). The number of transitions simulated from the model was found to be reasonably consistent with the observed number of transitions as shown for the paliperidone data (Figure 5).
Figure 4.
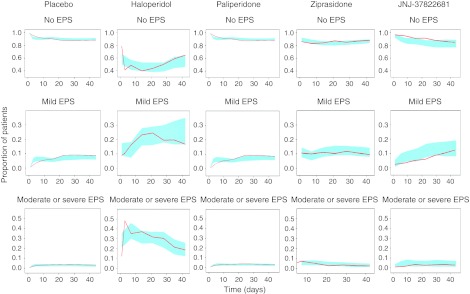
Visual predictive checks showing the proportions of the patients at each extrapyramidal symptoms (EPS) state on planned visits in the observed data (red lines) with the corresponding 95% prediction intervals as constructed from 100 simulations (light blue region) for different antipsychotics, using Css as a predictor.
Figure 5.
Visual predictive check of Markov model transitions for paliperidone treatment. The gray area represents the 10th and 90th interpercentile range of the simulated number of transitions. Solid line indicates the median observed transitions.
Discussion
This work describes a pharmacokinetic–pharmacodynamic modeling approach that successfully characterized the temporal course of the proportions of patients experiencing different grades of EPS following exposure to one of four different APs or placebo. The dependency of a future EPS event on the current state was accounted for by using a compartmental structure, defined by differential equations, for the probabilities of observing each severity grade at any time point (Figure 2).9,11 The probabilities were thereby continuous with respect to time and coupled to the observed scores through a probabilistic model. Markov elements can also be incorporated in a proportional odds model,12 however, that type of model is discrete in time and the sampling times and frequencies can greatly influence the parameter estimates.13 The analyzed studies included self-reported EPS events, and consequently the EPS observations were not equally spaced in time. Therefore, the continuous time Markov modeling approach was chosen and was shown to effectively handle the dependency between successive observations of ordered adverse events.
The simultaneous fit of the model to all data resulted in one set of parameter estimates that to an adequate degree could simulate the proportions of patients experiencing EPS after treatment with one of four different compounds studied in seven different trials (Figure 4). The simulations of the transitions between different states show that the model cannot re-create exactly every transition seen in the data, but in relation to the huge differences between the occurrence of the different transition types, from 0.1% to above 90%, we conclude that the overall pattern of transitions can be described by the model (Figure 5). A linear model with respect to steady-state concentrations was better than using the predicted D2-receptor occupancy as a direct link to EPS. The findings shown in Figure 3 concur with what de Greef et al.4 found on the metadata level, where the incidence rate increases at occupancy >80%. The fact that separation between the effect parameters of the substances for the D2RO model was not possible, and the substantially higher objective function value for the D2RO model, suggests the information content in the predicted D2RO was relatively low. This indicates that the extrapolation of D2RO from position emission tomography studies may not be perfect or that receptor systems other than D2 are being involved, which is also what is believed to be the case for ATAPs.
The change in parameter estimates between inpatient and outpatient periods implies that moderate/severe AEs are more likely during hospitalization and that AE events were shorter while being inpatients, e.g., because of better access to caregivers and rescue medication. A 100% increase in forward rate constants corresponds to a 50% decrease of the half-time to having a certain probability of an event, as compared with placebo. The model dependent on the D2-receptor occupancy is not drug dependent and can be used to predict EPS for a new D2-receptor antagonist using the drug Kd and information on the typical pharmacokinetic profile. The model can also simulate the longitudinal correlations seen in EPS AE data.
The model predicts an asymptotic decline of the rate constants towards zero at infinite time. Extrapolation of the model into time frames substantially longer than the trial length of 6 weeks is therefore not endorsed.
It has been suggested that ATAPs induce EPS4 at a lower rate than typical antipsychotics. The EPS occurrence rate was ~16 times higher for haloperidol than for ATAPs. Haloperidol exhibited higher EPS occurrence rate even at the lower doses of ≤10 mg/day.
The open-label study of haloperidol with higher doses and higher EPS incidence could potentially influence the estimates for haloperidol. A visual predictive check per study did, however, show that the present model could predict EPS after haloperidol both in the open-label study and when used as comparator (data not shown).
Study region was found to be an important covariate wherein patients who had studied in Eastern Europe had a lower incidence and shorter average event lengths of EPS than those from other countries. The reason for this is not clear, but regional differences in study results are not uncommon; different attitudes toward reporting adverse events could be a possibility.
The present EPS model did not consider dropout. However, EPS was not the major reason for discontinuation of treatment, and discontinuation, primarily, was due to lack of efficacy and subject's choice.
Overall, this data analysis indicated that olanzapine was well tolerated in patients with schizophrenia as it was not possible to estimate a slope parameter for the effect (EFF in Eq. 3) due to model instability when including the olanzapine data. It may be that olanzapine has a favorable EPS profile14 due to binding to receptors such as 5-HT2A, but that olanzapine would truly have lower incidence rates than placebo seems unlikely. Fixing the olanzapine effect to zero and estimate using all data did not change the other parameters significantly, but as modeling the olanzapine data alone yielded a negative effect, and due to the model instability, the data were still left out of final estimation.
In conclusion, a model that can characterize the temporal course of the proportions of patients experiencing different grades of EPS using a compartmental model structure incorporating Markov elements was successfully developed. To our knowledge, this approach has not been used for characterizing side effect data in general, and no population models have been developed for EPS side effects. The approach could be used for any adverse event with severity grading and a reported duration. The model quantifies the relationship between the occurrence of EPS and movement to higher EPS states and the different predictors of exposure (dose, Css), as well as receptor occupancy of the different APs.
Methods
Studies, patients, and EPS scores. The EPS modeling used individual-level data obtained from six randomized, placebo-controlled, clinical trials and one open-label study conducted in schizophrenic patients. The study durations ranged from 4 to 12 weeks, following oral administration of one of five APs (haloperidol, olanzapine, paliperidone-extended release, ziprasidone, and JNJ-37822681). The studies were included on the basis of availability of EPS AE data and being of roughly the same length with weekly follow-ups.
EPS-related AEs included side effects that were reported spontaneously by patients over the study period. The important AEs documented were akathisia, hyperkinesia, dystonia, Parkinsonism, dyskinesia, tardive dyskinesia, hypokinesia, and tremor. As the total number of events was too low for some AEs to draw conclusions about the exposure–response relationship, not all types of EPS-related AEs were observed in all trials and there were unspecified EPS AEs as well; the model was developed without discriminating between the different types of AEs.
According to the design of the studies, patients met clinicians in the clinic at least once a week during the total study duration. Patients were directed to record the incidence of EPS, the duration of the EPS episode, and resolution of any EPS, the severity of which was graded by clinicians on a scale from 0 to 3 (0: no EPS, 1: mild EPS, 2: moderate EPS, and 3: severe EPS). Thus, transitions were possible on any day and not only on visit days. If the patient dropped out before the end of the study, all available EPS scores until the day of dropout were included in the analysis. If several manifestations of EPS were experienced simultaneously, but differing in grade, the grade was set to the highest. In all trials, patients were hospitalized for the first 2–3 weeks of the study period.
Data were analyzed by nonlinear mixed-effects modeling using the LAPLACE method in NONMEM 7, level 1.2,15 with front-end interface PsN 3.4.2.16 R version 2.11 and higher versions were used for data management purposes and generating graphic outputs.17
Pharmacokinetics. A patient-specific average steady-state concentration (Css) was calculated using post hoc Bayesian estimates of clearance (Css = Dose/(CL/F × T) where T is the dosing interval) obtained from previously developed pharmacokinetic models.18,19 The typical apparent clearance (CL/F) estimates were 88 l/h for haloperidol, 14 l/h for paliperidone, 20 l/h for olanzapine, 54 l/h for ziprasidone, and 25 l/h for JNJ-37822681. The calculated individual Css was then linked to the time course of EPS incidence. Css was set at 0 for subjects receiving placebo and was considered constant over time.
EPS and likelihood model structure. EPS events were categorized on an ordered categorical scale based on the intensity of EPS-related AEs. Because there were few observations on severe EPS, the moderate and severe EPS states were combined and a three-state scale was used. A Markov transition model with three compartments (Figure 2) was used where each compartment represented the probabilities of a different state (no EPS, mild EPS, and moderate/severe EPS). The probability at t = 0 was set to 1 for the observed EPS state. The amount corresponding to probability was allowed to distribute between the compartments, and the first-order rate constants between the compartments were estimated. After an observation, all compartments were reset to zero and the compartment corresponding to the observed EPS state of the patient was initialized with a 100% probability, t was not reset at each event. The model for the probabilities given the data is shown in Eq. 5 where the probability of Yij, the observed state at the jth observation of individual i, is given by the amount in the compartment corresponding to state k at observation j for individual i. The likelihood was evaluated at scheduled time points (typically once per week) and at state changes on nonscheduled days
Effects of time, drug exposure, receptor occupancy, and covariates on transition probabilities were evaluated in the Markov model as a proportional relation on the transition rate parameters. Drug and covariate effects were tested on each transition parameter separately and in combination. The model control stream can be found as Supplementary Table S1 online together with an example data set.
Placebo effect and drug effect. Various functions such as constant, linear, exponential, and Weibull functions were explored for describing a change over time in the transition probability rate constants. The antipsychotic drug exposure was related to the EPS incidence with increasing complexity using linear, Emax, and sigmoid Emax models and tested on top of parameters estimated for the placebo group. To characterize the relationship between EPS incidence and dopamine D2RO levels, the following relationship was used to calculate D2RO for each patient:
where ROmax is the maximum receptor occupancy and Kd is the plasma level of antipsychotic drug associated with 50% of ROmax. The values of Kd for D2-receptor binding were obtained from the literature, where Emax models were used to fit D2RO and plasma drug concentration data obtained from position emission tomography studies. The Kd values for D2-receptor binding (assuming ROmax 100%) were 0.56 ng/ml for haloperidol, 12 ng/ml for olanzapine, 4.9 ng/ml for paliperidone, 33 ng/ml for ziprasidone,20 and 15 ng/ml for JNJ-37822681.21
Covariate model. Influences of patient- and study-specific covariates were evaluated as possible explanatory variables for the individual variability in the model parameters (Table 1). The potential effect of concomitant medications for treating EPS was tested using the data from paliperidone trial where exact time of start and stop of these medications were known.
Covariates were included in the model using different functional forms: linear, piecewise linear, power, and exponential functions.19 Only nonmissing, clinically relevant, and uncorrelated covariates that met the predefined statistical criteria (P < 0.05) were included in the EPS model.
Final model selection and model evaluation. During initial model building, differences in the objective function value (cut off: 3.84) between the models together with % relative standard error (from NONMEM covariance step) of the parameters were used to guide the selection of the model. A bootstrap analysis (1,000 samples) was carried out, for both the drug exposure-EPS and the receptor occupancy-EPS models, to check the precision of the estimates and to construct a 95% confidence interval for each of the parameter estimates. The adequacy of the model was investigated with simulation-based visual predictive checks. Briefly, prediction intervals of the proportions of patients at each EPS state at each planned observation and transitions between the different EPS states were constructed using 100 (due to heavy calculations) simulated replicates of the initial data set and compared with the corresponding observed proportions or transitions.
Author Contributions
V.P.R., K.J.P, A.A.S., A.V., J.H.P., and L.E.F. wrote the manuscript, designed the research, performed the research, and analyzed the data.
Conflict of Interest
As an Associate Editor for CPT:PSP, L.E.F. was not involved in the review or decision process for this paper.
Study Highlights
Acknowledgments
K.J.P. was supported by a grant from Janssen Research & Development (Beerse, Belgium). V.P.R. was supported financially by the Dutch Top Institute Pharma (Leiden, The Netherlands; www.tipharma.com) within the framework of project no. D2-104 (Mechanism-based pharmacokinetic–pharmacodynamic modeling platform). We thank Jing Liu (Pfizer Global Research and Development, Groton, USA) for her contribution to this article via Top Institute Pharma. We also thank Dan Rujescu (Department of Psychiatry, Ludwig Maximilians University, Munich, Germany) for sharing the haloperidol data. We thank Geny M.M. Groothuis, Meindert Danhof, and Magdalena Kozielska for their scientific input.
Supplementary Material
References
- Mueser K.T., &, McGurk S.R. Schizophrenia. Lancet. 2004;363:2063–2072. doi: 10.1016/S0140-6736(04)16458-1. [DOI] [PubMed] [Google Scholar]
- Seeman P. All roads to schizophrenia lead to dopamine supersensitivity and elevated dopamine D2(high) receptors. CNS Neurosci. Ther. 2011;17:118–132. doi: 10.1111/j.1755-5949.2010.00162.x. [DOI] [PMC free article] [PubMed] [Google Scholar]
- Horacek J.et al. Mechanism of action of atypical antipsychotic drugs and the neurobiology of schizophrenia CNS Drugs 20389–409.2006 [DOI] [PubMed] [Google Scholar]
- de Greef R., Maloney A., Olsson-Gisleskog P., Schoemaker J., &, Panagides J. Dopamine D2 occupancy as a biomarker for antipsychotics: quantifying the relationship with efficacy and extrapyramidal symptoms. AAPS J. 2011;13:121–130. doi: 10.1208/s12248-010-9247-4. [DOI] [PMC free article] [PubMed] [Google Scholar]
- Sernyak M., &, Rosenheck R. Experience of VA psychiatrists with pharmaceutical detailing of antipsychotic medications. Psychiatr. Serv. 2007;58:1292–1296. doi: 10.1176/ps.2007.58.10.1292. [DOI] [PubMed] [Google Scholar]
- Rummel-Kluge C.et al. Second-generation antipsychotic drugs and extrapyramidal side effects: a systematic review and meta-analysis of head-to-head comparisons Schizophr. Bull 38167–177.2012 [DOI] [PMC free article] [PubMed] [Google Scholar]
- Matsui-Sakata A., Ohtani H., &, Sawada Y. Pharmacokinetic-pharmacodynamic analysis of antipsychotics-induced extrapyramidal symptoms based on receptor occupancy theory incorporating endogenous dopamine release. Drug Metab. Pharmacokinet. 2005;20:187–199. doi: 10.2133/dmpk.20.187. [DOI] [PubMed] [Google Scholar]
- de Ridder, F., Vermeulen, A.Balancing efficacy and safety in the clinical development of an atypical antipsychotic, paliperidone extended-release Clinical Trial Simulations: Applications and TrendsKimko, Holly H. C., Peck Carl, C., eds). (Springer Science and Business Media, NY, 2011 [Google Scholar]
- Bergstrand M., Söderlind E., Weitschies W., &, Karlsson M.O. Mechanistic modeling of a magnetic marker monitoring study linking gastrointestinal tablet transit, in vivo drug release, and pharmacokinetics. Clin. Pharmacol. Ther. 2009;86:77–83. doi: 10.1038/clpt.2009.43. [DOI] [PubMed] [Google Scholar]
- Te Beek, E.T., Moerland, M., de Boer, P.et al. Pharmacokinetics and central nervous system effects of the novel dopamine D2 receptor antagonist JNJ-37822681 J Psychopharmacol 261119–1127.2012 [DOI] [PubMed] [Google Scholar]
- Lacroix, B.D., Sargentini-Maier, M.L., Karlsson, M.O., Friberg, L.E.Simultaneous modeling of the three ACR improvement thresholds – 20, 50 and 70% – in rheumatoid arthritis patients treated with certolizumab pegol PAGE Abstr.18112010 [Google Scholar]
- Bizzotto R., Zamuner S., De Nicolao G., Karlsson M.O., &, Gomeni R. Multinomial logistic estimation of Markov-chain models for modeling sleep architecture in primary insomnia patients. J. Pharmacokinet. Pharmacodyn. 2010;37:137–155. doi: 10.1007/s10928-009-9148-2. [DOI] [PubMed] [Google Scholar]
- Snelder, N., Diack, C., Benson, N., Ploeger, B., Van der Graaf, P.H.A proposal for implementation of the Markov property into a continuous time transition state model in NONMEM PAGE Abstr.15362009 [Google Scholar]
- Carlson C.D., Cavazzoni P.A., Berg P.H., Wei H., Beasley C.M., &, Kane J.M. An integrated analysis of acute treatment-emergent extrapyramidal syndrome in patients with schizophrenia during olanzapine clinical trials: comparisons with placebo, haloperidol, risperidone, or clozapine. J. Clin. Psychiatry. 2003;64:898–906. doi: 10.4088/jcp.v64n0807. [DOI] [PubMed] [Google Scholar]
- NONMEM user's guide (1989-2009) [computer program]. Ellicott City, MD, USA: ICON Development Solutions; 2009 [Google Scholar]
- Lindbom L., Ribbing J., &, Jonsson E.N. Perl-speaks-NONMEM (PsN)–a Perl module for NONMEM related programming. Comput. Methods Programs Biomed. 2004;75:85–94. doi: 10.1016/j.cmpb.2003.11.003. [DOI] [PubMed] [Google Scholar]
- R: A language and environment for statistical computing. [computer program]. Vienna, Austria: R Foundation for Statistical Computing; 2010 [Google Scholar]
- Samtani M.N., Vermeulen A., &, Stuyckens K. Population pharmacokinetics of intramuscular paliperidone palmitate in patients with schizophrenia: a novel once-monthly, long-acting formulation of an atypical antipsychotic. Clin. Pharmacokinet. 2009;48:585–600. doi: 10.2165/11316870-000000000-00000. [DOI] [PubMed] [Google Scholar]
- Hoeben, E., Neyens, M., Mannaert, E., De Boer, P., Schmidt, M., Vermeulen A.Population pharmacokinetic analysis of JNJ-37822681, a specific and fast-dissociating D2 antagonist for the treatment of schizophrenia Abstr.2069PAGE 2011 [Google Scholar]
- Nucci G., Gomeni R., Poggesi I. Model-based approaches to increase efficiency of drug development in schizophrenia: a can't miss opportunity. Expert Opin. Drug Discov. 2009;4:837–856. doi: 10.1517/17460440903036073. [DOI] [PubMed] [Google Scholar]
- Te Beek E.T., de Boer P., Moerland M.et al. In vivo quantification of striatal dopamine D2 receptor occupancy by JNJ-37822681 using [11C]raclopride and positron emission tomography J Psychopharmacol 261128–1135.2012 [DOI] [PubMed] [Google Scholar]
Associated Data
This section collects any data citations, data availability statements, or supplementary materials included in this article.


