Abstract
Canakinumab, an anti-interleukin-1β (IL-1β) monoclonal antibody, is approved for cryopyrin-associated periodic syndromes and is under investigation for the management of other inflammatory disorders. In this study, population-based pharmacokinetic–pharmacodynamic models were developed to understand responses to canakinumab in patients with rheumatoid arthritis (RA). Total canakinumab and total IL-1β concentrations were obtained from four clinical trials (n = 472). In contrast to traditional models, free IL-1β concentrations were calculated and used to link canakinumab to changes in C-reactive protein (CRP) concentrations and American College of Rheumatology (ACR) scores of 20, 50, and 70% improvement. Temporal patterns of total canakinumab, total IL-1β, CRP, and ACR scores were all well described. Simulations confirmed that 150 mg every 4 weeks improved ACR scores in patients with RA, but no additional benefit was provided by higher doses or more frequent administration. Integrating predicted endogenous free ligand concentrations with biomarkers and clinical outcomes could be extended to new therapies of anti-inflammatory diseases.
Rheumatoid arthritis (RA) is a chronic, systemic inflammatory disease affecting ~1% of the world population.1,2 Like many other autoimmune diseases, it disproportionately affects women.3 Inflammation is the hallmark feature of RA which usually starts within the small joints, but may also affect other organs such as cartilage and bone.4 In inflammatory joints, the synovial membrane is hyperplasic, highly vascularized, and infiltrated with activated immune cells. As the disease progresses, patients experience pain, stiffness, and swelling of the joints leading to an impaired physical function and ultimately a reduced life expectancy.5
Interleukin-1β (IL-1β) is a well-known proinflammatory cytokine released by various cells such as macrophages, keratinocytes, fibroblasts, mastocytes, endothelial, and neuronal cells. Initially, a full length precursor peptide (pro-IL-1β) is synthesized then cleaved within the inflammasome complex by the caspase-1 protein to form active IL-1β, which is released into the extracellular space.6,7 IL-1β exerts its effects upon binding to its receptor (IL-1βR). A dysregulation of IL-1β activity is characteristic of RA and occurs from either an excess of IL-1β production, resulting in increased systemic concentrations of the cytokine, or from a qualitative or quantitative deficiency of IL-1βR.8
Current anti-RA therapies are symptomatic and aim at reducing the uncontrolled auto-inflammatory response. Four groups of anti-RA medications are approved by the US Food and Drug Administration which are corticosteroids, disease modifying antirheumatic drugs, nonsteroidal anti-inflammatory drugs, and biologic response modifiers.9 In the latter group, therapies are either monoclonal antibodies that inhibit the activities of some proinflammatory cytokines such as IL-6,10 tumor necrosis factor-α,9 and IL-1β11 or recombinant human proteins that are IL-1βRI antagonists.12 Although the effectiveness of biologics in RA treatment has been largely shown, disease progression and drug resistance are commonplace.
Canakinumab (Ilaris)13 is a humanized monoclonal antibody targeted against IL-1β.11 Canakinumab was recently approved by the US Food and Drug Administration14 for the treatment of the Muckle–Wells syndrome and the familial cold auto-inflammatory syndrome.15 The European Medicines Agency approved canakinumab for all cryopyrin-associated periodic syndromes.16 In addition to neutralizing IL-1β, canakinumab exhibits intracellular effects with data suggesting that the drug can exert a negative feedback on IL-1β production and normalizes IL-1β concentrations to those of healthy subjects.17 Pharmacologically, canakinumab binds to and captures IL-1β and thereby neutralizes its activity, preventing interactions with its receptor (IL-1βR). A single subcutaneous injection of 150 mg of canakinumab in patients with RA showed that peak serum concentrations occur around 7 days; drug disposition appears to be linear and stationary, with half-life ranging from 22 to 33 days and a mean clearance of the total drug of ~0.17 l/day in patients with an average weight of 70 kg.18
The objectives of this analysis were to (i) develop a pharmacokinetic (PK) model for total canakinumab and IL-1β disposition in patients with active RA, (ii) develop pharmacodynamic (PD) models that link predicted free IL-1β exposure with the temporal profiles of a continuous biomarker and a categorical clinical outcome, namely C-reactive protein (CRP) and the American College of Rheumatology (ACRx) scores (x = 20, 50, or 70% improvement) and (iii) use final models to predict the signal from IL-1β across escalating doses of canakinumab and evaluate the impact on clinical outcome in patients with RA. ACRx scores are binary PD endpoints that reflect percent improvement levels in RA from baseline conditions.19 These criteria were recommended in 1995 by the ACR to standardize outcome measures in RA trials and are now key criteria for regulatory decisions by the US Food and Drug Administration for antirheumatoid therapies.20 In contrast to traditional PK/PD models in which drug concentrations are directly linked to response variables, we used model predicted plasma concentrations of free IL-1β to regulate temporal changes in plasma concentrations of CRP and the probabilities of achieving ACR20, ACR50, and ACR70 in patients with RA.
Results
Data were obtained from four clinical trials including 472 patients with RA, 80% of whom were women, with a median age of 57 years (range 18–87 years) and a median weight of 74 kg (range 40–111 kg). A total of 349 patients received canakinumab (doses ranged 0.1 mg/kg to 900 mg) as a subcutaneous injection or 2-h intravenous infusion every 2 or 4 weeks, providing 6,918 total canakinumab and total IL-1β plasma concentrations. The remaining 123 patients received placebo. Biomarker measurements included 7,925 plasma concentrations of CRP; 11,394 ACRx scores were recorded.
Structural models
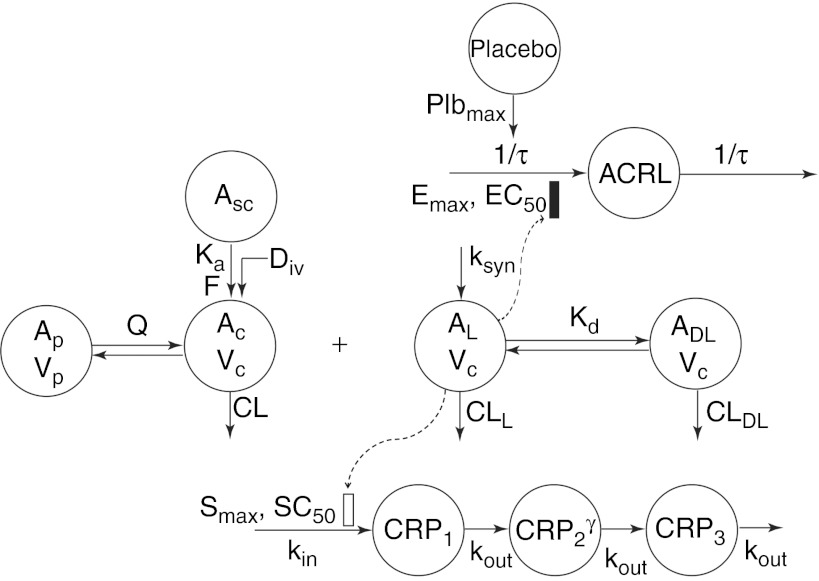
The final PK/PD models are depicted in Figure 1. The PK of total canakinumab was described using a standard two-compartment model, with a first-order absorption rate constant (ka) and a linear clearance (CL) from the central compartment. A quasi-equilibrium model was used to describe the binding of canakinumab to the ligand (IL-1β),21 which was assumed to be synthesized at a zero-order rate (ksyn) and eliminated with a clearance CLL. Free canakinumab (AC) binds free IL-1β (AL) to form a drug–ligand complex, governed by equilibrium dissociation constant (Kd) and removed by a linear clearance CLDL. Total canakinumab, TC, as assayed, is the sum of AC and drug–ligand complex; total IL-1β, TL, is the sum of AL and drug–ligand complex. During the model building process, estimates of CLDL and CL were found to be similar; therefore, CLDL and CL were assumed to be equal; therefore, CL represents the overall or total clearance of canakinumab.
Figure 1.
Pharmacokinetic/pharmacodynamic (PK/PD) model diagram for canakinumab. Asc, Ac, and Ap are the amounts of free canakinumab in the subcutaneous site, central, and peripheral compartments, respectively. AL and drug–ligand complex are the amounts of free IL-1β and the complex of IL-1β bound to canakinumab in the central compartment. CRPi are the transit compartments for C-reactive protein and ACRL is a latent variable. CRP, C-reactive protein; Vc and Vp the canakinumab central and peripheral volumes of distribution.
The time delay in the dynamical response of CRP was captured using a transit compartment model.22 As shown in Figure 1, three transit compartments were included, with CRP production as a zero-order process (kin). The transfer from one compartment to the next was through a first-order process (kout), assumed to be identical for each compartment. Normalized plasma concentrations of free IL-1β served as a stimulatory driver for the production of CRP. An amplification process, modeled as a γ-parameter on the input to the third differential in the CRP series, was incorporated empirically to achieve a better fit to the CRP data.
The final model for ACRx scores used a modified latent variable (ACRL) approach for multiple related binary outcome variables.23 The disease condition was modeled using a single transit compartment with identical first-order production and loss rate constants (1/τ, reciprocal of the mean transit time). The difference of free IL-1β from its baseline was incorporated into a sigmoidal Emax function to indirectly represent the inhibitory effect of the drug on disease processes (described in Methods section). The latent variable was related to the probability of achieving 20, 50, or 70% improvement from baseline conditions using a logit transform.
Pharmacokinetics of total canakinumab and total IL-1β
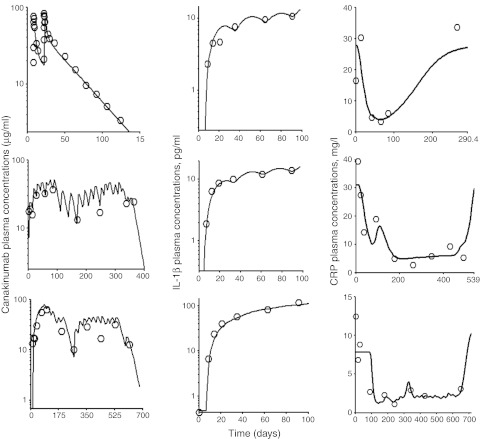
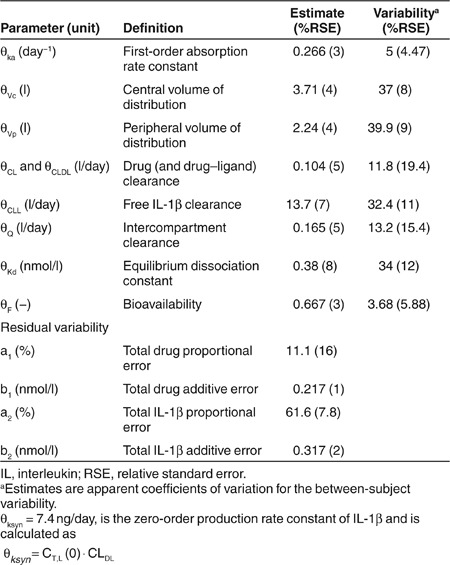
The timecourse of observed and predicted total canakinumab and total IL-1β concentrations for three representative patients are shown in the left and middle panels of Figure 2. Total canakinumab profiles suggested a long terminal half-life. Total IL-1β concentrations increased substantially, sometimes over 100-fold, to a new steady-state level. Estimated population PK parameters, along with variability between subject (BSV) and residual terms for drug and IL-1β, are reported in Table 1. All parameters were estimated with good precision. Bioavailability following subcutaneous administration was incomplete at 67%. The interpatient variability for the absorption rate and bioavailability was estimated to be low at 5% and 4%. Especially, the absorption rate may reflect the limited information available from relatively sparse sampling in the first half-week postdosing. As expected, the volume of distribution of canakinumab was slightly greater than blood volume (about 7 liters), and the clearance of IL-1β was greater than that of the drug or drug–ligand complex (13.7 vs. 0.107 l/day). The effects of body weight, age, gender, and methotrexate comedication were tested for explaining BSV of model parameters controlling free drug and total IL-1β. Only body weight was identified as a statistically significant covariate on CL, CLL, CLD, Vc, and Vp. Model diagnostics are provided in Supplementary Materials and Methods online (Supplementary Figures S1–S3 online) and normalized visual predictive checks are shown in Supplementary Figure S4 online. No systematic deviation from unity was observed for the ratio of the median to predicted concentrations obtained after simulating 100 data sets.
Figure 2.
The time-course of plasma concentrations of total canakinumab (left panels), total interleukin-1β (IL-1β) (center panels), and C-reactive protein (CRP) (right panels) for representative patients all administered subcutaneously with canakinumab at 2 mg/kg. Symbols represent the observed concentrations. Solid and broken lines are the mean population and individual model predicted concentrations.
Table 1. Fixed and random effect parameters of canakinumab and IL-1β kinetics.
CRP pharmacodynamics
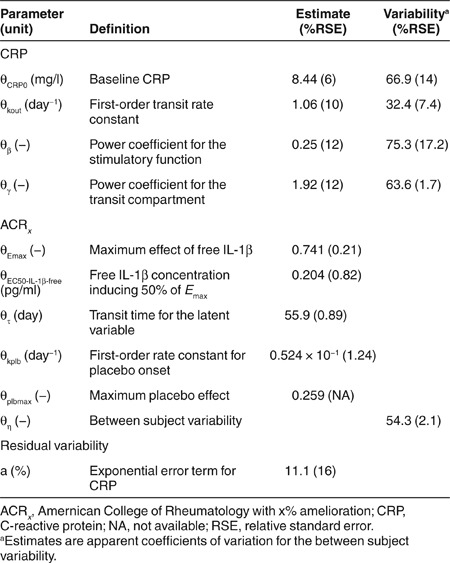
The baseline plasma concentration of CRP was 8.4 mg/l, but exhibited a relatively high BSV of 67% (Table 2). Drug administration resulted in a gradual decrease of CRP concentrations suggesting substantial inhibition of CRP in response to a decrease in free IL-1β (Figure 2, right panels). The model well captured the overall trend of CRP concentration–time profiles (Figure 2). Estimated model parameters for CRP are reported in Table 2; all terms showed good precision. The first-order transit rate constant was slow (1.06/day) and a signal amplification factor significantly improved model fitting (γ = 1.92). Model diagnostics for CRP are also shown in the Supplementary Materials and Methods online (Supplementary Figures S1–S4 online) and suggest reasonable model performance.
Table 2. Fixed and random effects of the population pharmacodynamic model for CRP and ACRx.
ACRx clinical response
The visual predictive checks for the probabilities of ACRx scores over time are shown in Figure 3. The model well described the data as demonstrated by the centrally located 50th percentiles (dashed lines) and the 5th and 95th percentiles (shaded areas) encompassing the range of the observed ACRx frequencies. Estimated parameters and BSV terms are reported in Table 2. The capacity parameter for the maximal effect of the drug was greater than that of the placebo treatment (Emax 0.75 vs. 0.25).
Figure 3.
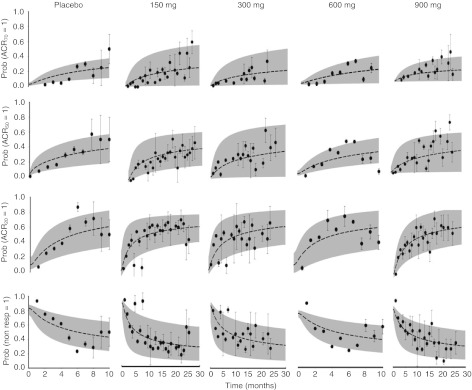
Visual predictive checks for American College of Rheumatology with x% amelioration probabilities. Symbols represent observed frequencies, and broken lines are the median (i.e., 50th percentile) of 100 simulated data sets. Shaded areas represent the bounds of the 5th and 95th percentiles of the predicted confidence interval.
Model simulated responses
To evaluate the role of canakinumab dose, model simulations of total drug, total and free IL-1β, and the difference between baseline and predicted IL-1β concentrations were conducted for 150, 300, 600, and 900 mg given subcutaneously every 2 weeks for five doses (Figure 4). With the exception of canakinumab pharmacokinetics, temporal profiles of mean concentrations show little differences across dose levels. A drug effect was confirmed in simulations comparing ACRx scores, and the latent variable (ACRL), in placebo and canakinumab-treated patients with RA following a single subcutaneous dose of 150 mg (Figure 5). However, the apparent lack of additional benefit from increasing the dose beyond 150 mg was further supported with simulations comparing the probability of ACRx responses following single subcutaneous injections of increasing doses (Supplementary Figure S5 online).
Figure 4.
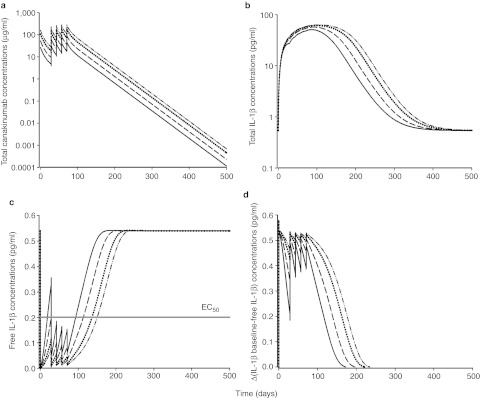
Simulated temporal profiles for (a) total canakinumab, (b) total IL-1β, (c) free IL-1β, and (d) difference between baseline and predicted free IL-1β concentrations. The simulated regimen was canakinumab administered subcutaneously at 2 (solid line), 4 (dashed line), 8 (dotted line), and 12 mg/kg (dashed and dotted line) Q2W.
Figure 5.
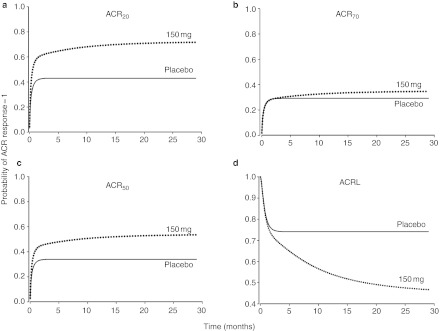
Simulations of the probability of (a) ACR20, (b) ACR50, (c) ACRr70, and (d) the latent variable (ACRL) after single sc injection of canakinumab. Comparisons are shown for the temporal changes of the probability of ACRx responses and ACRL between placebo (solid line) and treated patients with rheumatoid arthritis (dotted line) following administration of canakinumab at a single sc dose of 2 mg/kg. ACR, American College of Rheumatology.
Discussion
In this analysis, population-based models were developed to provide insights into the potential use of canakinumab for treating RA. A wide range of dose levels were evaluated following intravenous and subcutaneous administration on once every 2- or 4-week schedules. Although canakinumab appeared to improve clinical scores, based on our simulations, increasing dose levels beyond 150 mg (up to 900 mg) failed to further improve outcomes. The final PK/PD models effectively linked a continuous endogenous biomarker (i.e., IL-1β) to a binary clinical response variable (i.e., ACRx) and provided insights into the apparent lack of a dose–response relationship.
The pharmacokinetics of total canakinumab appear to be linear and stationary over the range of dose levels tested. A standard two-compartment model was sufficient for characterizing total canakinumab disposition, with dose linearity confirmed by a noncompartmental analysis.24,25 The integrated canakinumab-IL-1β PK–PD model resembles a quasi-equilibrium approximation of target-mediated drug disposition21 where temporal changes in both antibody and ligand are available and influence one another. As total canakinumab disposition is linear, the individual parameters of the two-compartment model were fixed and the binding model was applied to total IL-1β concentrations. The half-life of IL-1β was less than that of canakinumab (4.5 h vs. 25 days). The clearance of the drug–ligand complex was assumed to be the same as that of the free antibody. As expected for monoclonal antibodies, the absorption half-life for canakinumab was extended (1.9 days) and its bioavailability incomplete (67%, Table 1). These findings are aligned with previously published results following a subcutaneous administration of canakinumab.25,26,27 The estimated equilibrium dissociation constant was 6.4-times lower than the in vitro measurement, but similar to the estimated value reported in patients experiencing cryopyrin-associated periodic syndromes.15,17 The well-estimated PK parameters were also in good agreement with values submitted to the US Food and Drug Administration.28 This model was used to predict free IL-1β concentrations to drive downstream pharmacological effects of IL-1β on inflammatory processes.
The model mean estimated baseline CRP concentration was similar to the average value reported for healthy volunteers.29 The number of transit compartments for describing the CRP profiles was varied and three compartments were determined to be optimal (data not shown). Despite identifying the optimal number of compartments, simulations suggested that the stimulatory signal from normalized free IL-1β concentrations on CRP production was relatively low (data not shown). Therefore, an amplification factor was applied on the input to the third transit compartment to enhance the signal. This addition significantly improved model fitting and, although the mechanistic explanation remains to be determined, temporal CRP profiles in plasma were then well captured for all patients. The half-life of the CRP response system, 15.7 h, calculated from the value of kout, of 1.06/d, was similar to the half-life of CRP itself (about 19 h).30
A logistic regression model was used to link endogenous IL-1β concentrations and a latent variable to capture the timecourse of the probability of ACRx response with high fidelity (Figure 4). We modified the ACRL approach of Hu et al.23 to include regulation of the latent variable by an endogenous factor. The model of Hu et al.23 is an extension of the mixed effect logistic regression approach with a continuous latent variable described by Hutmacher et al.31 Another approach includes a Markov transition model;32 however, the multiple outcomes methodology allows for the simultaneous fitting of the model to all ACRx scores. At the beginning of the study (time = 0), the logit term approaches −∞, resulting in a probability response prob (ACRx = 1) of 0, which is representative of the initial clinical condition for these patients. In addition, the standard logistic regression approach requires an intercept to be estimated for each ACRx probability response, whereas the ACRL technique uses a modified logit term that is flexible and allows intercepts to differ according to the ACRx score without adding more parameters to the model.
The final ACRx model differed from the original23 in that ACRL was modeled using a transit compartment driven by predicted free endogenous ligand exposure rather than drug concentrations. Despite the relatively large BSV (54% coefficient of variation), the model well captured the trend of the observed data (Figure 3). The mean transit time for the amelioration of RA was 56 days and was consistent with literature results.23 Model predictions showed that the drop in free IL-1β concentrations after binding to free canakinumab has a greater potential for the amelioration of patient symptoms as compared with the placebo effect (Emax 0.75 vs. 0.25).
The cellular signaling of IL-1β is complex and involves multiple competing ligands interacting with different forms of IL-1β membrane-bound or soluble receptors.8 The IL-1RI receptor and its associated accessory protein, IL1-RAcP, initiate IL-1β signaling activity, which is tightly controlled by physiological processes including negative feedback regulation loops, neutralization and endocytosis of IL-1β and binding to decoy and soluble receptors.33 Canakinumab selectively attenuates systemic high concentrations of IL-1β to the pmol/l range, but allows high concentrations of IL-1β in local inflammatory spaces, such as joint synovial fluid. Although IL-1β is thought to act locally, rather than systemically, it is a potent cytokine, requiring <5% receptor occupancy to induce maximum response.34,35 In addition, experimental measurements of IL-1β concentrations in peripheral tissues are often unavailable. Hence, the final model was implemented using IL-1β systemic concentrations to avoid parameter identifiability concerns.
A cell-based activity assay for IL-1β signaling activity following exposure to XOMA-052, a recombinant monoclonal antibody with high affinity and specificity for IL-1β, confirms activity at low IL-1β concentrations around 1–2 pmol/l.36,37 The final model predicted a 10-fold lower EC50 for IL-1β than this in vitro measurement (Table 2); this may result from competitive binding processes to IL-1RI that occur in vivo but not in vitro. Of note, simulations of free IL-1β systemic concentrations following escalating doses given at the same schedule reveal that concentrations remain below the EC50 for all regimens, which may explain the lack of a dose-dependent benefit in ACRx responses for patients receiving canakinumab (Supplementary Figure S5 online). Indeed, it is the insight into potential mechanisms which are advantageous over more traditional methods of linking plasma drug concentrations to clinical responses. Although it may have been possible, and perhaps quicker, to create a model where canakinumab indirectly influenced CRP and the probability of an ACR response, it would have been necessary to invoke virtual or latent intermediaries to achieve a model fit. As data were available directly quantitating the capture of IL-1β by canakinumab, it was sensible to incorporate this to generate further understanding on the role of cytokine binding on the dose-time-responses.
In summary, this analysis confirmed that canakinumab does have a clinically small but statistically significant efficacy in RA. It also demonstrated that increasing canakinumab doses to >150 mg are unlikely to provide further benefit in RA clinical outcomes. The final PK/PD models captured the temporal changes in total canakinumab and IL-1β exposure as well as CRP concentrations and clinical ACRx scores. On the basis of IL-1β signal transduction that can result from low receptor occupancy, the clinical endpoint model used exposure of a free endogenous ligand as the pharmacological driver for subsequent effects. The model also provided a hypothesis for the lack of a clear dose response for canakinumab in RA, in that the extent of the involvement of IL-1β in the RA disease process, though definitely existent, is not as marked as other cytokines such as tumor necrosis factor-α and IL-6, making the early development detection and characterization of a dose response more difficult. Furthermore, following this analysis is the realization that lower doses would have had to have been tested. Nevertheless, the final model improves understanding of this system and could be further adapted to pre-existing or new therapies of inflammatory diseases with continuous and binary clinical endpoints.
Methods
Clinical trials. Data were obtained from four randomized, placebo-controlled clinical studies lasting from 12 weeks to 2 years and 4 months.27,38 A total of 472 patients with active RA were recruited, and 349 patients received canakinumab at doses ranging from 0.1 mg/kg to 900 mg (123 patients received placebo). Canakinumab was administered following a short intravenous infusion (2 h) or subcutaneously every 2 or 4 weeks (Q2W or Q4W) alone or in association with methotrexate. Individual study designs and clinical trial references are listed in Supplementary Materials and Methods online (Supplementary Table S1 online). Study protocols were approved by medical ethics committees and institutional review boards of the participating centers and all subjects provided written informed consent before enrollment.
Analytical assays
Total canakinumab and total IL-1β serum concentrations. A competitive enzyme-linked immunosorbent assay was used to determine total canakinumab concentrations in human plasma as described elsewhere.17 The limit of quantification was 42.6 ng/ml. IL-1β serum concentrations were measured using the Quantikine HS Human IL-1β immunoassay (R&D Systems, Minneapolis, MN), which was validated at Novartis (data not shown). Total IL-1β (i.e., sum of free IL-1β and canakinumab-IL-1β complex) was detected with a limit of detection of 0.1 pg/ml in human serum.
CRP plasma concentrations. CRP concentrations were measured with a high-sensitivity automated microparticle-enhanced latex turbidimetric immunoassay (CO-BAS MIRA; Roche, Rotkreuz, Switzerland). The limit of quantification was 0.2 mg/l with an interassay coefficient of variation of 6.3% at 1 mg/l.
Mathematical models
Total canakinumab and total IL-1β PK. Total canakinumab PK was described with the following set of differential equations
with Tsc, Tc, and Tp as the total amounts of canakinumab at the subcutaneous injection site, the central, and peripheral compartments, respectively, Vc and Vp the canakinumab central and peripheral volumes of distribution, and Q the intercompartmental drug clearance. Initial conditions were defined as Tsc (0) = F · Dose, Tc(0) = 0, and Tp(0) = 0. The bioavailability parameter was modeled in the logit domain: F = (1/1 + θF · eηF. Total canakinumab concentrations in the sampled central compartment were calculated as Tc/Vc and converted from molar concentrations to (µg/ml) by accounting for molecular weight (150 kDa).11,13
The binding and dissociation of canakinumab to IL-1β was characterized using an equilibrium target-mediated disposition model.21 Endogenous total IL-1β turnover was described by the following equation
which describes the zero order production of IL-1β, ksyn, followed by a loss of the drug–ligand complexes (TC–AC), (e.g., by internalization, CLDL/VC), then elimination of free IL-1β (TL-(TC-AC)) by CLL/VC. The clearance of the drug–ligand (DL) complex, CLDL, was assumed to be the same as free drug. The concentration of total IL-1β (pg/ml) was calculated as CT,L = TL/Vc, converted from molar concentrations by accounting for its molecular weight (17 kDa),33 and the initial condition was fixed to observed baseline values. Free amounts of canakinumab, AC in Figure 1, were defined as the solution to the quadratic
Predicted free IL-1β concentrations were calculated as Cf,L = CT,L − CDL, with CDL as the drug–ligand complex:
CRP dynamics. Predicted free IL-1β concentrations were used as a driver for stimulating the production of CRP. The series of differential equations for the transduction model was
The stimulation function was defined as S(t) = (Cf,L/Cf,L (0))β. An Emax or Hill type function was evaluated; however, the EC50 parameter was not identifiable. Thus, a more simplistic equation with a reduced number of parameters to be estimated was used to stabilize the model. The initial conditions, CRP(0), were CRP1(0) = CRP2(0) =kin/kout and CRP3(0) = [CRP2(0)]γ = [kin/kout]γ. The zero-order production rate constant (kin) was computed as a secondary parameter: kin = [CRP0 × koutγ]1/γ. An empirical amplification parameter, γ, was added to the input of the final differential equation, dCRP3, in order to better fit the model to plasma CRP data. The output from the transduction series, CRP3, was fitted to the plasma CRP data.
ACRx probability responses. The rate of change of a continuous latent variable was described as a transit compartment model23
The initial condition to Eq. 9 was set to 1, with τ the mean transit time. The input signal (PROD) was defined as PROD = 1 − Ef,L − Eplb, which is driven by a stimulatory Hill function including the difference between baseline and free predicted IL-1β concentrations.
 |
The contribution of the placebo effect (Eplb) on the latent variable was added to the production process as:
where plbmax is the maximum placebo effect; t is the time after the first dose; and kplb is a first-order rate constant. The probability of achieving 20, 50, or 70% improvement from baseline was described using a logit transform
 |
where the logit function is defined as logit(n = ln(n/1−n). Simultaneous modeling of ACRx was achieved by transforming the binary outcomes to categorical variables
achieving ACR20 = prob(ACR20 = 1)
achieving ACR50 = prob(ACR50 = 1) − prob(ACR20 = 1)
achieving ACR70 = prob(ACR70 = 1) − prob(ACR50 = 1)
not achieving ACR20 = 1 − prob(ACR20 = 1) with probabilities given by Eq. 12.
Data analysis. Population parameters were estimated with the Stochastic Approximation Expectation Maximization algorithm in Monolix (version 3.1 R2; http://www.lixoft.com/)39 The BSV on population parameters were estimated and all interindividual terms were assumed to follow a log-normal distribution:
where Pi was the PK parameter for the ith individual, θPi the population typical value for Pi, and ηPi the BSV random effect, which was normally distributed with a mean of 0 and variance  . Additive and proportional residual variability models were applied for total canakinumab and total IL-1β concentrations
whereas an exponential residual variability error model was used for CRP plasma concentrations:
with C as the observed plasma concentrations,  the model predicted value, ε1, ε2, and ε the additive, proportional, and exponential residual error terms of the observed concentrations for D, L, and CRP, respectively, which were assumed to be random Gaussian variables with mean zero and variance (σ2). The final model included body weight as a significant covariate on D and L clearances as well as the central and peripheral volumes of distributions such as: CL = θCL · eηCL · (BWT/70)¾ and V = θv · eηv · (BWT/70).
Goodness of fit for canakinumab, total IL-1β, and CRP variables were evaluated by visual inspection of diagnostic plots. Binning was required to overcome the differences in sampling times over the four studies and visual predictive checks were performed through simulations of 100 data sets using the final PK and PD parameters. For drug, ligand, and CRP measurements, the ratios from the median of the predicted data over the median of the observed data were calculated and plotted against time. For ACRx scores, 5th, 95th, and 50th percentiles of the predicted ACRx probability responses were superimposed with the observed ACRx response frequencies. Confidence intervals around the frequencies were obtained according to  , where
  is the observed ACRx frequency and N the total number of patients at time, t.
Author Contributions
P.J.L., S.a-O., and D.E.M. wrote the manuscript. P.J.L. and D.E.M. designed the research. S.a-O. and D.E.M. performed the research. S.a-O. analyzed the data.
Conflict of Interest
P.J.L. is employed by and owns shares in Novartis Pharma AG, Switzerland, the manufacturer of canakinumab. S.A.O. and D.E.M. declare no conflicts of interest. As an Associate Editor for CPT:PSP, Don Mager was not involved in the review or decision process for this paper.
Study Highlights
Acknowledgments
We wish to thank all the patients, clinicians, and staff that were responsible for generating the data used in this study. We thank Stacey Tannenbaum for her helpful review and discussion of the modeling results. This analysis was supported by the Laboratory of Protein Therapeutics, University at Buffalo, SUNY, and NIH GM57980 (D.E.M.).
Supplementary Material
References
- Tabrizi M.A., Tseng C.M., &, Roskos L.K. Elimination mechanisms of therapeutic monoclonal antibodies. Drug Discov. Today. 2006;11:81–88. doi: 10.1016/S1359-6446(05)03638-X. [DOI] [PubMed] [Google Scholar]
- Harris E.D., Jr Rheumatoid arthritis. Pathophysiology and implications for therapy. N. Engl. J. Med. 1990;322:1277–1289. doi: 10.1056/NEJM199005033221805. [DOI] [PubMed] [Google Scholar]
- Gabriel S.E. The epidemiology of rheumatoid arthritis. Rheum. Dis. Clin. North Am. 2001;27:269–281. doi: 10.1016/s0889-857x(05)70201-5. [DOI] [PubMed] [Google Scholar]
- Choy E.H., &, Panayi G.S. Cytokine pathways and joint inflammation in rheumatoid arthritis. N. Engl. J. Med. 2001;344:907–916. doi: 10.1056/NEJM200103223441207. [DOI] [PubMed] [Google Scholar]
- Roy A., Mould D.R., Wang X.F., Tay L., Raymond R., &, Pfister M. Modeling and simulation of abatacept exposure and interleukin-6 response in support of recommended doses for rheumatoid arthritis. J. Clin. Pharmacol. 2007;47:1408–1420. doi: 10.1177/0091270007307573. [DOI] [PubMed] [Google Scholar]
- Dinarello C.A. IL-1: discoveries, controversies and future directions. Eur. J. Immunol. 2010;40:599–606. doi: 10.1002/eji.201040319. [DOI] [PubMed] [Google Scholar]
- Eder C. Mechanisms of interleukin-1beta release. Immunobiology. 2009;214:543–553. doi: 10.1016/j.imbio.2008.11.007. [DOI] [PubMed] [Google Scholar]
- Dinarello C.A. Biologic basis for interleukin-1 in disease. Blood. 1996;87:2095–2147. [PubMed] [Google Scholar]
- Feely M.G., Erickson A., &, O'Dell J.R. Therapeutic options for rheumatoid arthritis. Expert Opin. Pharmacother. 2009;10:2095–2106. doi: 10.1517/14656560903071043. [DOI] [PubMed] [Google Scholar]
- Riley K.FDA approves new drug for rheumatoid arthritis. < < http://www.fda.gov/NewsEvents/Newsroom/PressAnnouncements /ucm197108.htm .> ( 2012. Accessed 19 June 2012.
- Dhimolea E. Canakinumab. MAbs. 2010;2:3–13. doi: 10.4161/mabs.2.1.10328. [DOI] [PMC free article] [PubMed] [Google Scholar]
- Geyer M., &, Müller-Ladner U. Actual status of antiinterleukin-1 therapies in rheumatic diseases. Curr. Opin. Rheumatol. 2010;22:246–251. doi: 10.1097/BOR.0b013e3283373fa0. [DOI] [PubMed] [Google Scholar]
- Ponniah P. John Wiley & Sons, New York, NY; 2001. Data warehousing fundamentals: A comprehensive guide for IT profession. [Google Scholar]
- Kagan L., Gershkovich P., Mendelman A., Amsili S., Ezov N., &, Hoffman A. The role of the lymphatic system in subcutaneous absorption of macromolecules in the rat model. Eur. J. Pharm. Biopharm. 2007;67:759–765. doi: 10.1016/j.ejpb.2007.04.002. [DOI] [PubMed] [Google Scholar]
- Lachmann H.J.et al. Use of canakinumab in the cryopyrin-associated periodic syndrome N. Engl. J. Med 3602416–2425.2009 [DOI] [PubMed] [Google Scholar]
- Charman S.A., Segrave A.M., Edwards G.A., &, Porter C.J. Systemic availability and lymphatic transport of human growth hormone administered by subcutaneous injection. J. Pharm. Sci. 2000;89:168–177. doi: 10.1002/(SICI)1520-6017(200002)89:2<168::AID-JPS4>3.0.CO;2-Q. [DOI] [PubMed] [Google Scholar]
- Lachmann H.J.et al. In vivo regulation of interleukin 1beta in patients with cryopyrin-associated periodic syndromes J. Exp. Med 2061029–1036.2009 [DOI] [PMC free article] [PubMed] [Google Scholar]
- Toker O., &, Hashkes P.J. Critical appraisal of canakinumab in the treatment of adults and children with cryopyrin-associated periodic syndrome () Biologics. 2010;4:131–138. doi: 10.2147/btt.s7580. [DOI] [PMC free article] [PubMed] [Google Scholar]
- Felson D.T.et al. The American College of Rheumatology preliminary core set of disease activity measures for rheumatoid arthritis clinical trials. The Committee on Outcome Measures in Rheumatoid Arthritis Clinical Trials Arthritis Rheum 36729–740.1993 [DOI] [PubMed] [Google Scholar]
- Felson D.T.et al. American College of Rheumatology. Preliminary definition of improvement in rheumatoid arthritis Arthritis Rheum 38727–735.1995 [DOI] [PubMed] [Google Scholar]
- Mager D.E., &, Krzyzanski W. Quasi-equilibrium pharmacokinetic model for drugs exhibiting target-mediated drug disposition. Pharm. Res. 2005;22:1589–1596. doi: 10.1007/s11095-005-6650-0. [DOI] [PubMed] [Google Scholar]
- Mager D.E., &, Jusko W.J. Pharmacodynamic modeling of time-dependent transduction systems. Clin. Pharmacol. Ther. 2001;70:210–216. doi: 10.1067/mcp.2001.118244. [DOI] [PubMed] [Google Scholar]
- Hu C., Xu Z., Rahman M.U., Davis H.M., &, Zhou H. A latent variable approach for modeling categorical endpoints among patients with rheumatoid arthritis treated with golimumab plus methotrexate. J. Pharmacokinet. Pharmacodyn. 2010;37:309–321. doi: 10.1007/s10928-010-9162-4. [DOI] [PubMed] [Google Scholar]
- Bonner J., Lloyd P., Lowe P., Golor G., Woessner R., &, Pascoe S.PK/PD, safety and tolerability of a human anti-IL-1β monoclonal antibody (ACZ885) in healthy subjects16th Annual Congress of the European Respiratory Society. Munich, Germany; 2–6 September 2006. Abstract 748. [Google Scholar]
- Chakraborty A.et al. Pharmacokinetic and pharmacodynamic properties of canalinumab, a human anti-IL-1β monoclonal antibody Clin Pharmacokinet 51e1–18.2012 [DOI] [PMC free article] [PubMed] [Google Scholar]
- Kagan L., Abraham A.K., Harrold J.M., &, Mager D.E. Interspecies scaling of receptor-mediated pharmacokinetics and pharmacodynamics of type I interferons. Pharm. Res. 2010;27:920–932. doi: 10.1007/s11095-010-0098-6. [DOI] [PMC free article] [PubMed] [Google Scholar]
- Alten R.et al. The human anti-IL-1β monoclonal antibody ACZ885 is effective in joint inflammation models in mice and in a proof-of-concept study in patients with rheumatoid arthritis Arthritis Res. Ther 10R67.2008 [DOI] [PMC free article] [PubMed] [Google Scholar]
- Ilaris™ (canakinumab) Subcutaneous Injection Drug Approval Package. Clinical Pharmacology and Biopharmaceutics Reviews 2009 ) http://www.accessdata.fda.gov/drugsatfda_docs/nda/2009/ 125319s000_ClinPharmR.pdf . Accessed 19 June 2012.
- Clyne B., &, Olshaker J.S. The C-reactive protein. J. Emerg. Med. 1999;17:1019–1025. doi: 10.1016/s0736-4679(99)00135-3. [DOI] [PubMed] [Google Scholar]
- Pepys M.B., &, Hirschfield G.M. C-reactive protein: a critical update. J. Clin. Invest. 2003;111:1805–1812. doi: 10.1172/JCI18921. [DOI] [PMC free article] [PubMed] [Google Scholar]
- Hutmacher M.M., Krishnaswami S., &, Kowalski K.G. Exposure-response modeling using latent variables for the efficacy of a JAK3 inhibitor administered to rheumatoid arthritis patients. J. Pharmacokinet. Pharmacodyn. 2008;35:139–157. doi: 10.1007/s10928-007-9080-2. [DOI] [PubMed] [Google Scholar]
- Lacroix B.D., Lovern M.R., Stockis A., Sargentini-Maier M.L., Karlsson M.O., &, Friberg L.E. A pharmacodynamic Markov mixed-effects model for determining the effect of exposure to certolizumab pegol on the ACR20 score in patients with rheumatoid arthritis. Clin. Pharmacol. Ther. 2009;86:387–395. doi: 10.1038/clpt.2009.136. [DOI] [PubMed] [Google Scholar]
- Dinarello C.A. Interleukin-1, interleukin-1 receptors and interleukin-1 receptor antagonist. Int. Rev. Immunol. 1998;16:457–499. doi: 10.3109/08830189809043005. [DOI] [PubMed] [Google Scholar]
- Dinarello C.A. The many worlds of reducing interleukin-1. Arthritis Rheum. 2005;52:1960–1967. doi: 10.1002/art.21107. [DOI] [PubMed] [Google Scholar]
- Martinon F., Petrilli V., Mayor A., Tardivel A., &, Tschopp J. Gout-associated uric acid crystals activate the NALP3 inflammasome. Nature. 2006;440:237–41. doi: 10.1038/nature04516. [DOI] [PubMed] [Google Scholar]
- Owyang A.M.et al. XOMA 052, a potent, high-affinity monoclonal antibody for the treatment of IL-1β-mediated diseases MAbs 349–60.2011 [DOI] [PMC free article] [PubMed] [Google Scholar]
- Roell M.K.et al. Kinetic approach to pathway attenuation using XOMA 052, a regulatory therapeutic antibody that modulates interleukin-1beta activity J. Biol. Chem 28520607–20614.2010 [DOI] [PMC free article] [PubMed] [Google Scholar]
- Alten R.et al. Efficacy and safety of the human anti-IL-1β monoclonal antibody canakinumab in rheumatoid arthritis: results of a 12-week, Phase II, dose-finding study BMC Musculoskelet. Disord 12153.2011 [DOI] [PMC free article] [PubMed] [Google Scholar]
- Ishii M.et al. Direct comparison of GeneChip and SAGE on the quantitative accuracy in transcript profiling analysis Genomics 68136–143.2000 [DOI] [PubMed] [Google Scholar]
Associated Data
This section collects any data citations, data availability statements, or supplementary materials included in this article.


