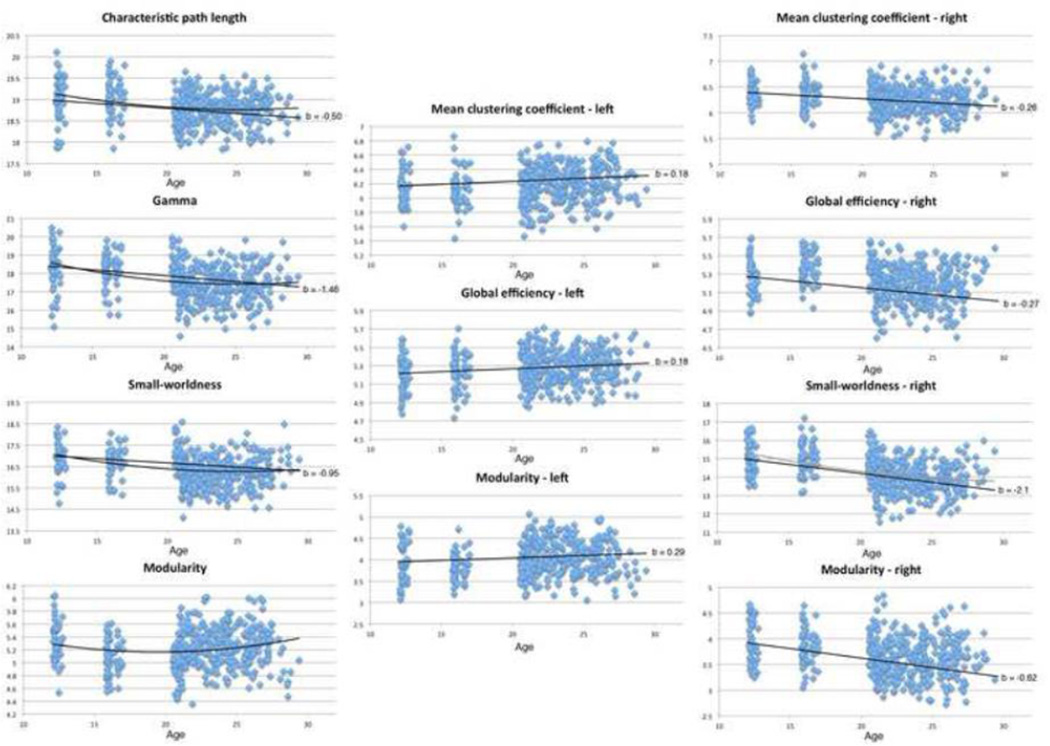
Figure 1. Scatterplots showing significant associations between global graph theory connectivity scores and age in whole brain, left, and right hemispheres.
Linear trendlines added with slopes and b values (regression coefficients) corresponding to results from Tables 1–3. Slopes taken from b values from Eq. 2 results, no linear trendline in included for modularity (whole brain), as that analysis was not significant.

