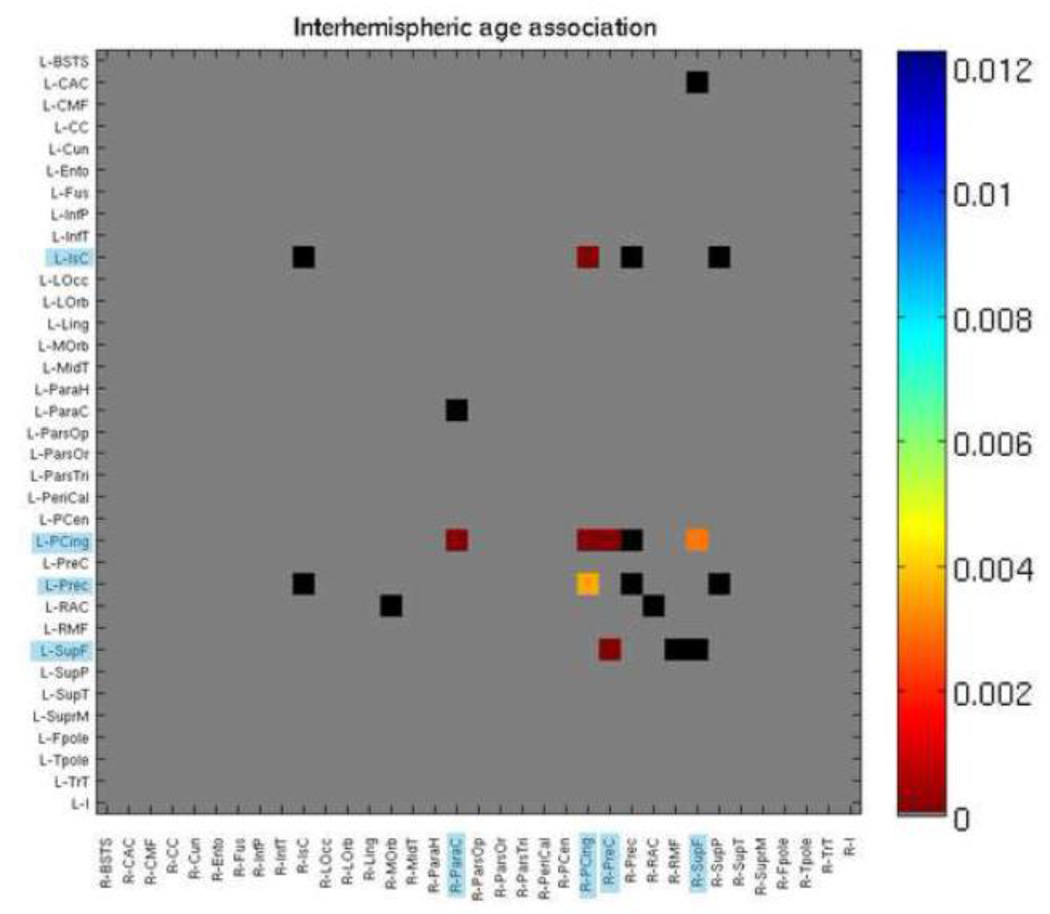
Figure 6. P maps of age effects, when modeled alone (Eq. 2), with 35×35 interhemispheric fiber density matrix.
Colors correspond to strength of p value as indicated by color bar. Blue highlighting on regions indicate significance. Gray boxes were not tested as those connections were not present. Black boxes were tested but not significant. FDR corrected (q < 0.05). See Table 6 for region key.

