

Abstract
Objective
HiRes (HR) 120 is a sound processing strategy purported to offer an increase in the precision of frequency-to-place mapping through the use of current steering. This within-subject study was designed to compare speech recognition as well as music and sound quality ratings for HR and HR 120 processing.
Setting
Cochlear implant/tertiary referral center.
Subjects
Eight postlinguistically deafened adults implanted with an Advanced Bionics CII or HR 90K cochlear implant.
Study Design/Outcome Measures
Performance with HR and HR 120 was assessed during four test sessions with a battery of measures including monosyllabic words, sentences in quiet and in noise, and ratings of sound quality and musical passages.
Results
Compared to HR, speech recognition results in adult cochlear implant recipients revealed small but significant improvements with HR 120 for single syllable words, and for two of three sentence recognition measures in noise. Both easy and more difficult sentence material presented in quiet were not significantly different between strategies. Additionally, music quality ratings were significantly better for HR 120 than for HR and seven of eight subjects preferred HR 120 over HR for listening in everyday life.
Conclusions
HR 120 may offer equivalent or improved benefit to patients compared to HR. Differences in performance on test measures between strategies are dependent on speech recognition materials and listening conditions.
Keywords: Cochlear implant, sound processing, current steering, speech recognition
INTRODUCTION
Until recently, the Advanced Bionics CII or 90k internal implant utilized the HiRes (HR) sound processing strategy with higher rates of stimulation and more channels than were previously available. The implementation of HR resulted in improvements in speech recognition in adults, particularly in noise (1).
With HR sound processing (illustrated in the middle panel of Figure 1), representation of the incoming stimulus frequency spectrum is limited by the number of electrode contacts (represented as circles). The incoming sound is separated into 16 bands (black dashed lines) corresponding to the 16 intra-cochlear electrodes. The instantaneous energy is estimated in each band, and is used to determine the amplitude of stimulation (arrows). A recent version of this strategy, referred to as HR 120 (illustrated in the bottom panel of Figure 1), increases the number of channels of stimulation through the use of “current steering” (2–5). Additional pitch percepts can potentially be created by varying the proportion of current delivered to each electrode of an adjacent electrode pair (e.g. Els 2 & 3, Els 3 & 4, Els 4 & 5, etc.). HR 120 uses 15 electrode pairs (if all 16 electrodes are active) and current steering creates eight additional stimulation sites between each of these electrode pairs, totaling a maximum of 120 potential sites of stimulation for the entire array. The signal is divided into 15 bands, with each band corresponding to a space between a pair of electrodes (black dashed lines). In addition, a sub-band analysis is performed whereby location of the spectral maximum is identified within each band (gray dotted lines). Finally, the location of each spectral maxima is used to determine one of eight virtual channels in between each electrode pair (arrows, bottom panel). Thus, in each stimulation frame, 15 of 120 potential sites are stimulated. The asterisks in the middle and lower panels of Figure 1 show the theoretical “central” spectra that would result for the two strategies in response to the audio spectrum in the top panel. Because HR 120 more accurately captures the spectral peaks, it may reproduce the “central” spectrum with better fidelity. In addition, simulations with normal-hearing listeners indicate that the processing used in HR 120 can support high levels of speech recognition in quiet and in noise (6–7).
Figure 1.
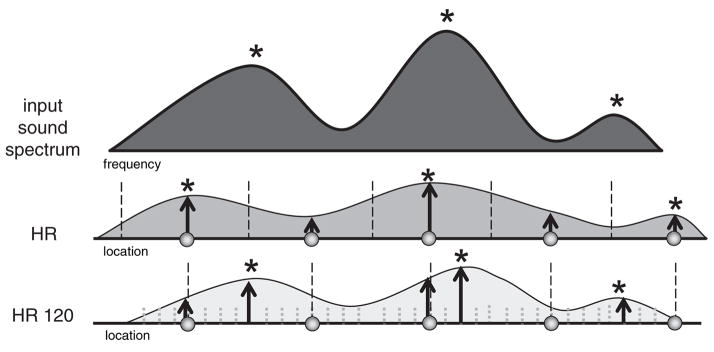
Schematic representation of an input stimulus frequency spectrum and corresponding stimulation with either HR or HR 120.
Although improved spectral analysis is made possible with HR 120, whether this additional spectral information is meaningful to patients is not entirely clear. Previous studies with other implant devices suggest that an increase in the number of stimulation sites does not necessarily equate with an increase in the number of effective channels of stimulation nor improvements in speech recognition (8–9). The purpose of the present study was to compare speech recognition performance as well as music and sound quality ratings with HR 120 and the earlier HR strategy in the same experimental subjects.
MATERIALS AND METHODS
The protocol for this study was reviewed and approved by the Washington University Human Research Protection Office (HRPO Number 05-0798). The study was completed in accordance with the principles expressed in the Declaration of Helsinki.
Subjects were eight postlinguistically deafened adults (six females and two males) implanted with the CII (n = 6) or 90K (n = 2) cochlear implant (Advanced Bionics, Valencia, CA, USA). The subjects ranged in age from 48–80 years at the time of participation with a mean age of 58 years. Duration of deafness in the implanted ear ranged from 3–22 years with a mean of 8 years. Mean duration of implant use with HR sound processing was 2 years with a range of 1–3 years. The etiologies of the subjects were as follows: familial hearing loss (n = 5), otosclerosis (n = 1), ototoxicity (n=1) and unknown (n = 1). All subjects showed evidence of open-set speech recognition with a minimum score on the consonant-vowel nucleus-consonant (CNC) word test (10) of 20% or greater when administered at 60 dB SPL using recorded material. All subjects had a fully inserted electrode array with a minimum of 14 active electrodes.
General Procedures
Subjects came to the Washington University School of Medicine Cochlear Implant Center for either three or four test sessions. Six subjects used an Auria behind-the-ear (BTE) processor and two used a body-worn Platinum Sound Processor (PSP). At the initial test session, behavioral sound-field detection thresholds, speech recognition measures and sound quality and music ratings were obtained with each subject using their everyday HR speech processor program on their own speech processor. At the end of that session, the two PSP users were fitted with HR 120. HR 120 can only be used with the PSP or the Harmony processor, the most recent BTE with modest changes from the Auria. Therefore, at the end of the initial test session, the six Auria BTE users were fitted with a Harmony BTE using their everyday HR program. After one week of experience with HR on the Harmony processor, testing was repeated to confirm that the processor change did not have a substantial effect on speech recognition performance. The six BTE users were then fitted with HR 120 on the Harmony processor. All eight subjects returned for assessment after 1 and 3 months use of the new strategy. At the completion of the 3 month HR 120 testing, subjects were re-fitted with HR and testing was repeated the same day. Table 1 provides a summary of the device and strategy used for each test session.
Table 1.
Summary of test sessions
| Baseline Session | 1 Week Session | 1 Month Session | 3 Month Session | |
|---|---|---|---|---|
| PSP Users | Evaluated with HR; fitted with HR 120 | Not Applicable | Evaluated with HR 120 | Evaluated with HR 120; re-fitted and evaluated with HR |
| BTE Users | Evaluated with HR on Auria; HR placedon Harmony. | Evaluated with HR on Harmony; fitted with HR 120. (Harmony used for all subsequent testing.) | Evaluated with HR 120 | Evaluated with HR 120; re-fitted and evaluated with HR |
Speech Recognition and Sound-Field Threshold Measures
Speech recognition measures were administered using both a direct connect system and sound booth testing. Direct connect systems provide an alternative for speech recognition evaluation that does not require a sound booth (11). Signals are sent directly to the speech processor by using the earhook with the audio input connector. For this study, sound-field testing was simulated using head-related transfer functions corresponding to a loudspeaker in front of the subject. The test materials included CNC monosyllabic words (one list of 50 words, 60 dB SPL), Hearing in Noise Test (HINT) sentences (12) (2 lists of 10 sentences each, 60 dB SPL), HINT sentences in noise (2 lists of 10 sentences each, 60 dB SPL, at a +8 signal-to-noise ratio [SNR] using speech spectrum noise [SSN]), and the Adaptive HINT sentence test (20 sentences, the sentence presentation level varies and the SSN is fixed at 52 dB SPL; the score is expressed as a SNR that yields a sentence recognition threshold of 50%).
Additional speech recognition measures were administered in a double-walled sound booth through a loudspeaker placed at 0 degrees azimuth and at a distance of 1 meter from the subject. Measures were HINT sentences (2 lists of 10 sentences each, 50 dB SPL), TIMIT sentences (13) (2 lists of 20 sentences each, 60 dB SPL), the Bamford, Kowal and Bench Speech in Noise Test (BKB-SIN) (14,15) (2 lists of 20 sentences each, using 4-talker babble at 65 dB SPL, the sentence presentation level varies from +21 to −6 dB SNR, the score is expressed as the SNR needed to obtain 50% of the words correct). These additional measures may better reflect listening in everyday life due to softer levels (HINT at 50 dB SPL), multiple talkers that include male and female speakers as well as regional dialects (TIMIT) and varying SNRs (BKB-SIN). Speech recognition measures administered in the sound booth and using the direct connect system were obtained during the same test sessions with one exception. For the measures administered in the sound booth, subjects were not re-tested with HR at the 3 month evaluation due to time constraints.
Sound-field detection thresholds were obtained with triangular-wave, frequency modulated (FM) tones at 0.25, 0.5, 0.75, 1, 2, 3, 4 and 6 kHz. The Hughson-Westlake procedure (16) was used with a 2 dB step size near threshold. Sound-field detection thresholds were obtained for each subject with both HR and HR 120 sound processing to ensure that each program enabled detection of stimuli at less than 30 dB HL. Subjects were tested with the speech processor settings that were used in daily life since these settings provided comfortable listening for conversational speech.
Music Ratings and Sound Quality
Ratings of music and sound quality were obtained at each test session using the direct connect system. Subjects listened to 10 music samples and were asked to rate each one on a scale of 0 to 10 for attributes of pleasantness and distinctness of the musical instruments within each music sample. In addition, the Iowa Sound Quality test was administered. Subjects were asked to listen to children’s voices, female voices, male voices, and environmental sounds and rate each on a scale from 0 (unclear) to 100 (clear).
Data Analysis
In addition to descriptive analysis, data were analyzed using paired t-tests, one-way ANOVA, and Pearson product-moment correlations. All calculations were made using SPSS, version 15.0 software (SPSS, Chicago, IL) and p-values less than 0.05 were considered statistically significant.
RESULTS
Group mean sound-field thresholds were averaged across the eight subjects when using HR and HR 120. Mean thresholds at 0.25, 0.5, 1, 2, 3, 4 and 6 kHz with HR were 21, 22, 23, 22, 27, 27, and 26 dB HL, respectively and with HR 120 were 24, 24, 23, 21, 24, 27 and 28 dB HL, respectively. The average detection thresholds were similar with either sound processing strategy, and both provided satisfactory detection of speech cues across the frequency range.
For all speech recognition measures administered in the sound booth (i.e., HINT and TIMIT sentences in quiet, BKB-SIN), test and re-test measures were obtained at each session. Pearson product-moment correlations of test and retest results indicated high reliability [r(22) = .89 to .96, p < 0.0001], and therefore the test/re-test scores were averaged.
Recall that at the initial test session, subjects were tested with their everyday HR program on their own speech processor; then, the six Auria BTE users had their everyday HR program placed on the new Harmony processor to use for one week. These six subjects were then tested with their everyday HR program on the Harmony processor. No significant differences in speech perception scores were found between the two BTE speech processors [CNC t(5)=−.4; HINT t(5)=−2.0; HINT in noise t(5)=−.92; Adaptive HINT t(5)=.73; HINT at 50 t(5)= −2.1; TIMIT t(5)=−2.5; BKB-SIN t(5)=1.5, for all p > 0.05]. For this reason, the 1 week test session was used as the baseline measure for the six BTE users participating in the study and the initial test session was used as the baseline measure for the two PSP users. This allowed consistent use of the same speech processor for each subject at all test sessions (baseline through 3 months).
Figure 2 shows group mean scores for the speech measures for each of the test sessions. Measures using the direct connect system are shown in Panel A (baseline HR, 1 month HR 120, 3 month HR 120, and 3 month HR) and those from the sound booth testing are shown in Panel B (baseline HR, 1 month HR 120, and 3 month HR 120). Paired t-tests indicated no statistical differences between time intervals for testing with the same coding strategy (across the test measures, comparison of results at baseline HR and 3 month HR, p values ranged from .49 to .95, and for comparison of results at 1 month HR 120 and 3 month HR 120, p values ranged from .15 to .79). For this reason, results from the direct connect testing obtained with the same strategy were then averaged (i.e. baseline HR and 3 month HR; 1 month HR 120 and 3 month HR 120; as shown in Figure 3). Since the number of test sessions with each strategy differed for the speech recognition testing in the sound booth, analyses were made between the baseline HR results and the 3 month HR 120 results. This allowed for comparison of results with relatively long term use (at least 3 months) with each strategy.
Figure 2.

Panel A: Group mean scores on the CNC monosyllabic words test (60 dB SPL), HINT sentence test in quiet (60 dB SPL), HINT sentence test in noise (60 dB SPL +8), and the Adaptive HINT test are shown for adult cochlear implant subjects when listening with HR (gray bars) and HR 120 (black bars) at four test intervals. Panel B: Group mean scores on the HINT at 50 dB SPL, TIMIT at 60 dB SPL, and BKB-SIN (65 dB SPL) are shown for subjects when listening with HR (gray bars) and HR 120 (black bars) at three test intervals. In both panels, error bars represent +/− 1 SE from the mean.
Figure 3.

Group mean scores on speech recognition tests of CNC words, HINT sentences in quiet, HINT sentences in noise and the Adaptive HINT are shown for subjects when listening with HR (gray bars) and HR 120 (black bars). Speech recognition measures were presented via the direct connect system. Error bars represent +/− 1 SE from the mean. Asterisks denote statistically significant differences in scores between strategies (* p < 0.05).
Group mean results with direct connect testing are shown in Figure 3. For CNC words (HR = 57%, HR 120 = 63%) and HINT sentences presented in SSN (HR = 61%, HR 120 = 69%), there was a small but statistically significant difference in scores; CNC words, t(7) = −2.9, p = .023; HINT in noise, t(7) = −2.5, p = .043. For HINT sentences in quiet, group mean scores were similar for the two strategies (90% and 92%, respectively). For the adaptive HINT, the scores for HINT sentences presented in noise are expressed as a SNR (lower is better) and mean scores were 10.0 dB and 8.8 dB, for HR and HR 120, respectively. Although scores with HR 120 were slightly better than scores with HR on the adaptive HINT, these differences were not statistically significant.
Figure 4 shows group mean scores for the baseline HR and 3 months HR 120 speech recognition measures administered in the double-walled sound booth. There was essentially no difference between HR and HR 120 scores for HINT and TIMIT sentences in quiet (HINT scores 82% and 83%, TIMIT scores 53% and 53%, respectively). Group mean results for the BKB-SIN test are shown in the right panel of Figure 4. Scores for the BKB-SIN are expressed as a SNR at which the listener scores 50% correct. Mean SNR across subjects for the baseline HR test session was 10.2 dB and for the 3 month HR 120 session was 9.2 dB; a significantly lower (better) mean SNR was seen for the HR 120 test session compared to the baseline HR (t(7) = −2.6, p = .037). With two exceptions, for all subjects and all speech recognition measures, HR 120 performance was better than or equal to HR performance. S8 scored better on the Adaptive HINT test with HR and S3 scored better on TIMIT sentences with HR.
Figure 4.

Group mean scores on the HINT sentence test in quiet (50 dB SPL), TIMIT sentence test in quiet (60 dB SPL), and the BKB-SIN test are shown for subjects when listening with HR (gray bars) and HR 120 (black bars). Speech recognition measures were presented in the sound booth. Error bars represent +/− 1 SE from the mean. Asterisks denote statistically significant differences in scores between strategies (* p < 0.05).
Group mean ratings (scale from 0 to 10) for pleasantness of music for each of the four test sessions (6.2, 7.1, 7.2, 5.8, respectively) and distinctness of musical instruments for each test session (5.9, 6.7, 6.5, 5.2, respectively) are shown in Figure 5. For both music pleasantness and distinctness, a paired t-test was carried out between the baseline HR and 3 month HR ratings as well as between the 1 month HR 120 and 3 month HR 120 ratings. Results indicated a significant difference between the baseline HR and 3 month HR distinctness ratings. Therefore, the results within a strategy were not averaged across test sessions. A one-way ANOVA was used to test for differences between the results at each interval. Ratings differed significantly across intervals for pleasantness (F (3, 243) = 7.54, p < 0.001) and distinctness (F (3, 236) = 7.96, p < 0.001). Tukey post hoc comparisons of the four intervals showed significantly better performance with HR 120 at 3 months compared to HR at 3 months (pleasantness p < 0.001; distinctness p = 0.001) and better performance with HR 120 at 1 month than HR at 3 months (pleasantness p= 0.002; distinctness p < 0.001). In addition, group mean ratings for pleasantness with HR 120 at 3 months were higher than with baseline HR (p = 0.002). Individual data revealed that at the 3 month interval, S1 rated HR higher for both pleasantness and distinctness and S3 rated HR and HR 120 as equivalent. The other six subjects rated HR 120 higher for both pleasantness and distinctness.
Figure 5.

Group mean scores on the ratings of music pleasantness and musical instrument distinctness are shown for subjects when listening with HR (gray bars) and HR 120 (black bars) at four test intervals. Error bars represent 1 SE from the mean. Asterisks denote statistically significant differences in scores between strategies (* p < 0.05, ** p < 0.01, *** p < 0.001).
On the Iowa Sound Quality Test, average group ratings for the clarity of children’s voices, female voices, male voices, and environmental sounds showed no significant differences between HR and HR 120 at any of the test sessions. However, seven of eight subjects indicated an overall preference for HR 120 at the conclusion of the study. One subject did not have a preference between the two sound processing strategies.
DISCUSSION
Cochlear implant recipients recognize speech partly because stimulation of electrodes elicits different pitch percepts depending on the position of the electrode and/or the flow of current between electrode pairs relative to the neural tonotopic organization. The implementation of HR 120 is based on current steering between an electrode pair which increases the potential to deliver more precise spectral information to cochlear implant recipients. By steering the locus of stimulation, the total number of potential pitch percepts across the array is considerably greater than the number of electrode contacts. The increased number of places of stimulation along the electrode array purportedly provides an increase in the precision of frequency-to-place mapping, which may in turn result in improved quality and clarity of the perceived signal. The speech recognition results from this study indicated no difference in sentence recognition in quiet between HR and HR 120. A small but significant improvement, however, was seen in CNC word scores and scores for two of three sentence measures in noise (HINT +8 and BKB-SIN) with HR 120. The improvement for sentence recognition in noise is consistent with the findings of Brendel and colleagues (17) who reported a significant improvement with HR 120 for HMS German sentences with a single competing talker (+10 dB SNR) compared to HR. Our study results differ from those of Brendel and colleagues in that no significant differences in scores were found between the Auria processor and the Harmony processor for our study sample and test measures/conditions. Between the two studies, the sentence material, background noise and SNR differed; other information about the test conditions (e.g., stimulus level, listening condition) was not explicitly stated by Brendel and colleagues. On the music rating scales, the differences between group mean ratings with HR and HR 120 were statistically significant, both for pleasantness of music and distinctness of musical instruments.
The study findings and interviews with recipients confirm that we must continue to incorporate stimulus and test condition variables that more accurately assess real-world benefit in cochlear implant recipients, including music perception. Because of the great inter-subject variability in performance seen across cochlear implant users (18), there is a continued clinical need to evaluate the effects of sound processing strategies to determine how an individual benefits from their implant device. As previously indicated, speech recognition scores and music ratings with HR 120 were not higher for every subject. This is consistent with our knowledge of individual differences when patients listen with varied combinations of programming parameters. Previous work has shown that no specific processing strategy results in optimal performance for every patient (19–22).
In conclusion, HR 120 is an additional speech processing strategy that may further maximize patient performance. In this study sample, small but statistically significant improvements in speech recognition were noted with HR 120 compared to HR for words in quiet and sentences in noise as well as music ratings of pleasantness and instrument distinctness. HR 120 was preferred by seven of eight subjects for listening to speech and music in everyday life. Although the focus of cochlear implant performance has traditionally centered on speech recognition, everyday listening also includes music perception. We are encouraged by the music rating results in this study sample and the possibility that improvements in processing strategies, such as HR 120, may lead to enhanced music enjoyment for cochlear implant recipients.
Acknowledgments
This research was supported by Advanced Bionics Corporation (Valencia, California, USA). Manuscript preparation was partially supported by NIH NIDCD K23DC05410 (JBF). We wish to acknowledge Leo Litvak for assistance with Figure 1. We also thank our patients for their time and participation in this research study.
Footnotes
Portions of these data were presented at the 140th American Otological Society Meeting, San Diego, California, April 27, 2007.
Financial Disclosures
Jill B. Firszt and Laura K. Holden are Advisory Board Members for Advanced Bionics Corporation and Cochlear Corporation. Jill B. Firszt is a grant recipient of Advanced Bionics Corporation. Washington University receives the consulting fees and the grant award.
References
- 1.Koch DB, Osberger MJ, Segel P, et al. HiResolution and conventional sound processing in the HiResolution bionic ear: using appropriate outcome measures to assess speech recognition ability. Audiol Neurootol. 2004;9:214–23. doi: 10.1159/000078391. [DOI] [PubMed] [Google Scholar]
- 2.Townshend B, Cotter N, Van Compernolle D, et al. Pitch perception by cochlear implant subjects. J Acoust Soc Am. 1987;82:106–15. doi: 10.1121/1.395554. [DOI] [PubMed] [Google Scholar]
- 3.Wilson BS, Lawson DT, Zerbi M, et al. Recent developments with the CIS strategies. In: Hochmair-Desoyer IJ, Hochmair ES, editors. Advances in Cochlear Implants, Proceedings of the Third International Cochlear Implant Conference; Insbruck, Austria. April 1993; Vienna, Austria: Datenkonvertierung, Reproduction and Druck; 1994. pp. 103–12. [Google Scholar]
- 4.Donaldson GS, Kreft HA, Litvak L. Place-pitch discrimination of single-versus dual-electrode stimuli by cochlear implant users (L) J Acoust Soc Am. 2005;118:623–6. doi: 10.1121/1.1937362. [DOI] [PubMed] [Google Scholar]
- 5.Firszt JB, Koch DB, Downing M, et al. Current Steering Creates Additional Pitch Percepts in Adult Cochlear Implant Recipients. Otol Neurotol. 2007;28:629–36. doi: 10.1097/01.mao.0000281803.36574.bc. [DOI] [PubMed] [Google Scholar]
- 6.Nie K, Stickney G, Zeng FG. Encoding frequency modulation to improve cochlear implant performance in noise. IEEE Trans Biomed Eng. 2005;52:64–73. doi: 10.1109/TBME.2004.839799. [DOI] [PubMed] [Google Scholar]
- 7.Throckmorton CS, Selin Kucukoglu M, Remus JJ, et al. Acoustic model investigation of a multiple carrier frequency algorithm for encoding fine frequency structure: implications for cochlear implants. Hear Res. 2006;218:30–42. doi: 10.1016/j.heares.2006.03.020. [DOI] [PubMed] [Google Scholar]
- 8.Fishman KE, Shannon RV, Slattery WH. Speech recognition as a function of the number of electrodes used in the SPEAK cochlear implant speech processor. J Speech Lang Hear Res. 1997;40:1201–1215. doi: 10.1044/jslhr.4005.1201. [DOI] [PubMed] [Google Scholar]
- 9.Friesen LM, Shannon RV, Cruz RJ. Effects of stimulation rate on speech recognition with cochlear implants. Audiol Neurootol. 2005;10:169–184. doi: 10.1159/000084027. [DOI] [PubMed] [Google Scholar]
- 10.Peterson GE, Lehiste I. Revised CNC lists for auditory tests. J Speech Hear Disord. 1962;27:62–70. doi: 10.1044/jshd.2701.62. [DOI] [PubMed] [Google Scholar]
- 11.Soli S, Chang J, Vermiglio A, et al. Assessment of spatial unmasking and sound localization in bilateral implants using direct input. Conference on Implantable Auditory Prostheses; Pacific Grove, CA. 2005. [Google Scholar]
- 12.Nilsson M, Soli SD, Sullivan JA. Development of the Hearing in Noise Test for the measurement of speech reception thresholds in quiet and in noise. J Acoust Soc Am. 1994;95:1085–99. doi: 10.1121/1.408469. [DOI] [PubMed] [Google Scholar]
- 13.Lamel FL, Kassel RH, Seneff S. Speech database development: design and analysis of the acoustic phonetic corpus. In: Pols LCW, van Bezooijen R, editors. Speech input-output assessment and speech databases, ESCA tutorial and research workshop; Noordwijkerhout, the Netherlands. 1989. pp. 100–9. [Google Scholar]
- 14.Etymotic Research. BKB-SIN Speech-in-Noise Test, Version 1.03. Elk Grove Village, IL: 2005. [Google Scholar]
- 15.Killion MC, Villchur E. Kessler was right-partly: but SIN test shows some aids improve hearing in noise. Hear J. 1993;46:31–5. [Google Scholar]
- 16.Carhart R, Jerger J. Preferred method for clinical determination of pure tone thresholds. J Speech Hear Disord. 1959;24:330–45. [Google Scholar]
- 17.Brendel M, Buechner A, Krueger B, et al. Evaluation of the Harmony sound processor in combination with the speech coding strategy HiRes 120. Otol Neurotol. 2008;29:199–202. doi: 10.1097/mao.0b013e31816335c6. [DOI] [PubMed] [Google Scholar]
- 18.Firszt JB, Holden LK, Skinner MW, et al. Recognition of speech presented at soft to loud levels by adult cochlear implant recipients of three cochlear implant systems. Ear Hear. 2004;25:375–87. doi: 10.1097/01.aud.0000134552.22205.ee. [DOI] [PubMed] [Google Scholar]
- 19.Dunn CC, Tyler RS, Witt SA, et al. Effects of converting bilateral cochlear implant subjects to a strategy with increased rate and number of channels. Ann Otol Rhinol Laryngol. 2006;115:425–32. doi: 10.1177/000348940611500605. [DOI] [PubMed] [Google Scholar]
- 20.Holden LK, Skinner MW, Holden TA, et al. Effects of stimulation rate with the Nucleus 24 ACE speech coding strategy. Ear Hear. 2002;23:463–76. doi: 10.1097/00003446-200210000-00008. [DOI] [PubMed] [Google Scholar]
- 21.Skinner MW, Arndt PL, Staller SJ. Nudleus 24 advanced encoder conversion study: Performance vs. preference. Ear Hear. 2002;23:2S–17S. doi: 10.1097/00003446-200202001-00002. [DOI] [PubMed] [Google Scholar]
- 22.Vandali AE, Whitford LA, Plant KL, Clark BM. Speech perception as a function of electrical stimulation rate using the Nucleus 24 cochlear implant system. Ear Hear. 2000;21:608–624. doi: 10.1097/00003446-200012000-00008. [DOI] [PubMed] [Google Scholar]