

Abstract
Schizophrenia is often accompanied by disturbances in motor behavior thought to result from abnormalities in the brain’s timing mechanisms. Virtually all behavior has a motor component, and proper regulation of motor behavior is often dependent upon accurate registration of somatosensory input. This study utilizes the steady state evoked response (SSR), to quantify the accuracy of timing of the neocortical response to rapidly presented tactile somatosensory stimuli in patients with schizophrenia compared to control subjects. We used magnetic evoked fields and source space projection to estimate the time course of equivalent current sources in somatosensory cortex. Wavelet based time-frequency analysis was used to compute intertrial timing consistency and amplitudes. SSR’s in schizophrenic subjects demonstrated decreased performance in both metrics to contralateral 25 Hz tactile stimulation. Previous studies have reported similar abnormalities in the SSR in both auditory and visual domains. The magnetic SSR to tactile stimuli is thought to reflect activation of layer 3 pyramidal cells in primary sensory cortex, thus these findings, as in other sensory domains, are suggestive of impaired GABAergic inhibitory interneuronal control of the timing of pyramidal cell activity. This deficit may be intrinsic to neocortex, or might reflect as well impairment of cerebellar and/or thalamic involvement. These findings reinforce the notion that abnormalities in the brain’s timing mechanisms are a central component of the schizophrenia syndrome.
Keywords: Steady State response (SSR), magnetoencephalography (MEG), somatosensory, phase-locking
1. Introduction
Motor control abnormalities are prominent in schizophrenia. These range widely and include unusual or poorly coordinated motor behaviors observed in home movies of very young children who later develop schizophrenia (Walker and Lewine, 1990), abnormal motor behaviors and control seen in patients prior to and after development of the disorder (Tarrant and Jones, 1999), abnormal motor function on neuropsychological testing (Hoff et al., 1996), abnormal neurological soft signs (Krebs et al., 2000, Chan and Gottesman, 2008), and abnormal generation and/or processing and interpretation of the corollary discharge (efference copy) accompanying motor acts - believed essential for separation of thoughts and actions generated by self from those of other persons (Feinberg, 1978, Ford and Mathalon, 2004, Ford et al., 2008). Accuracy of all such motor behaviors is dependent in part upon accuracy of somatosensory feedback. Central to such accuracy is timing. Beta-band oscillations in the somatosensory cortex are synchronized with those in motor cortex and this is thought to be a possible mechanism for the mediation of corticomuscular coherence (see Baker, 2007 for a review). Inaccurate or noisy somatosensory feedback will likely result in impaired generation, coordination, and interpretation of motor behavior. While numerous studies have demonstrated abnormalities in somatosensory evoked potentials (Furlong et al., 1990, Shagass et al., 1978, Josiassen et al., 1988, Norra et al., 2004, Waberski et al., 2004) and evoked fields (Reite et al., 2003, Thoma et al., 2007, Huang et al., 2010) in schizophrenia, few have good time resolution or are able to postulate specific mechanisms.
Evoked potential/ evoked field studies involving neocortical driving using rapidly repeating stimuli which evoke a steady state response (SSR) are a metric that provides both high time resolution as well as a likely mechanism underlying their generation. The phase control of individual SSR components in auditory and visual domains has been suggested as being a representation of neocortical GABAergic activity of interneurons which control layer 3 pyramidal cell firing in the sensory cortex (McBain and Fisahn, 2001). In a study demonstrating increased corticomotoneuronal excitability in response to somatosensory stimulation (Kaelin-Lang et al., 2002), it was found that the GABAA receptor agonist Lorazepam blocked the effect whereas neither placebo nor dextromethorphan had any effect. The authors speculate that this pharmacologic modulation of the inhibitory cortical GABAergic neurotransmission system might explain the reduction in excitability and supports the general concept of GABAergic mediation of somatosensory cortex.
Intertrial phase control of the SSR response (termed phase locking factor or PLF) provides a high resolution measure of the accuracy of neocortical timing mechanisms, abnormalities in which have been previously found in both auditory and visual domains in schizophrenia (Teale et al., 2008, Brenner et al., 2009). In the auditory realm the stimuli are often 40 Hz click trains or tones amplitude modulated by 30 – 50 Hz sine waves. In the visual context stimuli may be light flashes or checkerboard alternation occurring in the 7 – 30 Hz range. In our case we utilized a tactile stimulation rate of 25 Hz, which was informed by a number of previous studies. The optimum frequency for vibrotactile steady state stimulation is probably somewhat variable by individual but several studies have demonstrated good SSR responses with frequencies in the medium to high beta range. Snyder (Snyder, 1995) found the best signal to noise ratio to be associated with 26 Hz stimulation using an 8 cm diameter mechanically shaken sphere which engaged all fingers and the palm. Tobimatsu and colleagues (Tobimatsu, et al., 1999) describe maximum response to 21 Hz oscillation using a 9 cm spherical shell, and Nangini and colleagues (Nangini et al., 2006) reported good results with finger stimulation using 22 Hz driving a bladder type stimulator with the right index finger. We performed several pilot studies utilizing our tactile stimulator and found the optimal SSR response at 25 Hz. This was done with three volunteers in our lab using stimulus rates from 10 to 100 Hz in steps of 5 Hz. All three subjects demonstrated maximal response at 25 Hz.
In this study we utilized the somatosensory SSR to tactile stimulation as a method to estimate somatosensory neocortical timing mechanisms central to motor control, a method, to our knowledge, not previously reported in schizophrenia. We hypothesized that the phase locking factor and related evoked amplitude would be diminished in subjects with schizophrenia as they have been in the other sensory modalities investigated to date.
2. Methods
2.1 Subjects
We studied 13 patients with schizophrenia (six female, mean age 46 ± 7). We compared their data with that of eighteen comparison subjects (8 female, mean age 40 ± 12). There was no statistically significant difference in age between the groups (t(30) = 1.6024, p = 0.1195). Diagnosis was determined using the Diagnostic and Statistical Manual of Mental Disorders, Fourth Edition (DSMIV-TR) (American Psychiatric Association, 2000) criteria based on structured diagnostic interviews; Structured Clinical Interview for DSMIV-TR, and Diagnostic Interview for Genetic Studies (SCID and DIGS) (First et al., 1995, Nurnberger et al., 1994), and information obtained from medical records. All subjects received a full explanation of the experimental procedures in accordance with the guidelines of the Colorado Multiple Institutional Review Board, and signed informed consent documents to that effect. All patients with schizophrenia were taking antipsychotic medications. Nine were taking only, atypicals, two were on typicals only (haloperidol, perphenazine), and two were taking both typicals and atypicals. Handedness was determined by the Annett Handedness Scale (Annett, 1985). Both groups were primarily right handed (mean control score 0.61, mean patient score 0.41). Table 1 below lists the psychotropic medications and their olanzapine equivalent dosage where available (Gardner et al., 2010).
Table 1.
Psychotropic Medications
| Subject | Psychotropic Medications | Olanzapine Equivalent (mg/day) |
|---|---|---|
| 1 | Clonazepam, Ziprasidone | 30 |
| 2 | Olanzapine | 20 |
| 3 | Clozapine, Risperidone | 30 |
| 4 | Aripiprazole | 3.4 |
| 5 | Alprazolam, Olanzapine, Sertraline | 20 |
| 6 | Aripiprazole, Haloperidol, Olanzapine, Sertraline | 53.4 |
| 7 | Clozapine | 12.5 |
| 8 | Clozapine, Fluphenazine | 21.7 |
| 9 | Perphenazine | 10 |
| 10 | Haloperidol | 30 |
| 11 | Clonazepam, Clozapine, Quetiapine | 8.1 |
| 12 | Clozapine, Risperidone | No Dosage Available |
| 13 | Risperidone | 10 |
2.2 Stimuli
Tactile stimuli delivered to the index finger tips of each hand were produced by a piezoelectrically operated Braille cell stimulator modified as appropriate for this application (METEC AG/TeleSensory Corp., Stuttgart, Germany). Eight piezoelectrically operated plastic rods (each 1.0 mm dia) were activated in unison covering an area of 4 × 9 mm. The cell was encased in a 6 mm thick acrylic box and a 12 mm ball end mill was used to create a finger-tip sized cutout over the rod array. The index finger of each hand was placed over this cutout and held in place by tape. Displacement of rods upon activation was about 1 mm without load. Tactile stimuli were delivered at 25 Hz in trains of 500 ms duration. Stimulus trains were repeated every 2.0 sec for at least 200 trials for each finger-tip. Each individual tactile stimulus consisted of the plastic rod ensemble compressing the skin for 20 msec followed by the rods withdrawal for 20 msec, thus there was, in addition to the tactile/pressure stimulus every 40 msec, a skin deformation stimulus every 20 msec or 50 Hz.
It should be noted that this device is capable of generating a capacitively coupled artifact unless proper shielding and grounding arrangements are made. We used a layer of copper foil around both the cell and the acrylic enclosure and a 12 gauge braided copper ground strap. The enclosed device is shown below in figure 1. Approximately midway through the experiment a failure in the outer shield and ground which went undetected for a few weeks produced a small frontal artifact which resulted in the rejection of four subjects with schizophrenia and seven normal control subjects.
Figure 1.
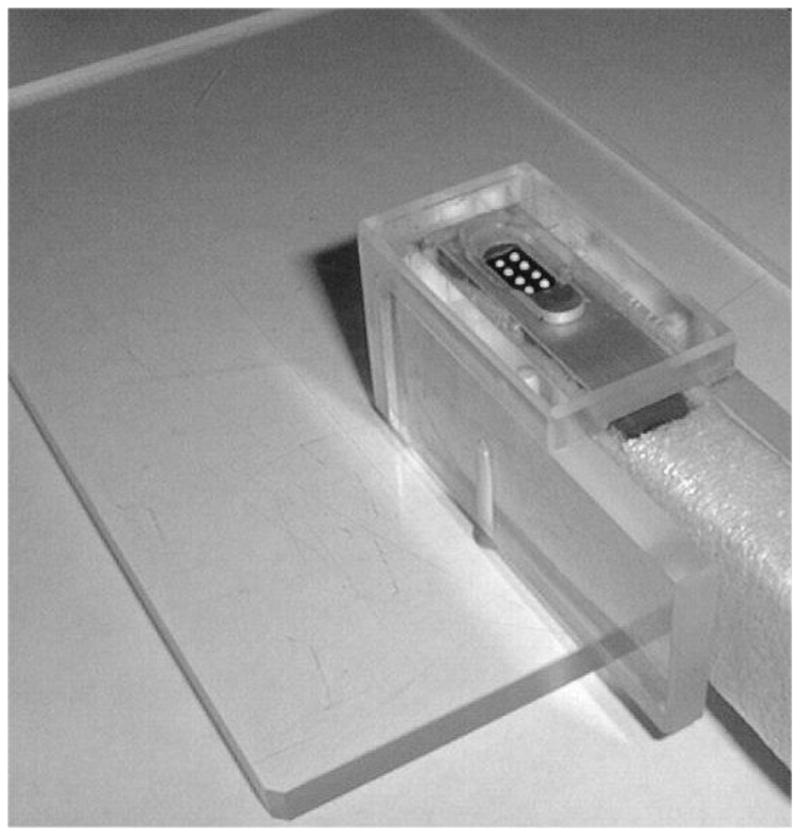
Braille Cell in Acrylic Housing with one layer Cu shielding. The foam layer around the cell helped to reduce sound transmission. A second layer of Cu shielding was applied over the acrylic after this photo was taken and a 12 gauge ground strap was connected between the unit and the MSR ground.
2.3 Magnetoencephalographic (MEG) Recording
Magnetic evoked fields were recorded in the supine position using a whole head neuromagnetometer (Magnes 3600 WH, 4D-Neuroimaging, San Diego, USA) while subjects watched a video movie with sound delivered by acoustically isolated (> 30 dB background attenuation, 125 – 8kHz) foam ear inserts. Data were acquired in epochs of 1000 ms duration with a 300 ms pre-stimulus baseline using a sampling rate of 678.17 Hz and an analog bandwidth of 0.1 to 200 Hz. The establishment of a head frame coordinate system (and the registration of the sensor coils within it) was accomplished by securing small coils to the skin surface near the three fiducial points (left and right pre-auricular and nasion) along with two additional coils located on the forehead. These coils were themselves registered in the head frame by digitizing their centers and the fiducial points using the Polhemus Fastrak 3 (Colchester, Vermont, USA) 3-D digitizer. At both the start and finish of MEG recording the coils were sequentially energized with a 165 Hz sine wave and their positions localized in the sensor frame. A transform matrix was then computed using these coordinates along with their Fastrak positions and the fiducial point Fastrak positions. In the head frame system the y-axis is determined by the left and right pre-auricular points (positive to the left), and the x-axis is determined as the line perpendicular to the midpoint between the pre-auriculars and contained in the plane determined by the y-axis and the nasion (positive to the front).
2.4 Data Analysis
Averaged, artifact free field data from each hemisphere were band-passed from 20 to 30 Hz and then modeled with a single moving dipolar source across the post-stimulus time window of 200 to 500 ms. A contour plot of a representative subject’s evoked field is shown below in figure 2.
Figure 2.

Iso-Field Plot of the Band-Passed (20 – 30 Hz) Averaged Data at Time Point 382 ms. This is a typical peak in the steady state region of the response to left finger stimulation. Black open circles are sensor coil locations. Gray scale units are in Tesla.
The location and strength parameters of the best fitting dipoles within 20 ms time bins were then averaged provided they met certain acceptance criteria, namely: goodness of fit greater than 0.9, anterior-posterior coordinate −5cm < x < 5 cm, absolute values of y (lateral) coordinates between 2 and 7 cm, and z (vertical) coordinate values between 3 and 10 cm (this would yield a maximum of 15 dipoles to average with a typical value of 14). These mean dipole locations, rq and mean source strength vectors, q(rq), were then used along with the pseudo inverse of the lead field (of a single equivalent current dipole in a conductive sphere), L−1(rq, r), to create a spatial filter weight matrix W(q(rq)) = L−1 (rq, r) • (q(rq)/|q(rq)|). The inner product of the original measured field and this weight matrix was then used to estimate the time course of the source strengths in each individual trial as: q(t) = B(r, t) • W(q(rq)), a procedure often referred to as source space projection (Ilmoniemi et al., 1987, Tesche et al., 1995). A major benefit of this process is the semi-normalization that is accomplished across individual subject measurements, i.e., the original measured field amplitudes which are very sensitive to the distance from the cortex to the sensor and hence dependent on subject head size and shape as well as positioning within the sensor array are combined to estimate a single value for the cortical source strength which is far more consistent from subject to subject. Figure 3 displays the reconstructed source q(t) derived from the same data set as the contour plot above.
Figure 3.

Mean source strength across time as determined using Source Space Projection on a typical subject’s evoked field data. Stimulus driving signal (square wave) displayed below to show timing relationship. First gray area starting at 20 ms and ending at 150 ms is the transient region and the second gray area starting at 200 ms and ending at 500 ms is the steady state window. The bandpass for this data is 0.1 to 200 Hz.
The individual source strength estimates, q(t), were then convolved with complex Morlet’s wavelets (wave # =7) in 1 Hz increments from 20 to 70 Hz. The modulus of the mean across trials of this convolution at each frequency and at each time point divided by the modulus of the convolution for each trial results in the so-called phase locking factor (PLF), a number whose value ranges from near zero for random phase trials, to one for completely synchronized trials (Talon-Baudry et al, 1996). This measure also has the advantage of inherent normalization with consequent improvement in data consistency from subject to subject. The amplitude envelope of the source strength at any frequency may be estimated by computing the modulus of the mean across trials of the convolution – hence it is sometimes described as complex demodulation. Both PLF and the source strength amplitude envelopes were computed. For statistical purposes we analyzed the responses at both 25 Hz (the driving frequency) and 50 Hz. We computed the mean phase locking factors and the mean evoked source strengths in two time windows: the “transient” evoked response which occurs in the window 20 to 150 ms post stimulus onset, and the steady state region from 200 to 500 ms post stimulus onset.
3. Results
A 2 × 2 mixed design Analysis of Variance (ANOVA) (group by hemisphere) was evaluated separately for evoked source strength and PLF for the transient and steady-state responses at both 25 Hz and 50 Hz.
3.1 Transient responses
For 25 Hz transient evoked source strength, a significant main effect of diagnosis (F(1,29) = 8.89, p = 0.006) indicated that the control group had higher source strengths than the schizophrenia group. The hemisphere and diagnosis by hemisphere interaction were non-significant. For PLF the schizophrenia group had significantly reduced values relative to controls, F(1, 29) = 12.61, p = 0.001. No other significant effects were observed. For the 50 Hz responses, no significant differences were observed for group, hemisphere or the group by hemisphere interaction for either evoked source strength or PLF. Overall the 25 Hz responses were of greater amplitude than the 50 Hz components.
3.2 Steady-state responses
For 25 Hz steady-state evoked source strength, a significant main effect of diagnosis (F(1,29) = 8.79, p = 0.006) indicated that the control group had higher source strengths than the schizophrenia group, similar to the transient window results. The hemisphere and diagnosis by hemisphere interaction were non-significant. For steady-state PLF the schizophrenia group had significantly reduced values relative to controls, F(1, 29) = 10.51, p = 0.003. Figures 4 and 5 show the PLF as a function of response time for both the right and left hemispheres respectively. There was also a significant main effect of hemisphere, F(1,29) = 5.34, p < 0.03, indicating higher phase-locking in the right, compared to the left, hemisphere. However, there was not a significant diagnosis by hemisphere interaction. For the 50 Hz steady-state responses, as with the 50 Hz transient responses, no significant differences were observed for group, hemisphere or the group by hemisphere interaction for either evoked source strength or PLF.
Figure 4.

Right hemisphere group mean phase locking factors as a function of response time. The solid line is that of the control group and the dashed line is that of the patients. Again the first gray area from 20 to 150 ms is the transient region and the second gray area is the steady state region.
Figure 5.
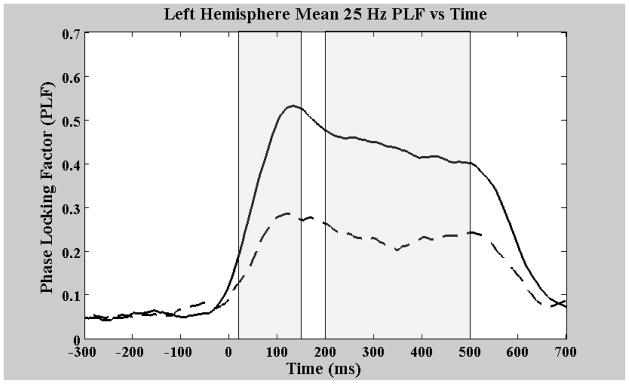
Left hemisphere group mean phase locking factors as a function of response time. The solid line is that of the control group and the dashed line is that of the patients. Again the first gray area from 20 to 150 ms is the transient region and the second gray area is the steady state region.
3.3 Medication effects
To test for possible medication effects Pearson correlations were computed between the olanzapine equivalents (Table 1) and the respective PLF’s for the schizophrenic subjects. There were no significant correlations between the olanzapine equivalents and any of the phase locking measures. Results were as follows: for the left hemisphere, the correlation between the olanzapine equivalents and the transient PLF was r(10) = −0.09, p = 0.37, and for the steady state PLF, r(10) = −0.23, p = 0.29. For the right hemisphere the correlation between the olanzapine equivalents and the transient PLF was r(10) = −0.24, p = 0.28, and for the steady state PLF, r(10) = −0.3, p = 0.23.
4. Discussion
In the schizophrenic group both transient and SSR responses at 25 Hz were of lower amplitude than in controls, and PLF’s were also significantly lower in both time windows. However, the 50 Hz component of the response was not significantly different between groups.
In the SSR region, PLF corresponds to the ability of neocortical pyramidal cells to consistently synchronize their firing across trials in response to the rapidly repeating tactile stimuli, a measure of timing accuracy of the neocortical driving response. The transient window occurs prior to the establishment of the driving (SSR) response, and may represent a measure of accuracy (variability) of the initial response to individual stimuli. Thus these measures suggest that, in schizophrenia, neocortical somatosensory cortex is less able to accurately reflect timing of incoming sensory stimuli. To the extent that somatosensory feedback is utilized to regulate motor behavior (Baker, 2007), this deficit may have implications for motor impairments in schizophrenia. Such impaired somatosensory timing could adversely influence accuracy and coordination of gross motor behaviors, which might help explain the observed impaired coordination of many motor actions in patients with schizophrenia. This may as well adversely influence the accuracy or interpretation of the corollary discharge, or efference copy generated by motor cortex in schizophrenia, and sent to somatosensory cortex. Sensory input resulting from such motor behavior is used to interpret the origin as external or self-generated. Misinterpretation might result in hallucinatory experience.
Magnetic evoked fields as reported here are thought to originate from equivalent (or averaged) current sources in neocortical layer 3 pyramidal cells (Murakami and Okada, 2006). The timing of pyramidal cell activation is modulated by GABAergic inhibitory interneurons, thus the MEG current sources are indirect measures of interneuron activity patterns, thus implicating abnormalities in the timing function of GABAergic inhibitory systems (Lewis et al., 2005, Gonzalez-Burgos et al., 2010). In all cases it seems likely that the neocortical driving response is the result of synchronized activity of neocortical layer 3 pyramidal cells acting as current sources generating the MEG sampled magnetic fields. These source currents are most likely the result of pyramidal cell dendritic ion flow (Murakami and Okada, 2006). Disrupted timing of SSR’s as reflected in the reduced PLF values (and corresponding averaged amplitudes) could be a cortex-wide deficit in schizophrenia due to abnormal GABAergic function, e.g., Muthukumaraswamy and colleagues have shown a correlation between cortical GABA concentration and MEG measured visual gamma band responses(Muthukumaraswamy et al., 2010). Another possibility is that GABA interneuron dysfunction is itself a consequence of hyper or hypo glutamatergic input, either through increased or decreased excitatory synaptic input or simply an abnormal precursor concentration (Moghaddam and Javitt, 2012).
These systems however reflect the activity of thalamo-cortical feedback loops, whose timing may well be modulated by cerebellar timing systems (Ivry et al., 2002). Somatosensory input may reach cerebellum prior to cortex (Tesche et al., 1997) and considering the major role of the cerebellum in motor timing, altered cerebellar regulation may be a significant determinant of timing of thalamo-cortical oscillatory mechanisms. Lacking direct evidence of cerebellar activation patterns, such relationships can only be speculative at this point, however recent reviews suggest disturbed cerebellum may be central to schizophrenia (Andreasen and Pierson, 2008).
All in all such findings are compatible with a disturbance in the origin and regulation of oscillatory mechanisms, and explanations for the physiological mechanism(s) underlying schizophrenia often invoke concepts of failed control or feedback between local and distributed neural circuits (e.g., see Uhlhaas and Singer (2006) for a review). In particular there may be a timing ‘jitter’ issue which prevents or reduces the synchronization of cortical neuronal assemblies perhaps linked to the activity of GABA neurons (Lewis, et al., 2005, Gonzalez-Burgos, et al., 2010). The methods of time-frequency analysis or spectral decomposition are well suited for processing SSR data (Roach and Mathalon, 2008), and the inter-trial phase coherence (Delorme and Makeig, 2004) or phase locking factor (PLF) (Talon-Baudry et al., 1996) can be used to quantify the degree of ‘jitter’ across trials.
Similar findings of decreased amplitude and lower PLF of the SSR in schizophrenia have also been described in both auditory and visual domains (see Brenner et al., 2009 for review). The 25 Hz frequency likely represents a combination of responses including both the initial tactile response to vertical depression of the skin, the changing of skin contour, and maintenance of pressure for 20 msec. We can make an estimate of the peripheral receptors involved in generating the responses we report. Peripheral receptors transmitting such tactile information likely involve both rapidly and slowly adapting Meissner corpuscle mechanoreceptors. Srinivasan and Lamotte (1987) recorded from single afferent fibers in the median and ulnar nerves of monkeys during tactile stimulation of the finger-tip with a plastic plate. They demonstrated that both rapidly and slowly adapting mechanoreceptors within and in the neighborhood of the contact respond during the ramp phase of vertical indentation, whereas only the slowly adapting mechanoreceptors respond when the force or depth of indentation was maintained as constant. It also appears that the slowly adapting Meissner corpuscle mechanoreceptors are primary conveyors of information about change in skin surface curvature. With our stimulus, skin contour change occurred at a frequency of 50 Hz, which may explain the origin of the 50 Hz component. The number of peripheral receptors activated and accordingly the density of sensory input to the brain is greater in auditory and visual domains when compared to somatosensory domains due to the nature of peripheral receptors. Since in the case of auditory SSR, stimuli are usually delivered at 40 Hz, (technically at the low end of the EEG “gamma” frequency range) auditory SSR findings have frequently been interpreted as a manifestation of “gamma band” abnormalities. However, it seems likely that the 40 Hz neocortical driving response is separate from the conceptualization of spontaneous cortical activity in the gamma band range (e.g. 40 to several hundred Hz) as a manifestation of stimulus binding and cortical information processing. This is likewise the case for piezoelectric steady-state stimulation, where the beta and gamma-band responses elicited may not be related to perceptual binding or other cognitive operations attributed to spontaneous or induced beta and gamma.
All of our patients were medicated and all but two were taking at least one atypical antipsychotic. The role of specific medications in influencing MEG based metrics of this type is unknown, although current thinking supports the concept that antipsychotic medications may serve to normalize otherwise disturbed function. We found no significant correlation between medication (as estimated using olanzapine equivalent doses) and the MEG phase locking factors.
In summary, these findings of impaired timing of the neocortical response to tactile stimulation further substantiate dysfunctional brain timing systems as being central to the schizophrenia syndromes, and may help explain the many deficits in motor behaviors found in schizophrenia,. Similar findings of decreased amplitude and lower PLF of the SSR in schizophrenia in both auditory and visual domains suggest the possibility that all sensory cortex has a similar timing impairment and/or that some common circuit element, e.g., the thalamus or the cerebellum may also be compromised.
Supplementary Material
Acknowledgments
This research was supported by USPHS Grant nos. MH47476 and RC1 MH 088623.
Footnotes
Publisher's Disclaimer: This is a PDF file of an unedited manuscript that has been accepted for publication. As a service to our customers we are providing this early version of the manuscript. The manuscript will undergo copyediting, typesetting, and review of the resulting proof before it is published in its final citable form. Please note that during the production process errors may be discovered which could affect the content, and all legal disclaimers that apply to the journal pertain.
References
- American Psychiatric Association. Diagnostic and Statistical Manual of Mental Disorders. 4. Washington, DC: American Psychiatric Association; 2000. Text Revision. [Google Scholar]
- Andreasen N, Pierson R. The role of the cerebellum in schizophrenia. Biological Psychiatry. 2008;64:81–88. doi: 10.1016/j.biopsych.2008.01.003. [DOI] [PMC free article] [PubMed] [Google Scholar]
- Annett M. Left, Right, hand and brain: The right shift theory. Lawrence Erlbaum Associates; Hillsdale NJ: 1985. [Google Scholar]
- Baker SN. Oscillatory interactions between sensorimotor cortex and the periphery. Current opinion in neurobiology. 2007;17:649–655. doi: 10.1016/j.conb.2008.01.007. [DOI] [PMC free article] [PubMed] [Google Scholar]
- Brenner CA, Krishnan GP, Vohs JL, Woo-Young A, Hetrick WP, Morzorati SL, O’Donnell BF. Steady state responses: Electrophysiological Assessment of sensory function in schizophrenia. Schizophrenia Bulletin. 2009;35:1065–1077. doi: 10.1093/schbul/sbp091. [DOI] [PMC free article] [PubMed] [Google Scholar]
- Chan RCK, Gottesman II. Neurological soft signs as candidate endophenotypes for schizophrenia: a shooting star or a northern star? Neuroscience and Behavioral Reviews. 2008;32:957–971. doi: 10.1016/j.neubiorev.2008.01.005. [DOI] [PubMed] [Google Scholar]
- Delorme A, Makeig S. EEGLAB: an open source toolbox for analysis of single-trial EEG dynamics including independent component analysis. Journal of Neuroscience Methods. 2004;134:9–21. doi: 10.1016/j.jneumeth.2003.10.009. [DOI] [PubMed] [Google Scholar]
- Feinberg I. Efference copy and corollary discharge implications for thinking and its disorders. Schizophrenia Bulletin. 1978;4:636–640. doi: 10.1093/schbul/4.4.636. [DOI] [PubMed] [Google Scholar]
- First MB, Spitzer RL, Gibbon M, Williams JBW. Structured Clinical Interview for DSM-IV Axis I Disorders, Patient Edition (SCID-P), version 2. New York State Psychiatric Institute, Biometrics Research; New York: 1995. [Google Scholar]
- Ford JM, Mathalon DH. Electrophysiological evidence of corollary discharge dysfunction in schizophrenia during talking and thinking. Journal of Psychiatric Research. 2004;38:37–46. doi: 10.1016/s0022-3956(03)00095-5. [DOI] [PubMed] [Google Scholar]
- Ford JM, Roach BJ, Faustman WO, Mathalon DH. Out-of-synch and out-of-sorts: dysfunction of motor-sensory communication in schizophrenia. Biological Psychiatry. 2008;63:736–743. doi: 10.1016/j.biopsych.2007.09.013. [DOI] [PMC free article] [PubMed] [Google Scholar]
- Furlong P, Barczak P, Hayes G, Harding G. Somatosensory evoked potentials in schizophrenia. A lateralization study. British Journal of Psychiatry. 1990;157:881–887. doi: 10.1192/bjp.157.6.881. [DOI] [PubMed] [Google Scholar]
- Gardner DM, Murphy AL, O’Donnell H, Centorrino F, Baldessarini RJ. International consensus study of antipsychotic dosing. American Journal of Psychiatry. 2010;167:686–693. doi: 10.1176/appi.ajp.2009.09060802. [DOI] [PubMed] [Google Scholar]
- Gonzalez-Burgos G, Hashimoto T, Lewis DA. Alterations of cortical GABA neurons and network oscillations in schizophrenia. Current Psychiatry Rep. 2010;2:335–344. doi: 10.1007/s11920-010-0124-8. [DOI] [PMC free article] [PubMed] [Google Scholar]
- Hoff AL, Harris D, Faustman WO, Beal M, DeVilliers D, Mone RD, Moses JA, Csernansky JG. A neuropsychological study of early onset schizophrenia. Schizophrenia Research. 1996;20:21–28. doi: 10.1016/0920-9964(95)00065-8. [DOI] [PubMed] [Google Scholar]
- Huang M, Lee RR, Gaa KM, Song T, Harrington DL, Loh C, Theilmann RJ. Somatosensory system deficits in schizophrenia revealed by MEG during a median-nerve oddball task. Brain Topography. 2010;23:82–104. doi: 10.1007/s10548-009-0122-5. [DOI] [PMC free article] [PubMed] [Google Scholar]
- Ilmoniemi RJ, Williamson SJ, Hostetler WE. Biomagnetism ’87. Tokyo: Denki University Press; 1987. New method for the study of spontaneous brain activity; pp. 182–185. [Google Scholar]
- Ivry RB, Spencer RM, Zelaznik HN, Diedrichsen J. The cerebellum and event timing. Annals New York Academy of Sciences. 2002;978:302–317. doi: 10.1111/j.1749-6632.2002.tb07576.x. [DOI] [PubMed] [Google Scholar]
- Josiassen RC, Shagass C, Roemer RA. Somatosensory evoked potential correlates of schizophrenic subtypes identified by the millon clinical multiaxial inventory. Psychiatry Research. 1988;23:209–219. doi: 10.1016/0165-1781(88)90011-x. [DOI] [PubMed] [Google Scholar]
- Kaelin-Lang A, Luft AR, Sawaki L, Burstein AH, Sohn YH, Cohen LG. Modulation of human corticomotor excitability by somatosensory input. Journal of Physiology. 2002;540(2):623–633. doi: 10.1113/jphysiol.2001.012801. [DOI] [PMC free article] [PubMed] [Google Scholar]
- Krebs M, Gut-Fayand A, Bourdel M, Dischamp J, Olie J. Validation and factorial structure of a standardized neurological examination assessing neurological soft signs in schizophrenia. Schizophrenic Research. 2000;45:245–260. doi: 10.1016/s0920-9964(99)00206-6. [DOI] [PubMed] [Google Scholar]
- Lewis DA, Hashimoto T, Volk DW. Cortical inhibitory neurons and schizophrenia. Nature Reviews/Neuroscience. 2005;6:312–324. doi: 10.1038/nrn1648. [DOI] [PubMed] [Google Scholar]
- McBain CJ, Fishan A. Interneurons unbound. Nature Reviews Neuroscience. 2001;2:11– 23. doi: 10.1038/35049047. [DOI] [PubMed] [Google Scholar]
- Moghaddam B, Javitt D. From revolution to evolution: the glutamate hypothesis of schizophrenia and its implication for treatment. Neuropsychopharmacology Reviews. 2012;37:4–15. doi: 10.1038/npp.2011.181. [DOI] [PMC free article] [PubMed] [Google Scholar]
- Murakami S, Okada Y. Contributions of principal neocortical neurons to magnetoencephalography and electroencephalography signals. Journal of Physiology. 2006;575(3):925–936. doi: 10.1113/jphysiol.2006.105379. [DOI] [PMC free article] [PubMed] [Google Scholar]
- Muthukumaraswamy SD, Edden RA, Jones DK, Swettenham JB, Singh KD. Resting GABA concentration predicts peak gamma frequency and fMRI amplitude in response to visual stimulation in humans. Proceedings of National Academy of Science USA. 2009;106:8356–8361. doi: 10.1073/pnas.0900728106. [DOI] [PMC free article] [PubMed] [Google Scholar]
- Nangini C, Ross B, Tam F, Graham SJ. Magnetoencephalographic study of vibrotactile evoked transient and steady-state responses in human somatosensory cortex. NeuroImage. 2006;33:252–262. doi: 10.1016/j.neuroimage.2006.05.045. [DOI] [PubMed] [Google Scholar]
- Norra C, Waberski TD, Kawohl W, Kunert HJ, Hock D, Gobbele R, Buchner H, Hoff P. High-frequency somatosensory thalamocortical oscillations and psychopathology in schizophrenia. Neuropsychobiology. 2004;49:71–80. doi: 10.1159/000076413. [DOI] [PubMed] [Google Scholar]
- Nurnberger JI, Blehar MC, Kaufmann CA, York-Cooler C, Simpson SG, Harkavy-Friedman J, Severe JB, Malaspina D, Reich T. Diagnostic Interview for Genetic Studies, Rationale, unique features, and training. Archives of General Psychiatry. 1994;51(11):849–859. doi: 10.1001/archpsyc.1994.03950110009002. [DOI] [PubMed] [Google Scholar]
- Reite ML, Teale PD, Rojas DC, Benkers TL, Carlson J. Anomalous somatosensory cortical localization in schizophrenia. Am J Psychiatry. 2003;160:2148–2153. doi: 10.1176/appi.ajp.160.12.2148. [DOI] [PubMed] [Google Scholar]
- Roach BJ, Mathalon DH. Event-related EEG time-frequency analysis: an overview of measures and an analysis of early gamma band phase locking in schizophrenia. Schizophrenia Bulletin. 2008;34(#5):907–926. doi: 10.1093/schbul/sbn093. [DOI] [PMC free article] [PubMed] [Google Scholar]
- Shagass C, Ornitz EM, Sutton S, Tueting P. Event related potentials and psychopathology. In: Callaway E, Tueting P, Koslow SH, editors. Event-Related Brain Potentials in Man. Academic Press; New York: 1978. p. 443. [Google Scholar]
- Snyder AZ. Steady-state vibration evoked potentials: description of technique and characterization of responses. Electroencephalography and clinical Neurophysiology. 1992;84:257–268. doi: 10.1016/0168-5597(92)90007-x. [DOI] [PubMed] [Google Scholar]
- Srinivasan MA, Lamotte RH. Tactile discrimination of shape: responses of slowly and rapidly adapting mechanoreceptive afferents to a step indented into the monkey finger pad, Journal of Neuroscience. 1987;7:1682–1697. doi: 10.1523/JNEUROSCI.07-06-01682.1987. [DOI] [PMC free article] [PubMed] [Google Scholar]
- Talon-Baudry C, Bertrand O, Delpuech C, Pernier J. Stimulus specificity of phase-locked and non-phase-locked 40 Hz visual responses in human. Journal of Neuroscience. 1996;16(13):4240–4249. doi: 10.1523/JNEUROSCI.16-13-04240.1996. [DOI] [PMC free article] [PubMed] [Google Scholar]
- Tarrant CJ, Jones PB. Precursors to schizophrenia: Do biological markers have specificity? The Canadian Journal of Psychiatry/La Revue canadienne de psychiatrie. 1999;44(4):335–349. doi: 10.1177/070674379904400403. [DOI] [PubMed] [Google Scholar]
- Teale PD, Collins D, Maharajh K, Rojas D, Kronberg E, Reite M. Cortical source estimates of gamma band amplitude and phase are different in schizophrenia. Neuroimage. 2008;42:1481–1489. doi: 10.1016/j.neuroimage.2008.06.020. [DOI] [PMC free article] [PubMed] [Google Scholar]
- Tesche CD, Uusitalo MA, Ilmoniemi RJ, Huotilainen M, Kajola M, Salonen O. Signal-space projections of MEG data characterize both distributed and well-localized neuronal sources. Electroencephalography And Clinical Neurophysiology. 1995;95:189–200. doi: 10.1016/0013-4694(95)00064-6. [DOI] [PubMed] [Google Scholar]
- Tesche CD, Karhu J. Somatosensory evoked magnetic fields arising from sources in the human cerebellum. Brain Research. 1997;744:23–31. doi: 10.1016/s0006-8993(96)01027-x. [DOI] [PubMed] [Google Scholar]
- Thoma RJ, Hanlon FM, Huang M, Miller GA, Moses SN, Weisend MP, Jones A, Paulson KM, Irwin J, Canive JM. Impaired secondary somatosensory gating in patients with schizophrenia. Psychiatry Research. 2007;151:189–199. doi: 10.1016/j.psychres.2006.10.011. [DOI] [PMC free article] [PubMed] [Google Scholar]
- Tobimatsu S, Zhang YM, Motohiro K. Steady-state vibration somatosensory evoked potentials: physiological characteristics and tuning function. Clinical Neurophysiology. 1999;110:1953–1958. doi: 10.1016/s1388-2457(99)00146-7. [DOI] [PubMed] [Google Scholar]
- Uhhaas PJ, Singer W. Neural synchrony in brain disorders: relevance for cognitive dysfunctions and pathophysiology. Neuron. 2006;52:155–168. doi: 10.1016/j.neuron.2006.09.020. [DOI] [PubMed] [Google Scholar]
- Waberski TD, Norra C, Kawohl W, Thyerlei D, Hock D, Klostermann F, Curio G, Buchner H, Hoff P, Gobbele R. Electrophysiological evidence for altered early cerebral somatosensory signal processing in schizophrenia. Pyschophysiology. 2004;41:361–366. doi: 10.1111/1469-8986.2004.00163.x. [DOI] [PubMed] [Google Scholar]
- Walker E, Lewine R. Prediction of adult-onset schizophrenia from childhood home movies of the patients. The American Journal of Psychiatry. 1990;147(8):1052–1056. doi: 10.1176/ajp.147.8.1052. [DOI] [PubMed] [Google Scholar]
Associated Data
This section collects any data citations, data availability statements, or supplementary materials included in this article.