

Abstract
Quantitation of neurons using stereologic approaches reduces bias and systematic error, but is time-consuming and labor-intensive. Accurate methods for quantifying neurons in vitro are lacking; conventional methodologies are limited in reliability and application. The morphological properties of the soma and neurites are a key aspect of neuronal phenotype and function, but the assays commonly used in such evaluations are beset with several methodological drawbacks. Herein we describe automated techniques to quantify the number and morphology of neurons (or any cell type, e.g., astrocytes) and their processes with high speed and accuracy. Neuronal quantification from brain tissue using a motorized stage system yielded results that were statistically comparable to those generated by stereology. The approach was then adapted for in vitro neuron and neurite outgrowth quantification. To determine the utility of our methods, rotenone was used as a neurotoxicant leading to morphological changes in neurons and cell death, astrocytic activation, and loss of neurites. Importantly, our technique counted about 8 times as many neurons in less than 5–10% of the time taken by manual stereological analysis.
Keywords: Neuroprotection, neurodegeneration, neurotoxicity, rotenone, neuron, neurites, morphology, quantification
INTRODUCTION
Neurons and glia are differentially affected by neurotoxins, neurodegenerative disease and multiple other insults, including trauma. Reliable and quantitative tools to measure neurodegeneration are needed, and the manual approaches currently used are insufficient. For neuronal analysis, it is not enough to just determine cell number; changes in cell morphology have been related to cell death and neurite quantification is also needed as neurodegeneration often begins in distal regions of the neuron.
Superficially, neuron counting would seem simple; however, the distribution of cells is not random and for this reason, stereological methods have been developed which do allow for accurate quantitation. The optical fractionator is generally accepted as the most efficient and accurate counting approach, combining the optical dissector with spatial sampling methods that are statistically optimized (West et al., 1991). This technique uses systematic random sampling (SRS) to generate unbiased data, but is extremely time-consuming.
In contrast to counting neurons within the exquisitely ordered structure(s) found in brain sections, neurons grown in culture are randomly organized and are not amenable to classic stereology. Accordingly, most investigators continue to utilize the traditional visual enumeration method, selecting representative fields of view and manually counting immunostained neurons (Caiazzo et al., 2011). It is possible to use flow cytometry to generate simple cell counts (Meyer et al., 1980) or tritium uptake to indirectly measure cell survival (Gao et al., 2011; Mytilineou and Cohen, 1984) but neither method allows the subtlety needed to define cell structure or health.
Chronic inflammation involving activated astroglia is a pathognomonic sign of many human diseases including neurodegenerative disorders. Astrocyte organization is regionally consistent and spatially distinct; however, morphology of individual cells may behave independently of region and can be considerably influenced by environmental factors (Bushong et al., 2003).
Specific morphologic changes such as cell elongation, cell shrinkage, condensation of chromatin, and changes in membrane morphology are consequence of cellular differentiation, cellular toxicity or pathology. In neurodegenerative disorders, cells undergoing apoptosis display typical morphological alterations (Mattson, 2000). Thus, alterations in cell structure are events of particular importance in the pathogenesis of neurodegenerative disorders and their quantitative assessment could be worthwhile for the development of effective new neuroprotective therapies.
Quantitative analysis of neurites is essential when studying factors influencing neuronal development (Brandt et al., 2007) and pathological changes related to neurodegeneration (Wu et al., 2010) or neuroprotection (He et al., 2009). The morphological properties of neurites comprise key aspects of neuronal phenotype and play essential roles in establishing neuronal network connectivity and information processing, and must therefore be measured. However, these methods tend to be manual and hence, time-consuming. Because neurons extend into space in all three dimensions, following a branching structure, a successful strategy for realistic tracing applications has to operate in 3D. In this regard, multiple different methods have been implemented with variable success (Zhang et al., 2007).
We have applied multiple dimension (XYZ) automated digital image collection methods to overcome the existing limitations for neuronal quantification and assessment of neurite morphometry. We have designed and engineered an efficient automated system using an upright microscope equipped with a linear encoded motorized stage capable of quickly scanning the entire surface of a specimen and assembling up to 400 images in 4 colors into a single high-resolution montage for analysis. Initial goals were to optimize system reliability and sensitivity enough to detect physiological changes in neurons and provide results at least comparable to stereology. For this study, we used rotenone, a pesticide and complex I inhibitor that induces degeneration of dopamine (DA) neurons in the substantia nigra (SN) of rat (Betarbet et al., 2000) and in primary neuronal cultures of ventral midbrain (Gao et al., 2011).
MATERIAL AND METHODS
Chemicals, reagents and other supplies
Chemicals and reagents were purchased as follows: Leibovitz L-15 medium, trypsin, neurobasal medium, B-27 supplement, fetal bovine serum, horse serum, L-glutamine, glutamax I, albumax I, Alexa Fluor 488, and 647 from Gibco (Invitrogen Life Technologies, Carlsbad, CA, USA). Minimum essential medium (MEM), sodium pyruvate, MEM non-essential amino acids, and penicillin-streptomycin were obtained from Mediatech Inc. (Cellgro, Manassas, VA, USA). Poly-D-lysine hydrobromide (PDL), sucrose, glucose, bisBenzimide H 33342 fluorochrometrihydrochloride, hydrogen peroxide (H2O2), dimethyl sulfoxide (DMSO), and 97.6% rotenone were acquired from Sigma Chemical Co. (St. Louis, MO, USA). Paraformaldehyde (PFA, 96%) was obtained from Acros Organics (New Jersey, NY, USA). Normal donkey serum and Cy3 secondary and biotin anti-mouse antibodies were ordered from Jackson ImmunoResearch labs, Inc. (West Grove, PA, USA). Phosphate buffered saline (PBS), Triton, glass coverslips, microscope cover glass, and microscope slides were obtained from Fisher Scientific (Pittsburgh, PA, USA). Vectastain avidin-biotin complex (ABC) kit, 3,3′-diaminobenzidine (DAB), and vectamount were acquired from Vector labs (Burlingame, CA, USA). Glial cell line derived neurotrophic factor (GDNF) was purchased from R&D Systems (Minneapolis, MN, USA). PFA (16%) was bought from Electron Microscopy Sciences (Hatfield, PA, USA). Miglyol 812N was obtained from Warner Graham (Baltimore, MD, USA). Magnesium chloride (MgCl2) was ordered from Ambion (Austin, TX, USA). Aquamount mounting media was acquired from Lerner labs (Pittsburgh, PA, USA). We used antibodies to mouse anti-microtubule associated protein 2 (MAP2), sheep anti-tyrosine hydroxylase (TH), mouse anti-TH, rabbit anti-glial fibrillary acidic protein (GFAP) obtained from Millipore (Billerica, MA, USA).
Animals
Six-month-old male Lewis rats that weighed 400–450 g were purchased from Hilltop Lab Animals, Inc. (Scottdale, PA, USA) and used for the in vivo experiments. For the in vitro study, 2- to 3-month-old female timed-pregnant Sprague-Dawley rats, shipped to our animal facility on day 14 or 15 of pregnancy, were obtained from Charles River Laboratories International, Inc. (Wilmington, MA, USA). Conventional diets and water were available ad libitum and the animals were maintained under standard conditions (in a 22 ± 1°C temperature-controlled room with 50–70% humidity) with a light-dark cycle of 12:12 hrs. The rats were randomly assigned to control and treatment groups. Housing and breeding of the animals and the experimental methods used in animal studies were approved by the Institutional Animal Care and Use Committee at the University of Pittsburgh and were carried out in accordance with published NIH guidelines.
Experimental design for neurotoxic treatment
For the in vivo experiments, rats were injected intraperitoneally with a dose of 3.0 mg/kg/day of rotenone (Cannon et al., 2009; Tapias et al., 2010); the solution was administered at 1 mL/kg. The neurotoxin rotenone was initially prepared as a 50x stock dissolved in 100% DMSO then diluted in Miglyol 812 N, a medium chain fatty acid. The control animals received an equivalent volume of the 2% DMSO + 98% Miglyol vehicle. The rats were randomized into 2 groups prior to rotenone administration. Each group was comprised of 5 animals.
For the in vitro experimental model, primary ventral midbrain cultures were prepared from embryonic day 17 (E17) rats; the embryos were obtained from 2 pregnant dams. Rotenone (50 nM) or vehicle was used to treat primary cell cultures for 5 days beginning on the fifth day in vitro (DIV 5). Rotenone was freshly prepared in DMSO and diluted to the final concentration in treatment medium. Ten days after seeding (DIV 10), the cultures were fixed and processed for subsequent analysis.
Histology and brain tissue processing
The experimental endpoint was established when a potentially debilitating phenotype for the animals was observed, i.e., when clear signs of akynesia, rigidity, and postural instability were evident. Rats were euthanized by decapitation following CO2 exposure at termination. The brains were carefully and quickly removed and fixed in 4% PFA in PBS for seven days and then cryoprotected in 30% sucrose in PBS for a minimum of 3 days until infiltration was complete. Next, brains were cut on a freezing sliding microtome into 35 μm transverse free-floating coronal sections, which were collected in 24 well-plates. Then, the sections were frozen in cryoprotectant (1 mL 0.1 M PO43− buffer, 600 g sucrose, 600 mL ethylene glycol, pH = 7.2) and maintained at −20°C until the subsequent DAB chromogen or immunofluorescent staining assays were performed.
Primary midbrain neuron cultures
Primary cells were prepared following a previously published protocol with some modifications (Gao et al., 2002). Ventral midbrain tissues were dissected from E17 Sprague-Dawley rat brains. After removal of the meninges, the pooled ventral midbrain tissues were dissociated by mild mechanical trituration and enzymatic digestion using trypsin. Cell viability and overall cell yield was evaluated using the trypan blue assay and a hemocytometer. Resuspended cells were seeded on circular coverslips pre-coated with PDL (0.1 mg/mL) in 24-well culture plates at a density of 5 × 10⁵/well. Cultures were maintained at 37°C in a humidified atmosphere of 5% CO2 and 95% air in 0.5 mL/well of MEM containing 2% heat-inactivated fetal bovine serum, 2% heat-inactivated horse serum, 1 g/L glucose, 2 mM L-glutamine, 1 mM sodium pyruvate, 100 μM non-essential amino acids, 50 U/mL penicillin, and 50 μg/mL streptomycin. Two days after the initial seeding, the culture medium was changed to 0.5 mL/well of fresh serum-free Neurobasal medium containing 2% B27 supplement, 2 mM glutamax I, 0.5 mg/mL albumax I, 50 U/mL penicillin, and 50 μg/mL streptomycin. Additionally, 50 ng/mL of GDNF per well was added to the cultures. Starting at DIV 5, the total treatment incubation time with rotenone or vehicle was 5 days (DIV 10). It was unnecessary to add an antimitotic agent to the cultures because astrocytes represented only a very small population of the cultures cells.
Immunohistochemistry
Brain sections were stored at −20°C in cryoprotectant. Six separate series of 35 μm coronal brain sections were obtained with a sliding microtome. Immunohistochemistry was performed as follows: for stereological counting, free-floating brain sections were rinsed in PBS 6 times for 10 min each to remove cryoprotectant. To block endogenous peroxidases, samples were incubated in 3% H2O2 in 0.3% Triton X-100/PBS for 30 min at room temperature (RT) followed by 3 washes in PBS. After blocking for 1 hr at RT with 10% normal serum with 0.3% Triton X-100/PBS solution, the sections were incubated in a primary antibody for mouse anti-TH (#MAB318, Millipore) for DA neuron labeling at a concentration of 1:3000 for 72 hrs at 4°C plus 1 hr at RT to obtain optimal antibody penetration. After 3 washes in PBS, the sections were incubated for 1 hr at RT in biotinylated secondary antibody (1:200; #81685, Jackson ImmunoResearch) diluted in PBS with 0.3% Triton X-100 and 1% blocking sera. The sections were rinsed in PBS 3 times and were subsequently incubated in a solution containing ABC at RT for 1 hr. Following three 10 min PBS washes, the reaction was developed using DAB as a chromogen for approximately 5 min. At the end of the DAB incubations, the sections were rinsed 3 times in PBS, mounted onto plus-coated slides, and coverslipped using vectamount. All incubations were carried out on a bench-top agitator.
For immunofluorescence labeling, selected sections (3–4 sections per well of a 6-well plate) were washed 3 times in PBS for 10 min and incubated with 1% Triton X-100 in PBS solution for 5 hrs at 4°C. Then, sections were rinsed in PBS (3 times for 10 min each) and blocked with 10% serum and a permeabilizing reagent (0.3% Triton X-100) in PBS solution for 30 min at RT. Subsequently sections were incubated for 72 hrs at 4°C with the following primary antibodies directed against the protein of interest, in the presence of 0.3% Triton X-100 to facilitate antibody access to the epitope: mouse monoclonal antibody for MAP2 (1:2000; #MAB378, Millipore), a cytoskeletal protein that binds to tubulin and stabilizes microtubules and is essential for the development and maintenance of neuronal morphology, was used for neuron staining. DA neurons were visualized by staining with a sheep polyclonal antibody for TH (1:2000; #AB1542, Millipore), the rate-limiting enzyme in DA synthesis. Rabbit polyclonal antibody stained for GFAP (1:2000; #AB5804, Millipore), a vimentin-type intermediate filament, which modulates the shape and motility of astrocyte cells. After an additional incubation in primary antibody solution for 1 hr at RT, the sections were rinsed in PBS (3 times for 10 min each) to remove unreacted primary antibodies and were then incubated with secondary antibodies: Cy3-conjugated anti-sheep antibody (1:500; #713-165-003, Jackson-ImmunoResearch), Alexa Fluor-conjugated 647 anti-mouse antibody (1:500; #A31571, Invitrogen), and 488-conjugated anti-rabbit antibody (1:500; #A21206, Invitrogen) for 2 hrs at RT. Tissue sections were then washed twice in PBS for 10 min and H 33342 (1:3000; #B2261, Sigma-Aldrich) reagent was used as a nuclear counterstain for 5 min at RT. Finally, after 3 PBS rinses for 10 min each, the sections were mounted onto plus-coated slides and coverslipped using aquamount mounting media.
Immunocytochemistry
At the end of the treatment period, cells were fixed in 4% PFA, 0.02% Triton, and 1 mM MgCl2 in PBS for 30 min. After three 10 min washes with PBS, the cells were incubated in blocking solution (10% normal serum in PBS) for 30 min at RT. Next, the cultures were exposed overnight at 4°C to the same primary antibodies and at equivalent concentrations in PBS with 1% normal serum that were used for immunofluorescence labeling in brain sections. Cells were rinsed 3 times in PBS for 10 min each and were incubated for 2 hrs with the same secondary antibodies described above for immunofluorescent staining of tissue sections at a 1:1000 concentration. Then, the cultures were rinsed once in PBS and were counterstained with H 33342 (1:3000) for 5 min at RT. Lastly, after 3 washes in PBS for 10 min, the cultures were mounted directly onto plus-coated slides and coverslipped using aquamount mounting media.
Unbiased stereology
The SN was outlined on the basis of TH immunolabeling, with reference to a coronal atlas of the rat brain (Paxinos and Watson, 1986). An unbiased quantification of TH-immunopositive cells was evaluated by stereological counts in the SN from one hemisphere, including pars compacta and pars reticulata, using the optical dissector method (West et al., 1991). Optical fractionator sampling was carried out on a Zeiss Axioskop 2 plus microscope hard-coupled to a MAC 5,000 controller module, a high-sensitivity 3CCD video camera system (CX 9000, MBF Biosciences), and a Pentium IV PC workstation. Sampling was implemented using the Stereo Investigator software package (MicroBrightField Inc; Williston, VT, USA).
Every sixth section through the entire SN in each animal was sampled and the start point – the first section containing SN – was determined individually for each brain. An average of 11 sections per animal was used for quantification. After delineation of the SN at low magnification (10X objective, N.A. 0.32), a sampling grid was overlaid onto the traced region and individual immunostained cell bodies were visualized using a 100X oil immersion objective (N.A. 1.4). The thickness of the sections was measured by focusing on the top of the section, setting the Z-axis to 0, and then refocusing to the bottom of the section and recording the actual thickness. Only the cells with a visible nucleus that were clearly TH-immunopositive were counted. Additionally, cells were only counted if they did not intersect with the lines of exclusion on the counting grid. The following parameters were set for cell counts: the counting frame was 45 × 45 × 13 μm (height × width × dissector height), the sampling grid was 125 × 125 μm, and a guard zone height of 5.4 μm was used with a sampling depth of 23.81 μm. Pilot studies were used to determine suitable counting frame and sampling grid parameters prior to counting, resulting in a rigorous estimate of nigral DA neurons. Stereological counts were coded and performed by an experimenter blinded to all surgical and treatment groups for each experiment. Note that the analyses of TH-immunoreactive profiles were restricted to the SN and thus excluded the ventral tegmental area. The coefficient of error (CE) Gunderson (m = 1) values were < 0.1 for all animals.
Motorized stage imaging analysis, cell counting (neurons and astrocytes), and cell morphology
The microscope used for these studies was an automated Nikon 90i upright fluorescence microscope equipped with 5 fluorescent channels (blue, green, red, far red and near IR), and high N.A. plan fluor/apochromat objectives. The studies described here were all performed using 20X objective (0.75 N.A.) for the in vivo or 10X objective (0.45 N.A.) for the in vitro experiments. Images were collected using Nikon NIS-Elements software and a Q-imaging Retiga cooled CCD camera. The stage was scanned using a Renishaw linear encoded microscope stage (Prior Electronics). For both in vivo and in vitro experiments, neuronal counting was performed by a single trained investigator. All slides were scanned under the same conditions for magnification, exposure time, lamp intensity and camera gain. Quantitative analysis was performed on fluorescent images generated in 4 fluorescent colors (stained for MAP2, TH+, GFAP and H 33342). Although the entire surface of the sample was quickly scanned for both in vivo and in vitro studies, the SN was delineated as an active ROI for the in vivo studies and the central region of the coverslip (excluding the edges to eliminate some cell aggregation and fluorescence saturation) was used for in vitro analysis (~75% of the total area).
For neuronal (MAP2 and TH+ neurons) and astrocyte (GFAP) counting, images were stitched with NIS-Elements, following background subtraction and thresholding for each individual channel. Then, colocalization and subsequent exclusion are necessary steps (for instruction see Movie S1). Notably, images acquired before (A 1–4 and B 1–4) and after thresholding (A 5–8 and B 5–8) are illustrated in Figure S1.
For in vivo DA quantitative assessments of morphological changes, widefield fluorescent images were acquired using a PlanApo 60X oil-immersion objective (1.45 N.A.) and the analysis in terms of shape and area was done using MetaMorph package. The shape factor value varies from 0 to 1, where 0 indicates a flattened object whereas 1 indicates a perfect circle. Selection of an appropriate background and shading correction as well as application of a median (smoothing) filter object minimize noise of the images, allowing for more accurate analysis of overall trends in elongation. Morphological quantitation in vitro could not be successfully performed because the particularly small size and resolution of the primary neuronal cultures at DIV 10 (including at 60X).
Neurite morphometry in vivo and in vitro
The same samples were also used to measure neuronal patterning and connections using the FilamentTracer module of Imaris (Bitplane), which facilitates 3D neuron reconstruction (see Movies S2 and S3). The Cy3 (TH) channel was utilized to evaluate in vivo DA neurite length, the number of segments, and the number of branches in the SN pars compacta brain region. A systematic region of interest (ROI) delineation, using a sampling grid (of 8 squares) which basically comprises the entire SNpc of the sample, was utilized for an unbiased neurite examination. However, due to the low percentage of DA neurons in cultures, the Cy5 (MAP2) channel was used to evaluate neurite morphometry in vitro. For unbiased analysis, a large area equivalent to two squares (comprised of 20 sub-squares each) was consistently selected in the center of the image. Each sub-square corresponds to 0.5 mm; thus the total area (A = XY) measured was determined to be 10 mm2. Afterwards, the only parameters that required manual introduction were the size and the length of the neurites. For parity, image assessment must use identical grid dimensions.
Data analysis
All data were expressed as mean values ± S.E.M. Differences between normally distributed means were evaluated by a one-tailed Student’s t-test for two group comparisons. Parametric one-way analysis of variance (ANOVA) with the Bonferroni post-hoc correction was performed to determine pairwise comparisons amongst multiple data sets. Statistical analysis was carried out using GraphPad Prism 5 software. For all tests, P < 0.05 was deemed significant.
RESULTS
Quantitative comparison of unbiased stereology to the motorized stage method
A key feature of the neuropathology of Parkinson’s disease (PD) is the loss of dopamine (DA) neurons in the substantia nigra (SN). Systemic administration of neurotoxins, such as rotenone, 6-OHDA or MPTP, induces degeneration of tyrosine hydroxylase-containing (TH+) cell bodies and processes (Betarbet et al., 2000; Kirik et al., 2000; Przedborski et al., 1996; Tapias et al., 2010). To evaluate the number of TH-immunopositive neurons and to study the pathophysiological changes after rotenone administration, SN sections from rat midbrain were immunostained for stereology using DAB as the chromagen for TH-immunoreactivity (Fig. 1). Low magnification (2X) (Fig. 1A, B, E and F), but especially higher magnification (10X) images of the dorsolateral region of SN, showed a robust decrease of cell bodies and processes after rotenone treatment (Fig. 1G and 1H) compared to untreated animals (Fig. 1C and 1D).
Figure 1.

Comparison of unbiased stereological neuron counts using the motorized stage method and stereology. Thirty-five μm coronal midbrain sections at the level of the SN were collected and processed for DAB staining. Representative micrographs at 2X magnification of TH-immunoreactive neurons in animals injected with vehicle (A and B) or treated with rotenone (E and F) are shown. Higher magnification (10X) provides a more precise appreciation of both the loss and fragmentation of TH+ neurons and their processes following rotenone administration (3.0 mg/kg/day) (G and H) when compared with vehicle-treated rats (C and D). Scale bar for low magnification images = 500 μm; scale bar for high magnification images = 50 μm. Serial sections from the brains used for DAB staining (A–H) were fluorescently immunolabelled and analyzed (at 20X) using the motorized stage approach. The sensitivity of this approach in assessing the phenotype of neurons and astrocytes is equivalent to or greater than the manual stereologic approach. For example, when comparing sections following rotenone treatment (J) as opposed to vehicle (I), there is a decrease in neuronal immunoreactivity (both MAP2 (J1 vs. I1) and TH+ (J2 vs. I2)) and increased astrogliosis (J3 vs. I3). Red: MAP2; green: TH; cyan blue: GFAP; navy blue: H 33342. Scale bar = 500 μm. For neuronal quantification (K), the total number of TH-immunopositive cell bodies was estimated in SN (both pars reticulata and pars compacta) by stereology (at 100X) and using the motorized stage method (at 20X) for comparison. For data acquisition, the optical fractionator was used for stereology and NIS-Elements software was employed for the motorized stage approach as described in the methods section. GFAP expression was examined utilizing the motorized stage setup to measure GFAP-positive astrocytes (L). Results are expressed as the mean ± S.E.M. of 5 rats per group. Note significant loss of SN neurons and astrocytosis in rotenone-treated rats compared to control animals.
For fluorescence microscopy, the same rat brains that were used for DAB staining were selected. Importantly, to allow for maximum comparison between both DAB and immunofluorescence staining, SN sections from adjacent wells were utilized. Images were acquired on an automated Nikon 90i widefield microscope equipped with a linear encoded motorized stage using a 20X dry objective. An antibody against MAP2, a somatodendritic marker that plays a key role in neuronal growth, plasticity and degeneration was used as a generic neuronal marker (red, Fig. 1 I1, J1). For selective DA neuron labeling, a TH antibody was utilized (green, Fig. 1 I2, J2). A GFAP antibody was used for detection of physiological modifications in astrocytes (cyan blue, Fig. 1 I3, J3). Finally, Hoescht 33342 – a membrane-permeable, adenine-thymine-specific fluorescent stain – was used to counterstain the nuclei of cells (navy blue, Fig. 1 I4, J4). Montaged micrographs revealed a substantial decrease in the number of cell bodies and processes, reduced staining intensity of MAP2 and TH+, and enhancement of the astroglial marker GFAP after rotenone exposure. The motorized stage method used here was readily able to detect toxin-induced physiological modifications (Fig. 1J 1–4) compared to vehicle treatment (Fig. 1I 1–4).
As a measure of the integrity of the midbrain nigrostriatal DA system, quantification of the number of TH-immunoreactive neurons was determined using both stereology and the motorized stage method (Fig. 1K). Our rotenone systemic treatment (3.0 mg/kg/d) results in a bilateral lesion to the nigrostriatal dopamine system and previous studies did not reveal any significant differences in the number of neurons between left- and right-hemisphere. Baseline values of DA neurons/hemisphere were virtually identical with the 2 techniques (22880 ± 1121 vs. 23670 ± 1143, stereology vs. motorized stage). Similarly, quantification of rotenone-induced cell loss showed no statistically significant differences between the methods (12820 ± 469 vs. 11590 ± 953, stereology vs. motorized stage). The numbers of TH+ cells that were actually counted per animal are provided in Table 1, while the estimates of the total number of TH+ cells per hemisphere are shown in Table 2. These data depict a rotenone-induced loss of 44–49% of DA neurons (P = 0.4131; stereology vs. motorized stage) consistent with a previous report using stereology (Cannon et al., 2009).
Table 1.
Number of TH-immunopositive neurons counted by stereology and by the motorized stage methodology in each individual SN per animal. For all, n = 5 rats for each treatment group (vehicle or rotenone).
| Animal | Stereology | Motorized stage | ||
|---|---|---|---|---|
|
| ||||
| Vehicle | Rotenone | Vehicle | Rotenone | |
|
| ||||
| #1 | 307 | 144 | 1818 | 1385 |
| #2 | 241 | 164 | 2061 | 1288 |
| #3 | 213 | 179 | 1953 | 1125 |
| #4 | 264 | 161 | 2098 | 1157 |
| #5 | 225 | 179 | 2343 | 995 |
Table 2.
The total number of TH+ neurons as calculated by stereology or by the motorized stage technique throughout the entire SN. Each treatment group (vehicle or rotenone) was comprised of 5 rats.
| Animal | Stereology | Motorized stage | ||
|---|---|---|---|---|
|
| ||||
| Vehicle | Rotenone | Vehicle | Rotenone | |
|
| ||||
| #1 | 23134 | 11785 | 21481 | 14341 |
| #2 | 20214 | 12737 | 26010 | 12933 |
| #3 | 20936 | 14335 | 20394 | 11699 |
| #4 | 26582 | 11932 | 25592 | 9462 |
| #5 | 23556 | 13321 | 24862 | 9529 |
In order to test whether our motorized stage system is capable of quantitating different cell types and additionally, to corroborate if it is sensitive enough to detect physiological alterations, GFAP-positive cells were also evaluated in nigral rat sections (1L); as depicted by the representative fluorescence images (I3 and J3), significant changes in the number of astrocytes were observed following rotenone exposure compared to the control group (32230 ± 2069 vs. 25500 ± 2042, respectively; P < 0.05). Table 3 shows the number of GFAP+ cells counted per animal; Table 4 illustrates the estimates of the total number of astrocytes per hemisphere. A ~30% increase above the control levels of GFAP was detected in the SN rotenone-treated rats.
Table 3.
Number of nigral GFAP counts using the motorized stage system. Each group contained 5 animals.
| Animal | Motorized stage
|
|
|---|---|---|
| Vehicle | Rotenone | |
|
| ||
| #1 | 1847 | 3027 |
| #2 | 2067 | 2607 |
| #3 | 2767 | 3292 |
| #4 | 2088 | 2480 |
| #5 | 1610 | 2512 |
Table 4.
Estimated total number of GFAP-positive cells in the SN. Astrocytic evaluation was carried out in 5 adult animals per group using the motorized stage technique.
| Animal | Motorized stage
|
|
|---|---|---|
| Vehicle | Rotenone | |
|
| ||
| #1 | 24674 | 35503 |
| #2 | 24124 | 33946 |
| #3 | 32554 | 37070 |
| #4 | 26184 | 27449 |
| #5 | 19969 | 27159 |
Importantly, in this proof-of-concept study, the motorized stage technique counted about 8 times as many neurons compared to the optical fractionator. Furthermore, if the average time per section for stereological counting cell number equals up to 1 hr (11 sections × 5 animals = 3300 min total) and the time per individual section taken for cell quantitation using the motorized stage approach is around 3 min (11 sections × 5 animals = 165 min total), around 1/10th–1/20th of the time required for stereology is needed for the motorized stage system.
Mathematical model for estimation of the total number of DA neurons
In the present paper, unbiased stereological estimation of the total number of cells (N) was evaluated using the optical fractionator method (West et al., 1991); to calculate the total number of cells using the motorized stage approach the same equations were applied but some modifications were introduced (Fig. 2A). The estimated total number of cells (N) is a multiplication between the cells counted (CN = ΣQ−) and the reciprocal of the volume fraction, which in turn, is a multiplication of three factors: (1) the area sampling fraction (ASF), (2) the height sampling fraction (HSF), and (3) the section sampling fraction (SSF). For stereology, the ΣQ− is equivalent to the number of counts made in the counting frame of the optical fractionator for each individual section, while for the motorized stage technique, it is the total number of neurons determined in the delineated ROI from the SN. The ASF is different depending on the assay: for stereology, ASF corresponds to the sampling grid area (XY) (μm2), i.e., the ratio between the counting frame area (XY) and the sampling grid area (XY) while for the motorized stage approach, the value equals 1 (the entire SN was analyzed). The stereological HSF value was calculated as the ratio between the dissector height (Z) (μm) and the mean section thickness (μm) of the tissue. However, due to the lack of an optical fractionator for the motorized stage system, we estimated the height of the cells (using MetaMorph software) relative to the thickness of the sample. The SSF, which corresponds to the section interval, remains unchanged for both techniques.
Figure 2.

Application of a mathematical model for estimation of cell counts. (A) Equations for the calculation of the total number of TH-immunopositive neurons (N) for both the stereological and motorized stage approaches. ΣQ− equals the number of cell counted; ASF is the area sampling fraction; HSF equates to the height sampling fraction; SSF is the section sampling fraction. (B) The coefficient of error (CE) was determined as the square of the total variance (Total Var) divided by the sum of the counted neurons (CN); VARSRS corresponds to the variance in the systematic random system where the m class can be either 0 or 1.
Coefficient of error determination for total neurons counted
The precision of the measures were expressed by the coefficient of error (CE), a measurement of random error introduced due to sampling, noise, counting, and measuring procedures (Fig. 2B). CE was assessed by a single-sample prediction formula developed initially by Matheron (Matheron, 1971) and further elaborated upon by Gundersen and Jensen (Gundersen and Jensen, 1987). The CE is calculated as the ratio between the square of the total variance and the total numbers of neurons counted (CE = √Total Var/CN). The variance of the total area is defined as the sum of the counted neurons (CN = Σi=1n·Q−) and the variance of the area in the systematic random sampling (VARSRS). In fact, these data give information on the sufficient section number required to obtain an appropriate variation for section samples. In the intersectional variability due to systematic random sampling, A is the sum of squares of all counts from all sections [Σi=1 (Q−i)2]; B is the sum of the product of the number of neurons counted in each section and the number of neurons counted in the next section [Σi−1 (Q−i · Q−i+1)]; and C is the sum of the products of counts in section i and the counts in section i+2 [Σi−1 (Q−i · Q−i+2)]. Hence, VARSRS = (3(A − CN) − 4B + C)/12), where α = 12 for a smoothness factor of 0 (m = 0) and VARSRS = (3(A − CN) − 4B + C)/240), where α = 240 for a smoothness factor of 1 (m = 1).
The empirical calculation of the CE (CE = S.E.M./mean) for the number of neurons was estimated for stereology (Table S1) and also for the motorized stage methodology (Table S2). The CE for GFAP+ cell counting using the motorized stage approach was also determined (Table S3). For all animals, CN, VARSRS, Total Var, and CE are shown. Data were estimated for m = 0 and m = 1 values for vehicle and rotenone-treated animals. CE values for the individual estimates for stereology ranged from 0.06–0.11 with an overall average of approximately 0.08 when m = 0, and a range from 0.06–0.08 with an overall average of approximately 0.07 when m = 1. However, although the variability of the CE is higher for motorized stage, ranging from 0.05–0.13, the overall average is practically the same (0.07) when m = 0; but, when the value was m = 1, both the variability of the CE (0.02–0.04) and the overall average (0.03) are significantly lower than the corresponding values for stereology, indicating a high degree of precision. The precision of the measure of the number of cells is related to the distribution and the homogeneity of the neurons along the sampling axis and is influenced by the number of sections employed. A total number of approximately 50 sections were obtained when serial 35 μm coronal brain sections were cut through the SN (−4.52 to −6.30 mm, bregma coordinates) according to the Paxinos and Watson atlas (Paxinos and Watson, 1986). Given that the average number of sections evaluated was 11, around 22% of the SN area was sampled for both methods.
In vitro fluorescence microscopy using the motorized stage setup
Representative photomicrographs from primary cultures are shown in Figure 3. It is noteworthy that our culture system using midbrain rat neurons increases the percentage of DA neurons to 5% at DIV 10, compared to published studies from other groups utilizing rat mesencephalic neuronglia cultures which contained ~1% (Chen et al., 2006; Zhang et al., 2006) or ~3% (Gao et al., 2002) of DA neurons at DIV 7. Beginning at DIV 5 after seeding, the cells were treated with 50 nM rotenone for 5 days and were fixed and labeled on in vitro day 10. The motorized stage method was used to acquire images from the entirety of single coverslips. Visualization of the images at original size (Fig. 3A and 3B) and at 10X zoom shows neurons (Fig. 3 A1 and B1 for MAP2; A2 and B2 for TH+), astrocytes (Fig. 3 A3 and B3) and nuclei (Fig. 3 A4 and B4).
Figure 3.
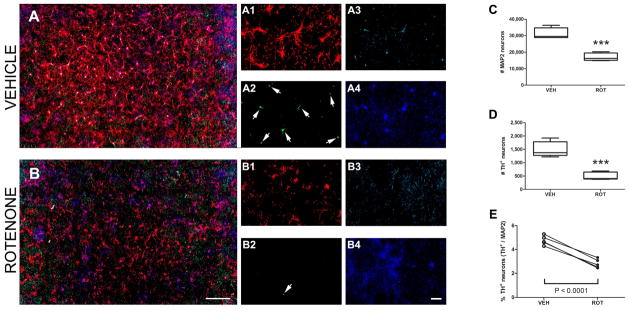
Motorized stage analysis in vitro. Primary ventral midbrain cultures from E17 rats were treated with 50 nM of rotenone at DIV 5 for a duration of 5 days. Representative scans from immunocytochemical preparations were acquired with a 10X objective and stitched together using NIS-Elements software. The low power/zoom image shows clear evidence of neuronal loss and increased astrogliosis following rotenone administration when compared to treatment with vehicle (A vs. B). Zooming in on these scanned fields shows physiological changes induced by rotenone: loss of neurons (A1 vs. B1 and A2 vs. B2 for MAP2 and TH+, respectively) and increased GFAP labeling (A3 vs. B3). MAP2 red; TH+ neurons green; GFAP cyan blue; and nuclei navy blue. Scale bar = 1000 μm (panels A, B); scale bar =200 μm (images 1–4). (C) Number of MAP2 neurons in vehicle (DMSO) versus rotenone-treated cells. (D) Quantification of TH-immunoreactive cells in both rotenone and vehicle groups. (E) Determination of the percentage of TH+ neurons, calculated as the ratio between TH-immunopositive cells and total number of neurons (MAP2). *** P < 0.0001, compared to vehicle, one-tailed Student’s t-test. The average of 5 independent experiments was obtained for cell counting, performed in n = 9–18 wells per experiment; data are expressed as mean ± S.E.M.
To quantify the number of neurons in midbrain primary cultures, counts were made using the motorized stage technique (see Movie S1). The total number of neurons was assessed as a colocalization of H 33342 and MAP2; DA neurons were determined when H 33342, MAP2 and TH+ colocalized. Following rotenone administration, the results revealed a decrease in the total number of neurons for MAP2 and, dramatically, for TH+ (Fig. 3C, 17070 ± 1040 vs. 31310 ± 1473; P < 0.0001 and Fig. 3D, 496 ± 63 vs. 1498 ± 127; P < 0.0001, respectively), with an overall reduction in the ratio of TH+ to MAP2 neurons (Fig. 3E, 2.81 ± 0.16 vs. 4.75 ± 0.17; P < 0.0001). Moreover, an inverse effect was detected for astrocytic GFAP expression. Data presented correspond to the average values obtained from 5 individual experiments per group, performed in n = 9–18 coverslips per experiment.
Quantitation of neuronal morphology
The structural changes elicited in TH+ neurons of rats are shown in Figure 4. Identical brain sections that were previously used for estimating the total number of neurons were assessed to determine cell (TH+) morphology. Images of the SNpc depicted a substantial variation in the morphology of neurons after chronic rotenone exposure, specifically in the shape of the TH-immunoreactive degenerating neurons (Fig. 4E and 4F) compared to control neurons (Fig. 4A and 4B). Zoomed-in views of neurons lead to a better appreciation of changes in cell shape in which rotenone-treated DA neurons appear elongated (Fig. 4C and 4D vs. 4G and 4H). For quantification, images were stitched using our motorized stage system and analyzed with MetaMorph; quantitative structural data at high magnification (60X) revealed a reduction in the ‘shape factor’ value of SN TH-immunoreactive neurons (Fig. 4I, ~48%; P = 0.0075). However, no statistically significant changes in the area of DA neurons were observed when comparing untreated and treated groups (Fig. 4J). These results suggest that rotenone causes DA neuron morphological alteration (and presumably functional impairment) prior to cell death.
Figure 4.

Alterations in DA neuron morphology in response to rotenone. Confocal micrographs (60X) of nigral sections stained for TH illustrate cell morphology in an untreated group (A and B) as compared to a rotenone-treated group (E and F). Zoomed images show distinct morphological changes after rotenone administration in terms of shape, leading to elongation (C and D vs. G and H). Neuron morphologic features were measured using MetaMorph software. For cell shape analysis, a shape factor of 1 represents a circular object while a 0 value indicates a straight line (I). Although degenerating TH-immunoreactive neurons undergo changes in shape factor, quantification of area does not show any significant variations (J).
Neurite morphometry
The earliest pathological feature of rotenone neurotoxicity is a loss of distal processes (Jiang et al., 2006). For the in vivo study, DA neurons from the SN pars compacta region (corresponding to the same rat brain sections utilized for neuron counting) were examined by focusing on the TH+ channel (Fig. 5A and 5B). Rotenone-treated rats exhibited a significant decrease in TH+ neurite length per neuron (Fig. 5C, 135 ± 14 vs. 213 ± 17 μm, P = 0.0079), number of neurite segments (Fig. 5D, 4 ± 0.5 vs. 7 ± 0.6, P = 0.0103) and in the number of branches (Fig. 5E, 1.8 ± 0.2 vs. 3.2 ± 0.3, P = 0.0093) compared to the vehicle group.
Figure 5.

Neurite morphometry in vivo. Identical sections used for neuron quantification were analyzed for neuronal filaments using Imaris software. TH+ labeling in control (A) and rotenone-treated (B) animals within the entire SN pars compacta reveals a significant decrease in neurite density. Neurites were pseudo-colored yellow, and DA neurons were labeled in red. Scale bar = 200 μm. Quantitative analysis of neurite outgrowth was carried out in 3 medial SN rat sections and data is provided for the sum length (C), number of segments (D), and number of branches (E) normalized to the number of neurons. Rotenone-induced DA toxicity caused significant morphological changes relative to controls. Five animals were imaged per group. The histogram values represent the mean ± S.E.M. Significant differences between groups were determined by one-tailed Student’s t-test. ** P = 0.0079, * P = 0.0103, ** P = 0.0093 respectively, compared to vehicle.
The same cultures examined for neuronal quantification were also used to assess the neurite architecture in vitro (Fig. 6). However, as midbrain cultures contain a low percentage of DA neurons and exhibit a heterogeneous spatial distribution of cells, quantification of DA neurite outgrowth is exceedingly difficult and could be inaccurate, impeding the possibility of creating a consistent sampling grid; thus, the MAP2 channel was used for overall neurite morphometry evaluation (Fig. 6A–D). Under control conditions, total neurite length was 95 ± 4 μm/neuron and was reduced by 17% to 79 ± 4 μm (Fig. 6E; P = 0.0306) following rotenone treatment. The numbers of neurite segments and branches were also adversely affected by rotenone, being reduced by 38% (P = 0.0040) and 40%, respectively (P = 0.0016) (Fig. 6F and 6G). These results reveal remarkable effects of rotenone even on surviving neurons.
Figure 6.
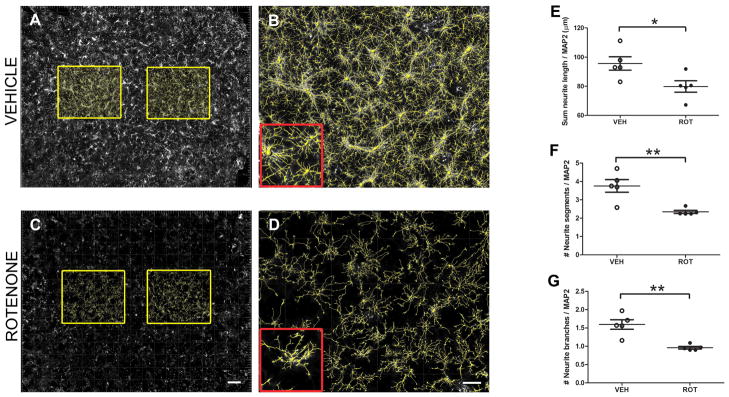
In vitro morphological quantification of neurites. The Imaris FilamentTracer module was used for assessment of neurite outgrowth in primary ventral midbrain cultures at DIV 10. Because of the low percentage of DA cells, the MAP2 channel was used for neurite analysis. To be unbiased, 2 squares (equivalent to the 15% of the total area of the coverslip) were selected in the center of the image (A and C). Dystrophic neurites were observed following rotenone administration compared to the vehicle-treated group, especially in zoomed in images (B and D). Scale bar in A and C, 500 μm; in B and D, 200 μm. Neurites were quantified in primary neuron cultures; equivalent to our in vivo findings, rotenone treatment induced extensive morphometric changes in neurites, leading to a 17% decrease in the sum of neurite length (E), 38% decline in the number of segments (F), and 40% reduction in the branching (G). The experiment was performed 5 times, using 3 coverslips per condition. A one-tailed Student’s t-test for comparison of two independent sets of data was performed. * P = 0.0306, ** P = 0.0040, ** P = 0.0016 respectively, compared to vehicle.
DISCUSSION
As described in the Neuron Doctrine, which was developed primarily by Cajal, a neuron is an anatomically and functionally individual cell unit, constituted by soma, axon, and neurites (Ramón y Cajal, 1988). Thus, for assessment of neuroprotection and/or neurotoxicity, neuronal structure (morphology) and counts, as well as quantification and morphometry of neurites are essential, albeit difficult.
Quantitative unbiased stereology has become the accepted method for post-hoc cell counting; however, it is extremely labor-intense. Here, we present novel automated techniques which are capable of analyzing approximately 8 times as many neurons in less than 5–10 percent of the time taken using the optical fractionator stereological method. We have modified the mathematical model utilized by West and colleagues (1991) to quantify features of interest, yielding results essentially identical to those obtained by stereology, in terms of the baseline number of DA neurons. The observed difference in the number of neuron counts between the motorized stage and stereology methods is accounted by the fact that the method developed here quantifies the entire surface of the study sample (i.e., SN) whereas the optical fractionator provides a systematic random sampling paradigm. Although we used guard zones in conformance with establish stereological methods, these are not necessary for the motorized stage setup; guard zones define the upper and lower limit of the sample in the Z-axis for the counting frame (West et al., 1991). It has been reported that because tissue shrinkage may influence the sample thickness, application of guard zones could be inconsistent (Carlo et al., 2010). The tissue processing methods (staining and mounting protocols) utilized for DAB and immunofluorescence procedures differ, and tissue shrinkage for immunofluorescence is not a significant issue. Moreover, our system does not utilize an optical fractionator but is not likely to provide redundancy in cell counting; the physical process of image collection with the stage scanning system by its very nature ensures that every object is only counted once. In the system described here, there is a 15% overlap between frames to ensure that nothing is missed; however, during the computer stitching of the frames, the overlaid regions are automatically removed such that there is not possibility of redundant (double) counts. Additionally, guard zones in the Z-axis are unnecessary as the images are collected in the middle of the section for each sample.
Although the method was exclusively applied in the SN brain region for cell estimation – specifically neurons and astrocytes – the motorized stage system is amenable and efficient for determination of quantification of any cell type, not only in several major brain areas (e.g. striatum, cortex, hippocampus, etc.) but also in sections from other tissues. Correspondingly, a wide range of cell cultures can be analyzed using our approach.
To avoid methodological sampling error, the precision of estimates was represented by the CE, which can be expressed by two different values: m = 0 and m = 1. Most biological tissues are a structural continuum without abrupt changes in structure, conventionally described by the m = 1 smoothing class (Gundersen et al., 1999). Thus, when the m = 1 class was utilized in our study, the CE was ~2.5–3-fold lower for samples examined by the motorized stage technique compared to stereology, demonstrating a high methodological accuracy. Furthermore, after analyzing about 22% of the total SN area, the small variation in CE between samples implies an improved degree of consistency with our motorized stage setup.
Cultured neurons grow, extend processes, and exhibit some of the standard characteristics of neurons in vivo. Because of a lack of sensitive tools to determine cell counts in vitro we propose that our motorized stage system is a comprehensive framework to analyze and quantify neurons in culture. Additionally, the motorized stage tool is capable of scanning the entire surface of the sample which greatly improves sensitivity and precision. Thus we were able to accurately and quickly estimate the number of TH-immunoreactive neurons following high resolution image acquisition using this novel approach.
Through our motorized stage setup, we were also able to determine the morphology of DA neurons in the entire SN in a single step procedure. This measurement revealed distinct abnormalities in both shape (elongation) and soma staining intensity, which suggests functional neuronal impairment prior to cell death in these animals. Interestingly, morphological changes, including reduced neuronal diameter, have been reported in nigral neurons from PD cases (Ma et al., 1996)
The neuronal network has adaptive properties, with synaptic plasticity occurring at both functional and structural levels (Bliss and Collingridge, 1993). Under pathological conditions, including Parkinson’s, Alzheimer’s, and Huntington’s disease, autism, and schizophrenia (Lepagnol-Bestel et al., 2008; Liu et al., 2001; Ma et al., 2011; Orr et al., 2008; Petratos et al., 2008), morphological changes in neurites are evident at early stages, before neuronal loss, and their analysis and quantitation provide insights into brain function, as well as sensitive tools to study neuroprotection and/or neurodegeneration. A considerable number of algorithms for neurite outgrowth reconstruction have been proposed. Stochastic segmentation and skeletonization algorithms were initially proposed (Cohen et al., 1994), but were subject to high noise due to artifactual surface irregularities in the image. Based on vectorial tracking methods, neurites can be detected by automatically calculating neurite seed points which are originally created by line searches over a coarse grid (Al-Kofahi et al., 2002; Zhang et al., 2007). Although the algorithms employed in vectorial tracking approaches are faster and more precise compared to those used in the skeletonization, they are unable to suitably identify centerlines in branched areas. Therefore, a proposed improved version of the algorithm accounted for discontinuities and curvatures in the boundaries (Al-Kofahi et al., 2003), but a significant number of inconspicuous faint neurites and a combination of an automated/manual approach remain important limitations.
Based on the fact that neurons extend spatially into all three dimensions analogous to a branching tree structure, a successful strategy for accurate tracing applications has to operate in 3D. An extension of the live-wire algorithm in 2D proposed by Meijering (Meijering et al., 2004) was adjusted for 3D semi-automated analysis (Zhang et al., 2008). In this technique, investigator needs to introduce a starting point; thereafter, the algorithm automatically selects the subsequent starting and ending points. Common software including Neurolucida, NeuronJ, and NeuriteIQ are only operative in 2D or use manual tracing, which is time-consuming and error-prone. The V3D-Neuron and more recently, the Simple Neurite Tracer applications, afford a semi-automatic neuron tracing in 3D (Longair et al., 2011; Peng et al., 2010); however, a starting point and successive points along the dendritic tree must be manually determined, which can be time-consuming. The Imaris tracing algorithm is an exploratory tracing system based on the concepts used in NeuronJ, but Bitplane extended it to work in 3D and further optimization for better centering and branch point placement (and diameter detection) was developed. Specifically, the Filament tracer package enables optional refinement of neurite skeleton using a deformable curve algorithm that fits the path as near as possible to the center of the image and may lead to an optimal work flow that estimates with major precision the radius of the traced neurite along this skeleton.
Therefore, because most manual or semi-automated measurements of neurite morphometry used to date are time-consuming, tedious, and potentially subject to observer bias, the process is potentially non-reproducible. To overcome these challenges, quantitative analyses of neuronal patterning and connections were performed in the same high resolution immunofluorescence images of rat SN sections and ventral midbrain cultures that were utilized and post-processed for neuronal quantification.
To study the sensitivity and utility of the motorized stage technique, the response to the neurotoxin rotenone was assessed. Previous studies have demonstrated that systemic administration of rotenone leads to neurodegeneration of the rat nigrostriatal system (Betarbet et al., 2000; Cannon et al., 2009) and also induces neuronal death in DA neuron-glia cultures from ventral midbrain (Gao et al., 2011). As expected, rotenone had a detrimental effect, reducing the number of DA neurons both in vivo and in vitro and causing shrinkage of neuronal processes. As noted, exposure to rotenone also induced significant nigral neuronal morphological changes. Moreover, while rotenone has previously been reported to cause microglial activation in vivo (Sherer et al., 2003), in this work, we have also demonstrated for the first time, a rotenone-associated astrocytosis. These levels correspond well to the mild increase of astrocytes observed in the brains of postmorten human specimens (Damier et al., 1993).
In summary, we report that our system, which combines readily available hardware and software, aptly overcomes many of the hurdles encountered in analyzing multidimensional tissues and cultures accurately and reliably. One of the most valuable features of the approach described here is that the precision of estimates made in distinct applications can be evaluated in a straightforward manner. In contrast to the majority of contemporary methods, which are unsuitable or cumbersome, we report a simple, fast and sensitive assay to quantify neurons – or any cell type – and their processes both in vitro and in vivo as well as to determine cell morphometry in vivo.
Supplementary Material
HIGHLIGHTS.
Herein we describe automated techniques to quantify the number and morphology of neurons (or any cell type, e.g., astrocytes) and their processes with high speed and accuracy.
We have modified a mathematical model to quantify features of interest.
Our system counted ~8 times as many neurons in less than 5–10% of the time taken by manual stereological analysis.
Accuracy and reliability, which hinder quantitative analysis, are surmounted.
Acknowledgments
Grant information: This work was supported by The JPB Foundation, NIH grants NS059806 and ES018058 (JTG), U54 RR022241 (SCW), and the American Parkinson Disease Association (JTG), and the Fulbright Commission, Ministry of Education and Science, Madrid, Spain (Fulbright Fellowship to VT). We would like to thank Xiaoping Hu for assistance with cell culture, Dr. Mastroberardino for his contributory commentaries, and Terina Martinez for editing early drafts of this manuscript.
Footnotes
Disclosure Statement
There are no actual or potential conflicts of interest, including any financial, personal or other relationships with people or organizations during the development of the work submitted.
Publisher's Disclaimer: This is a PDF file of an unedited manuscript that has been accepted for publication. As a service to our customers we are providing this early version of the manuscript. The manuscript will undergo copyediting, typesetting, and review of the resulting proof before it is published in its final citable form. Please note that during the production process errors may be discovered which could affect the content, and all legal disclaimers that apply to the journal pertain.
References
- Al-Kofahi KA, et al. Median-based robust algorithms for tracing neurons from noisy confocal microscope images. IEEE Trans Inf Technol Biomed. 2003;7:302–17. doi: 10.1109/titb.2003.816564. [DOI] [PubMed] [Google Scholar]
- Al-Kofahi KA, et al. Rapid automated three-dimensional tracing of neurons from confocal image stacks. IEEE Trans Inf Technol Biomed. 2002;6:171–87. doi: 10.1109/titb.2002.1006304. [DOI] [PubMed] [Google Scholar]
- Betarbet R, et al. Chronic systemic pesticide exposure reproduces features of Parkinson’s disease. Nat Neurosci. 2000;3:1301–6. doi: 10.1038/81834. [DOI] [PubMed] [Google Scholar]
- Bliss TV, Collingridge GL. A synaptic model of memory: long-term potentiation in the hippocampus. Nature. 1993;361:31–9. doi: 10.1038/361031a0. [DOI] [PubMed] [Google Scholar]
- Brandt N, et al. The neural EGF family member CALEB/NGC mediates dendritic tree and spine complexity. EMBO J. 2007;26:2371–86. doi: 10.1038/sj.emboj.7601680. [DOI] [PMC free article] [PubMed] [Google Scholar]
- Bushong EA, et al. Examination of the relationship between astrocyte morphology and laminar boundaries in the molecular layer of adult dentate gyrus. J Comp Neurol. 2003;462:241–51. doi: 10.1002/cne.10728. [DOI] [PubMed] [Google Scholar]
- Caiazzo M, et al. Direct generation of functional dopaminergic neurons from mouse and human fibroblasts. Nature. 2011;476:224–7. doi: 10.1038/nature10284. [DOI] [PubMed] [Google Scholar]
- Cannon JR, et al. A highly reproducible rotenone model of Parkinson’s disease. Neurobiol Dis. 2009;34:279–90. doi: 10.1016/j.nbd.2009.01.016. [DOI] [PMC free article] [PubMed] [Google Scholar]
- Carlo CN, et al. Comparative analyses of the neuron numbers and volumes of the amygdaloid complex in old and new world primates. J Comp Neurol. 2010;518:1176–98. doi: 10.1002/cne.22264. [DOI] [PubMed] [Google Scholar]
- Chen PS, et al. Valproate protects dopaminergic neurons in midbrain neuron/glia cultures by stimulating the release of neurotrophic factors from astrocytes. Mol Psychiatry. 2006;11:1116–25. doi: 10.1038/sj.mp.4001893. [DOI] [PubMed] [Google Scholar]
- Cohen AR, et al. Automated tracing and volume measurements of neurons from 3-D confocal fluorescence microscopy data. J Microsc. 1994;173:103–14. doi: 10.1111/j.1365-2818.1994.tb03433.x. [DOI] [PubMed] [Google Scholar]
- Damier P, et al. Glutathione peroxidase, glial cells and Parkinson’s disease. Neuroscience. 1993;52:1–6. doi: 10.1016/0306-4522(93)90175-f. [DOI] [PubMed] [Google Scholar]
- Gao HM, et al. Distinct role for microglia in rotenone-induced degeneration of dopaminergic neurons. J Neurosci. 2002;22:782–90. doi: 10.1523/JNEUROSCI.22-03-00782.2002. [DOI] [PMC free article] [PubMed] [Google Scholar]
- Gao HM, et al. HMGB1 acts on microglia Mac1 to mediate chronic neuroinflammation that drives progressive neurodegeneration. J Neurosci. 2011;31:1081–92. doi: 10.1523/JNEUROSCI.3732-10.2011. [DOI] [PMC free article] [PubMed] [Google Scholar]
- Gundersen HJ, Jensen EB. The efficiency of systematic sampling in stereology and its prediction. J Microsc. 1987;147:229–63. doi: 10.1111/j.1365-2818.1987.tb02837.x. [DOI] [PubMed] [Google Scholar]
- Gundersen HJ, et al. The efficiency of systematic sampling in stereology--reconsidered. J Microsc. 1999;193:199–211. doi: 10.1046/j.1365-2818.1999.00457.x. [DOI] [PubMed] [Google Scholar]
- He C, et al. Improved spatial learning performance of fat-1 mice is associated with enhanced neurogenesis and neuritogenesis by docosahexaenoic acid. Proc Natl Acad Sci U S A. 2009;106:11370–5. doi: 10.1073/pnas.0904835106. [DOI] [PMC free article] [PubMed] [Google Scholar]
- Jiang Q, et al. Activation of group III metabotropic glutamate receptors attenuates rotenone toxicity on dopaminergic neurons through a microtubule-dependent mechanism. J Neurosci. 2006;26:4318–28. doi: 10.1523/JNEUROSCI.0118-06.2006. [DOI] [PMC free article] [PubMed] [Google Scholar]
- Kirik D, et al. Long-term rAAV-mediated gene transfer of GDNF in the rat Parkinson’s model: intrastriatal but not intranigral transduction promotes functional regeneration in the lesioned nigrostriatal system. J Neurosci. 2000;20:4686–700. doi: 10.1523/JNEUROSCI.20-12-04686.2000. [DOI] [PMC free article] [PubMed] [Google Scholar]
- Lepagnol-Bestel AM, et al. SLC25A12 expression is associated with neurite outgrowth and is upregulated in the prefrontal cortex of autistic subjects. Mol Psychiatry. 2008;13:385–97. doi: 10.1038/sj.mp.4002120. [DOI] [PubMed] [Google Scholar]
- Liu J, et al. Prosaptide D5, a retro-inverso 11-mer peptidomimetic, rescued dopaminergic neurons in a model of Parkinson’s disease. FASEB J. 2001;15:1080–2. doi: 10.1096/fj.00-0603fje. [DOI] [PubMed] [Google Scholar]
- Longair MH, et al. Simple Neurite Tracer: open source software for reconstruction, visualization and analysis of neuronal processes. Bioinformatics. 2011;27:2453–4. doi: 10.1093/bioinformatics/btr390. [DOI] [PubMed] [Google Scholar]
- Ma SY, et al. A quantitative morphometrical study of neuron degeneration in the substantia nigra in Parkinson’s disease. J Neurol Sci. 1996;140:40–5. doi: 10.1016/0022-510x(96)00069-x. [DOI] [PubMed] [Google Scholar]
- Ma X, et al. Dysbindin-1, a schizophrenia-related protein, facilitates neurite outgrowth by promoting the transcriptional activity of p53. Mol Psychiatry. 2011;16:1105–16. doi: 10.1038/mp.2011.43. [DOI] [PubMed] [Google Scholar]
- Matheron G. Les cahiers du centre de morphologie mathématique, Vol. 5. École nationale supérieure des mines de Paris. 1971. The theory of regionalized variables and its applications; p. 211. [Google Scholar]
- Mattson MP. Apoptosis in neurodegenerative disorders. Nat Rev Mol Cell Biol. 2000;1:120–9. doi: 10.1038/35040009. [DOI] [PubMed] [Google Scholar]
- Meijering E, et al. Design and validation of a tool for neurite tracing and analysis in fluorescence microscopy images. Cytometry A. 2004;58:167–76. doi: 10.1002/cyto.a.20022. [DOI] [PubMed] [Google Scholar]
- Meyer RA, et al. Flow cytometry of isolated cells from the brain. Anal Quant Cytol. 1980;2:66–74. [PubMed] [Google Scholar]
- Mytilineou C, Cohen G. 1-methyl-4-phenyl-1,2,3,6-tetrahydropyridine destroys dopamine neurons in explants of rat embryo mesencephalon. Science. 1984;225:529–31. doi: 10.1126/science.6610939. [DOI] [PubMed] [Google Scholar]
- Orr AL, et al. Sex-dependent effect of BAG1 in ameliorating motor deficits of Huntington disease transgenic mice. J Biol Chem. 2008;283:16027–36. doi: 10.1074/jbc.M710606200. [DOI] [PMC free article] [PubMed] [Google Scholar]
- Paxinos G, Watson C. The rat brain in stereotaxic coordinates. Academic Press; London: 1986. [DOI] [PubMed] [Google Scholar]
- Peng H, et al. V3D enables real-time 3D visualization and quantitative analysis of large-scale biological image data sets. Nat Biotechnol. 2010;28:348–53. doi: 10.1038/nbt.1612. [DOI] [PMC free article] [PubMed] [Google Scholar]
- Petratos S, et al. The beta-amyloid protein of Alzheimer’s disease increases neuronal CRMP-2 phosphorylation by a Rho-GTP mechanism. Brain. 2008;131:90–108. doi: 10.1093/brain/awm260. [DOI] [PubMed] [Google Scholar]
- Przedborski S, et al. Role of neuronal nitric oxide in 1-methyl-4-phenyl-1,2,3,6-tetrahydropyridine (MPTP)-induced dopaminergic neurotoxicity. Proc Natl Acad Sci U S A. 1996;93:4565–71. doi: 10.1073/pnas.93.10.4565. [DOI] [PMC free article] [PubMed] [Google Scholar]
- Ramón y Cajal S. Estructura de los centros nerviosos de las aves. Revista Trimestal de Histología normal y patológica. 1988;1:1–10. [Google Scholar]
- Sherer TB, et al. Selective microglial activation in the rat rotenone model of Parkinson’s disease. Neurosci Lett. 2003;341:87–90. doi: 10.1016/s0304-3940(03)00172-1. [DOI] [PubMed] [Google Scholar]
- Tapias V, et al. Melatonin treatment potentiates neurodegeneration in a rat rotenone Parkinson’s disease model. J Neurosci Res. 2010;88:420–7. doi: 10.1002/jnr.22201. [DOI] [PubMed] [Google Scholar]
- West MJ, et al. Unbiased stereological estimation of the total number of neurons in the subdivisions of the rat hippocampus using the optical fractionator. Anat Rec. 1991;231:482–97. doi: 10.1002/ar.1092310411. [DOI] [PubMed] [Google Scholar]
- Wu HY, et al. Amyloid beta induces the morphological neurodegenerative triad of spine loss, dendritic simplification, and neuritic dystrophies through calcineurin activation. J Neurosci. 2010;30:2636–49. doi: 10.1523/JNEUROSCI.4456-09.2010. [DOI] [PMC free article] [PubMed] [Google Scholar]
- Zhang W, et al. 3-Hydroxymorphinan, a metabolite of dextromethorphan, protects nigrostriatal pathway against MPTP-elicited damage both in vivo and in vitro. FASEB J. 2006;20:2496–511. doi: 10.1096/fj.06-6006com. [DOI] [PubMed] [Google Scholar]
- Zhang Y, et al. A novel tracing algorithm for high throughput imaging Screening of neuron-based assays. J Neurosci Methods. 2007;160:149–62. doi: 10.1016/j.jneumeth.2006.07.028. [DOI] [PubMed] [Google Scholar]
- Zhang Y, et al. 3D Axon structure extraction and analysis in confocal fluorescence microscopy images. Neural Comput. 2008;20:1899–927. doi: 10.1162/neco.2008.05-07-519. [DOI] [PMC free article] [PubMed] [Google Scholar]
Associated Data
This section collects any data citations, data availability statements, or supplementary materials included in this article.