Abstract
An elderly man with a recent diagnosis of invasive rectal adenocarcinoma was admitted to the hospital because of a lower gastrointestinal bleeding and low haemoglobin. During the hospitalisation he complained of chest pain. ECG showed new onset ST-segment elevation in leads III, aVF and in the precordial leads V1–V4. Shortly thereafter, he became hypotensive and coded. Despite resuscitation he passed away. Autopsy revealed massive pulmonary emboli with near complete obstruction of the involved branches of the pulmonary arteries. Coronary arteries were free of significant coronary artery disease and multiple sections of the myocardium showed the absence of myocardial infarction.
Background
Pulmonary embolism (PE) is a common and potentially lethal condition. Despite multiple ECG findings described in association with PE, ST-segment elevation remains rare and represents a diagnostic challenge to differentiate it from acute myocardial infarction.
Case presentation
An elderly man with a recent diagnosis of invasive rectal adenocarcinoma, who was receiving chemotherapy and radiotherapy, was admitted to the hospital because of a lower gastrointestinal (GI) bleeding and low haemoglobin (Hb). He had a remote smoking history and family history of thyroid and prostate cancer. Upon presentation vital signs were stable and physical examination was normal except for pallor and cachexia. The patient received blood transfusion with improvement of his Hb. During the hospital stay he complained of a non-radiating retrosternal chest pain. ECG was performed and shortly thereafter, he became hypotensive and coded. Despite resuscitation he passed away.
Investigations
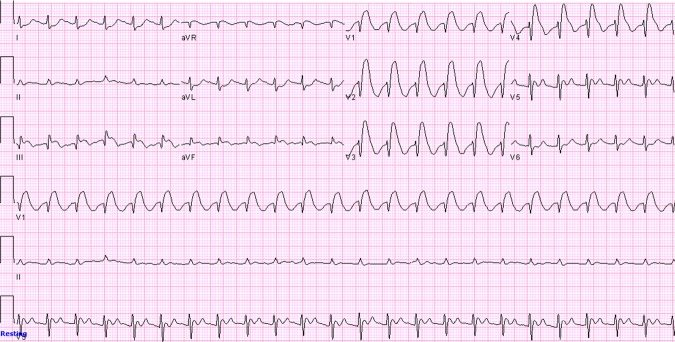
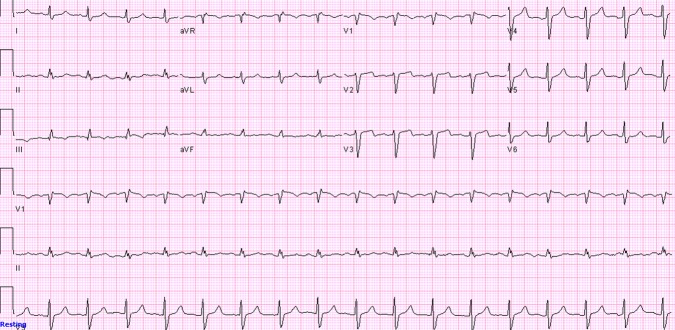
Blood count was significant for anaemia with Hb of 8 g/dl. Metabolic panel was normal except for creatinine of 1.5 mg/dl but potassium level was normal. Chest x-ray which was done 2 h prior to the code was normal. ECG just before the code showed sinus tachycardia with ST-segment elevation in leads III, aVF and in precordial leads V1–V4 with reciprocal ST-segment depression in leads I and aVL (figure 1) which was new when compared to the admission ECG (Figure 2).
Figure 1.

ECG showing sinus tachycardia with ST-segment elevation in leads III, aVF and in precordial leads V1–V4 with reciprocal ST-segment depression in leads I and aVL.
Figure 2.

Initial ECG upon admission showing normal sinus rhythm with no ST-segment elevation.
Differential diagnosis
The clinical presentation of chest pain with a new onset ST-segment elevation on the ECG was suggestive of an acute myocardial infarction although ascending aortic dissection with extension into the right coronary artery can present similarly. Prinzmetal's angina can present with chest pain and acute ST-segment elevation as well during the chest pain episode owing to transient coronary vasospasm. Stage one of pericarditis can present with ST-segment elevation but the pattern of ST-segment elevation is diffuse, rarely exceeds 5 mm, begins at the J point and retains its normal concavity with characteristic PR segment changes. Hyperkalaemia can give pseudoinfarct pattern on ECG but the patient's potassium was normal.
ST-segment elevation on ECG can be associated with early repolarisation, left ventricular hypertrophy, Brugada syndrome and left ventricular aneurysm, but these ST-segment changes were not present upon the admission ECG.1
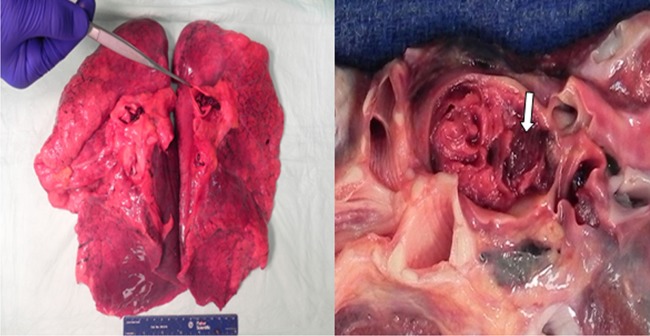
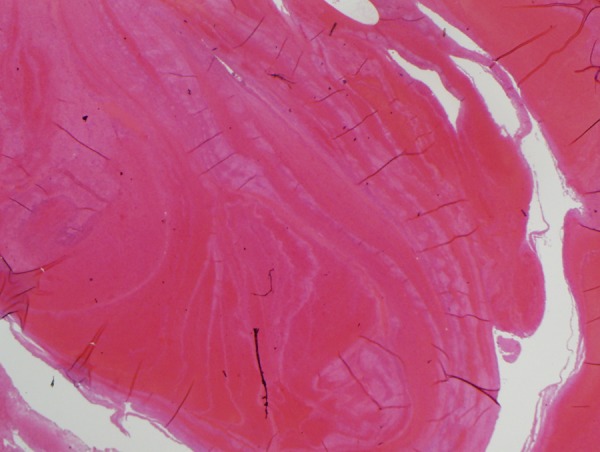
Upon autopsy, cardiac examination showed mild cardiomegaly. Coronary arteries showed small amount of atherosclerosis but they were free of significant coronary artery disease. Multiple sections of the myocardium showed no evidence of myocardial infarction. No evidence of atrial septal defect (ASD) or patent foramen ovale (PFO) was found. Autopsy of the lung showed massive bilateral pulmonary emboli with near-complete obstruction of the involved branches of the pulmonary arteries, microscopic examination of the clots showed lines of Zhan (Figures 3 and 4).
Figure 3.

Lung autopsy showing one of the pulmonary emboli—‘Arrow’.
Figure 4.

Microscopic examination of the clot showing lines of Zahn (H&E stain).
Treatment
The patient was coded. Thrombolytic therapy was not given because of the patient's lower GI bleeding.
Discussion
PE is a common and potentially lethal condition. The clinical presentation ranges from just dyspnoea or chest pain to shock. Occasionally, PE can be asymptomatic and discovered accidently on an imaging study. The mortality rate is variable depending upon the clinical presentation and can be high up to 60% in massive PE. Massive PE is associated with haemodynamic instability defined as systolic blood pressure less than 90 mm Hg or a pressure drop of more than 40 mm Hg for at least 15 min in the absence of other causes of hypotension.2 3
PE can be associated with ECG changes which were first described by McGinn and White in 1935. They described the classic S1Q3T3 pattern in association with acute cor pulmonale secondary to PE.4 Since then, variable ECG findings were described in association with PE which included changes in rate, rhythm, conduction, axis and morphology with sinus tachycardia being the most common abnormality.5
Arrhythmias can include atrial fibrillation, atrial flutter, atrial tachycardia and atrial premature contractions. Conduction delay includes right bundle branch block (RBBB) which is usually transient and can be either complete or incomplete. First-degree atrioventricular block was reported as well but it is less common than RBBB. Right axis deviation (RAD) is the classic axis deviation described with PE but left axis deviation and indeterminate QRS axis were described as well in association with PE.6 Morphological changes may include non-specific changes of ST-segment and T-wave, T-wave inversions in the right precordial leads and P-pulmonale which is characterised by an increase in the P-wave amplitude more than 2.5 mV in lead II.7
Some authors described certain ECG patterns associated with PE. Chou8 suggested that typical ECG findings in PE are as follows: an S1Q3 or S1Q3T3 pattern, rightward shift of the QRS axis, complete or incomplete transient RBBB and T-wave inversion in the right precordial leads. Sreeram et al9 suggested that PE should be considered when three or more of the following ECG changes are encountered: incomplete or complete RBBB, large S-waves in leads I and aVL, a shift in the transition zone in the precordial leads to V5, Q-waves in leads III and aVF but not lead II, RAD, a low-voltage QRS complex in limb leads or T-wave inversion in inferior and anterior leads.
Despite all the proposed ECG changes, ST elevation associated with PE remains rare and is mainly described in case reports. In 1970, an ECG of a patient with an acute PE confirmed by an autopsy demonstrated ST segment elevations in leads V2–V5.10 In 1979, an ECG of another case of an autopsy proven PE showed elevated and coved ST segments in leads V1–V6.11
Since then, ST segment elevation in precordial leads V1–V4 has been described in few case reports of pulmonary embolism.12–16
One of the possible explanations of ST-segment elevation with PE is a paradoxical coronary embolism across an ASD or a PFO owing to sudden increase in right heart pressure secondary to PE.17 Our case did not have evidence of ASD or PFO on autopsy, coronary arteries were free of blood clots and myocardium showed no evidence of myocardial infarction. These findings may suggest another mechanism of ST-segment elevation in this case which can be secondary to microvascular coronary vasospasm induced by sudden right ventricular strain or hypoxemic induced catecholamine surge.12
In conclusion, this case represents atypical electrocardiographic findings in PE which can be a diagnostic challenge. Physicians should consider PE in the differential diagnosis of ST-segment elevation.
Learning points.
Pulmonary embolism (PE) presentation can mimic ST-elevation myocardial infarction.
Microvascular coronary vasospasm induced by sudden right ventricular strain or hypoxemic induced catecholamine surge secondary to PE can result in ST-segment elevation.
PE-induced ST-elevation can be due to paradoxical coronary embolism across a PFO or an ASD.
Footnotes
Competing interests: None.
Provenance and peer review: Not commissioned; externally peer reviewed.
References
- 1.Wang K, Asinger RW, Marriott HJ. ST-segment elevation in conditions other than acute myocardial infarction. N Engl J Med 2003;349:2128–35 [DOI] [PubMed] [Google Scholar]
- 2.Goldhaber SZ, Visani L, De Rosa M. Acute pulmonary embolism: clinical outcomes in the International Cooperative Pulmonary Embolism Registry (ICOPER). Lancet 1999;353:1386–9 [DOI] [PubMed] [Google Scholar]
- 3.Kucher N, Goldhaber SZ. Management of massive pulmonary embolism. Circulation 2005;112:e28. [DOI] [PubMed] [Google Scholar]
- 4.McGinn S, White PD. Acute cor pulmonale resulting from pulmonary embolism. JAMA 1935;104:1473–80 [Google Scholar]
- 5.Senior RM. Pulmonary embolism. In: Bennett JC, Plum F, Gill GN, Kokko JP, Mandell GL, Ockner RK. eds Cecil textbook of medicine. 20th edn. Philadelphia: Saunders, 1996:422–9 [Google Scholar]
- 6.Panos RJ, Barish RA, Whye DW Jr, et al. The electrocardiographic manifestations of pulmonary embolism. J Emerg Med 1988;6:301–7 [DOI] [PubMed] [Google Scholar]
- 7.Weber DM, Phillips JH. A re-evaluation of electrocardiographic changes accompanying acute pulmonary embolism. Am J Med Sci 1966;251:381. [DOI] [PubMed] [Google Scholar]
- 8.Chou T. Electrocardiography in clinical practice. 2nd edn. Orlando, FL: Grune Stratton, 1986:309–17 [Google Scholar]
- 9.Sreeram N, Cheriex EC, Smeets JL, et al. Value of the 12-lead electrocardiogram at hospital admission in the diagnosis of pulmonary embolism. Am J Cardiol 1994;73:298–303 [DOI] [PubMed] [Google Scholar]
- 10.Romhilt D, Susilavorn B, Chou T. Unusual electrocardiographic manifestation of pulmonary embolism. Am Heart J 1970;80:237–41 [DOI] [PubMed] [Google Scholar]
- 11.Berman L, Schamroth L. Acute pulmonary embolism. Heart Lung 1979;8:1146–7 [PubMed] [Google Scholar]
- 12.Falterman TJ, Martinez JA, Daberkow D, et al. Pulmonary embolism with ST segment elevation in leads V1 to V4: case report and review of the literature regarding electrocardiographic changes in acute pulmonary embolism. J Emerg Med 2001;21:255–61 [DOI] [PubMed] [Google Scholar]
- 13.Wilson GT, Schaller FA. Pulmonary embolism mimicking anteroseptal acute myocardial infarction. J Am Osteopath Assoc 2008;108:344–9 [PubMed] [Google Scholar]
- 14.Lin JF, Li YC, Yang PL. A case of massive pulmonary embolism with ST elevation in leads V1-4. Circ J 2009;73:1157–9 [DOI] [PubMed] [Google Scholar]
- 15.Livaditis IG, Paraschos M, Dimopoulos K. Massive pulmonary embolism with ST elevation in leads V1-V3 and successful thrombolysis with tenecteplase. Heart 2004;90:e41. [DOI] [PMC free article] [PubMed] [Google Scholar]
- 16.Goslar T, Podbregar M. Acute ECG ST-segment elevation mimicking myocardial infarction in a patient with pulmonary embolism. Cardiovasc Ultrasound 2010;8:50. [DOI] [PMC free article] [PubMed] [Google Scholar]
- 17.Cheng TO. Mechanism of ST-elevation in acute pulmonary embolism. Int J Cardiol 2005;103:221–3 [DOI] [PubMed] [Google Scholar]


