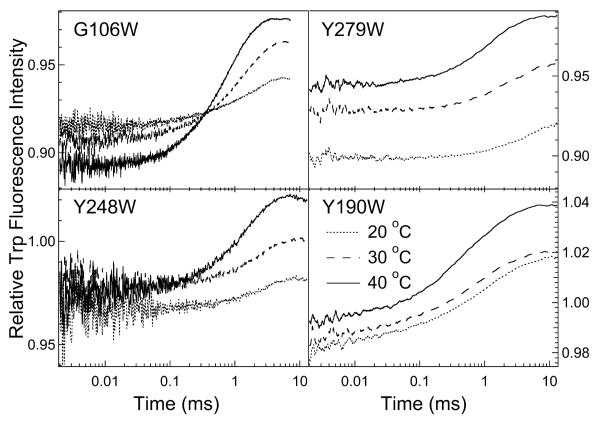
Figure 4.
Tryptophan fluorescence T-jump kinetic profiles for the four single-Trp mutant proteins, G106W, Y279W, Y248W and Y190W. For the G106W mutant, temperatures after about 9 °C T-jump were 24, 34 and 44 °C, and measurements were done at pH 7.2. For all other mutants, pH 6.0 buffer was used; temperatures after about 7 °C T-jump are shown on the lower-right graph. All samples contained 80 OM bsLDH, 80 μM NADH and 1200 μM oxamate.

