Abstract
The vast majority of the mouse and human genomes consists of repetitive elements (REs), while protein-coding sequences occupy only ~3 %. It has been reported that the Y chromosomes of both species are highly populated with REs although at present, their complete sequences are not available in any public database. The recent update of the mouse genome database (Build 38.1) from the National Center for Biotechnology Information (NCBI) indicates that mouse chromosome Y is ~92 Mb in size, which is substantially larger than the ~16 Mb reported previously (Build 37.2). In this study, we examined how REs are arranged in mouse chromosome Y (Build 38.1) using REMiner-II, a RE mining program. A combination of diverse REs and RE arrays formed large clusters (up to ~28 Mb in size) and most of them were directly or inversely related. Interestingly, the RE population of human chromosome Y (NCBI Build 37.2-current) was less dense, and the RE/RE array clusters were not evident in comparison to mouse chromosome Y. The annotated gene loci were distributed in five different regions and most of them were surrounded by unique RE arrays. In particular, tandem RE arrays were embedded into the introns of two adjacent gene loci. The findings from this study indicate that the large and interrelated clusters of REs and RE arrays predominantly represent the unique organizational pattern of mouse chromosome Y. The potential interactions among the clusters, which are populated with various interrelated REs and RE arrays, may play a role in the structural configuration and function of mouse chromosome Y.
Introduction
During the last two decades, a substantial fraction of biological research has focused on a comprehensive decoding of the genomes of a wide variety of species (Fraser et al. 2000; Kaiser 2008). One evident product, which is derived from these genome sequencing projects, is an effort to introduce each individual’s genome information into a formula of personalized medicine (Lee and Morton 2008; Wheeler et al. 2008). Although attempts have been made to sequence genomes in their entirety, the current genome databases of the National Center for Biotechnology Information (NCBI) do not reflect the complete/whole reference genomes of human and mouse (http://www.ncbi.nlm.nih.gov/mapview/). In fact, the vast majority of sequencing projects predominantly target only the genomic regions of genes and/or small RNA coding sequences, yielding big data sets, such as non-synonymous single nucleotide polymorphisms of the genes, which are presumed to be responsible for phenotypic variations (Gilissen et al. 2012; Gonzaga-Jauregui et al. 2012).
The sum of the protein-coding gene sequences make up ~3 % of the human and mouse genomes, while the rest are occupied by repetitive elements (REs), which include retroelements and DNA transposons, and other uncharacterized genetic elements (Waterston et al. 2002; Collins et al. 2004). Our recent studies identified RE profiles for the human and mouse genomes using an unbiased self-alignment protocol (Lee et al. 2011; Lee et al. 2012). Interestingly, some REs were organized into complexly ordered arrangement structures, named RE arrays, and the genomic RE array profiles were species-specific in contrast to the high similarity in their gene sequences.
It has been reported that both human and mouse Y chromosomes are densely populated with REs and have a very limited number of genes which code for functional proteins (Jobling and Tyler-Smith 2003; Skaletsky et al. 2003). It is unclear whether the current repertoire of genes residing on the Y chromosomes are sufficient for the generation of the extensive male-specific phenotypes. The most recent NCBI update of the mouse genome database (Build 38.1) (http://www.ncbi.nlm.nih.gov/projects/mapview/map_search.cgi?taxid=10090) indicates that Mus musculus chromosome Y (MMUY) is ~91.7 Mb in size (with 17 discontinuous regions), which is substantially different from the previous version (~16 Mb in Build 37.2) (http://www.ncbi.nlm.nih.gov/projects/mapview/map_search.cgi?taxid=10090&build=previous). Meanwhile, in the current NCBI version (Build 37.2; as of October, 2012), Homo sapiens chromosome Y (HSAY) is depicted as ~59 Mb in size, of which less than half is sequenced (http://www.ncbi.nlm.nih.gov/projects/mapview/maps.cgi?taxid=9606&chr=Y).
The recent NCBI update on the mouse genome database enabled the investigation of the chromosome-wide profile (density and organization pattern) of REs and RE arrays in MMUY, which is presumed to have the highest RE density among the 21 mouse chromosomes.
Materials and Methods
Acquisition of chromosome sequences and gene annotation information
The corresponding full contig sets of four mouse chromosome sequences (MMUY and MMU18 from both Build 37.2 and Build 38.1) and HSAY (Build 37.2) were obtained from the NCBI mouse and human genome databases followed by assembly into individual chromosomes. In addition, the NCBI mouse genome database (Build 37.2 and Build 38.1) was surveyed to collect the gene annotation information relevant to MMUY and MMU18.
To compare structural configurations of RE arrays surrounding the orthologous Rbmy1a1 genes of MMUY (Build 38.1) and HSAY (Build 37.2), the sequences, including 200 Kb up- and down-stream from their loci, were obtained for unbiased RE/RE array analyses using REMiner-II (Kim et al. 2012).
In silico mining of REs and RE arrays
The assembled chromosome sequences (MMUYs, MMU18 [Build 38.1 only], and HSAY) were subjected to an unbiased mining of REs and RE arrays using the REMiner-II program. The parameters used for the REMiner-II analyses in this study were: word size (14), allowable mismatch number (1), space threshold (2), seed length threshold (56), matching score (1), mismatching score (−2), ungapped extension threshold (−10), gapped extension threshold (30), window size for filtering (20), and filtering score threshold (0.60). In another REMiner-II analysis, to achieve a clearer contrast of RE arrays/clusters of RE arrays from the presumably non-RE array regions, the seed length was increased from 56 to 448 which is expected to result in decreased number of short length alignments in conjunction with reduced background RE density. The resulting dot-matrix plots of self-alignment data were surveyed for REs, RE arrays, and clusters of RE arrays using the REMiner-II viewer.
Identification of two putative MMUY repeat units
Two putative MMUY repeat units (unit-1 and unit-2) were identified by self-alignment of the cluster-a and cluster-f sequences using the bl2seq program (NCBI). The smallest alignments, which periodically appeared within the RE array clusters were identified as a putative MMUY repeat unit. The resulting MMUY repeat unit sequences were subjected to an RE population survey using RepeatMasker and its database (http://www.repeatmasker.org). RepeatMasker analyses were performed with the abblast search engine and default speed/sensitivity options.
Definition of terms used in this manuscript
RE population: a group of different REs in a clearly defined chromosomal region
RE array: an ordered arrangement of a chromosomal region characterized by periodic repeats of a single RE type
Cluster of RE arrays: a chromosomal region distinguished by the contiguous presence of more than one RE array
MMUY repeat unit: a specific set of REs which appear periodically as a unit in MMUY
Results and Discussion
Chromosome-wide existence of large interrelated clusters of REs and RE arrays in reference MMUY
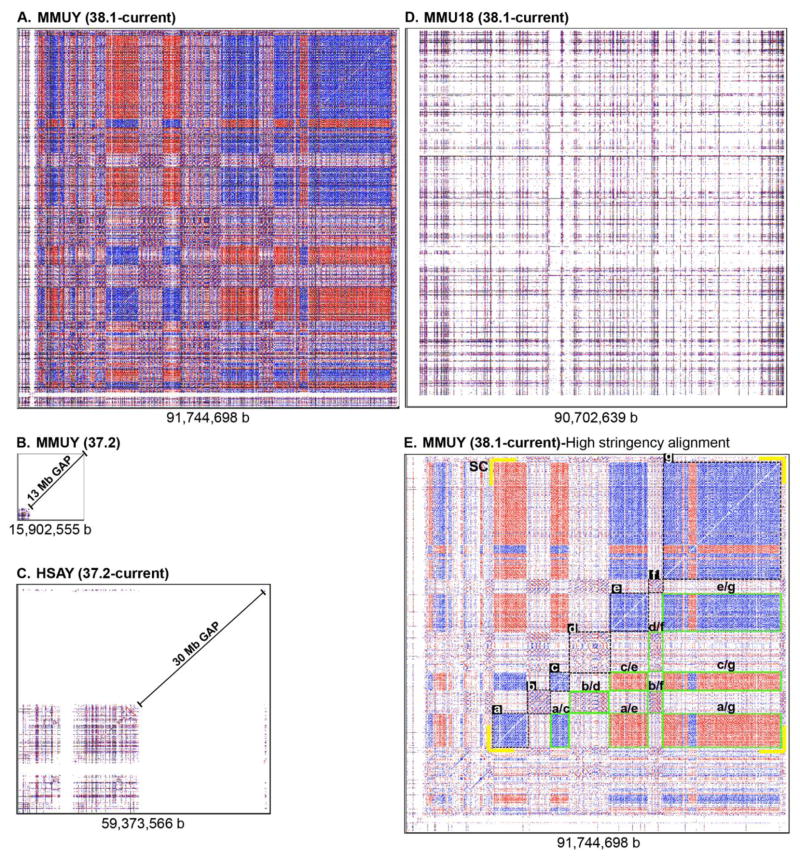
To examine the chromosome-wide profile of how REs and RE arrays are organized in regard to density and interrelationship among different regions, the NCBI MMUY sequence (Build 38.1-current) was subjected to an unbiased mining of REs and RE arrays using a self-alignment protocol within the REMiner-II program (Kim et al. 2012). In addition to MMUY (Build 38.1), four other chromosomes (MMUY [Build 37.2-previous], MMU18 [Build 37.2], MMU18 [Build 38.1], and HSAY [Build 37.2-current]) were also surveyed for REs and RE arrays for comparative analyses. Since the size of MMU18 (Build 38.1) (~90.7 Mb) is similar to MMUY (Build 38.1) (~91.7 Mb), it was selected as a control for the comparison of chromosome-wide RE density. The dot-matrix plot profile of REs and RE arrays in MMUY (Build 38.1) was uniquely characterized by: 1) overall high RE density and 2) large interrelated clusters of RE arrays, either in direct (blue dots/lines) or inverse (red dots/lines) orientation (Figure 1). When an REs’ sequence similarity occurs on the same strand, it is called direct repeat and on the complementary strand is inverse repeat. The size of individual clusters of RE arrays in MMUY (Build 38.1) ranged from ~3.54 Mb to ~28.02 Mb (Figures 1 and 2); however, no significant clusters of RE arrays were observed in MMUY (Build 37.2) (Figure 1B) or HSAY (Build 37.2) (Figure 1C). It needs to be noted that MMUY (Build 37.2) and HSAY (Build 37.2) were estimated to be ~16 Mb and ~59 Mb in size, but only ~3 Mb and ~26 Mb were sequenced, respectively (http://www.ncbi.nlm.nih.gov/projects/mapview/maps.cgi?taxid=10090&chr=Y, http://www.ncbi.nlm.nih.gov/projects/mapview/maps.cgi?taxid=9606&chr=Y).
Figure 1. Existence of large interrelated clusters of REs and RE arrays in MMUY (Build 38.1).
A–D. Four different chromosome sequences (A. MMUY [NCBI Build 38.1], B. MMUY [Build 37.2], C. HSAY [Build 37.2], and D. MMU18 [Build 38.1]) were subjected to unbiased mining of REs and RE arrays using the REMiner-II program (Kim et al. 2012), and the results are presented as a dot-matrix plot. Blue and red colors indicate direct and inverse relationships between REs, respectively. The length of each chromosome sequence is indicated under each plot. E. In an attempt to increase the contrast of putative clusters of REs and RE arrays in the dot-matrix plot, the seed length was increased from 56 to 448 during the mining of REs and RE arrays. A high contrast dot-matrix plot of MMUY (Build 38.1) reveals distinct clusters formed with diverse REs and RE arrays. The seven dot-matrix plot regions, which are selected as the primary clusters (a–g) of RE arrays, are identified with dotted lines. The secondary clusters, which are formed with a pair of discontinuously related primary clusters, are outlined in green (e.g., cluster a/c). In addition, the super cluster (SC), spanning from ~20.9 Mb to ~89.4 Mb, is indicated with yellow brackets at the four corners. MMUY (Mus musculus chromosome Y), HSAY (Homo sapiens chromosome Y), MMU18 (Mus musculus chromosome 18), and b (base pair).
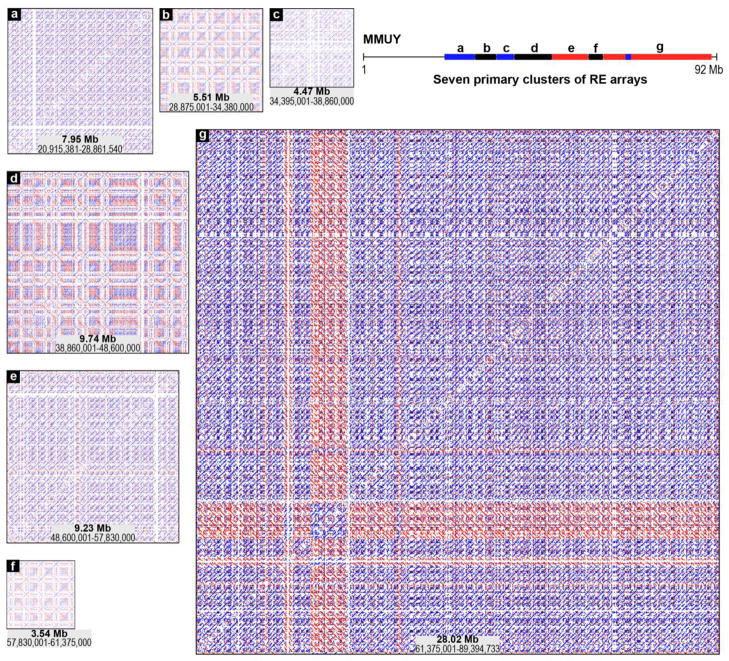
Figure 2. Structural details of clusters formed with diverse REs and RE arrays.
Structural details of seven primary clusters of MMUY (Build 38.1) (a ~ g clusters identified in panel E of Figure 1) are presented by magnification of the dot-matrix plot data using the REMiner-II viewer. Both size and chromosomal coordinate information are provided for each cluster. In addition, the relative locations of the individual clusters (a ~ g) are indicated on a line map of MMUY.
In a sharp contrast to the high RE density and large interrelated clusters of RE arrays present in MMUY (Build 38.1) (Figure 1A), MMU18 (Build 38.1) (Figure 1D) had a relatively low RE density with no evident clusters of RE arrays. In addition, adjustment of the seed length from 56 to 448 during the RE mining process provided a high-contrast dot-matrix RE plot of MMUY (Build 38.1) that confirms discrete clusters of RE arrays which are configured to be interrelated, either directly or inversely (Figure 1E). In fact, it appears that a combination of contiguous clusters, which reside between the coordinates of ~21 Mb and ~89 Mb, manifests a complexly organized super cluster of interrelated RE arrays (Figure 1E). Further studies are essential to identify the population of REs and RE arrays in these clusters followed by characterization of their roles in the structure and/or function of MMUY.
Structural characteristics of large interrelated clusters of RE arrays in MMUY (Build 38.1)
In this study, the seven clusters of RE arrays were isolated from the dot-matrix self-alignment plot of MMUY (Build 38.1) to examine their structural characteristics (Figures 1E and 2). Some clusters (clusters-a, c, and e) were densely populated with REs of a predominantly single orientation, while others (clusters-b, d, f, and g) were formed with a combination of direct and inverse orientation REs. In addition to the primary clusters spanning the contiguous chromosomal regions, interrelationships among the discontinuous clusters resulted in the formation of secondary clusters. A total of nine secondary clusters (clusters-a/c, b/d, a/e, c/e, b/f, d/f, a/g, c/g, and e/g) were identified (Figure 1E). Within each secondary cluster, which is formed by a combination of two primary clusters, the directionality of REs and RE arrays is variable depending on the relationships between the two different populations of REs and RE arrays.
Each cluster of RE arrays was subjected to a close examination using the REMiner-II viewer’s magnification tool to identify the structural details of the embedded REs and RE arrays. For example, cluster-a (coordinates: from ~20.9 Mb to ~28.8 Mb) was determined to be an RE array of imperfect and unidirectional tandem repeats which harbor potential break, repair, insertion, and/or deletion points as represented by discontinuous and/or shifted lines in its dot-matrix plot (Figure 2-a). It appears that cluster-c and cluster-e share a similar tandem structure with cluster-a. In addition, the dot-matrix plot pattern of cluster-a suggests that the putative repeat units, which are ~0.5 Mb in size, are generated by a mosaic assembly of a population of various REs. A blank space near the 5′-end of the cluster indicates a gap between two adjacent contigs. The structural pattern of cluster-g, which is the largest cluster identified in this study (coordinates: from ~61.4 Mb to ~89.4 Mb), was determined to be a tandem array although it has a more complex structure than cluster-a, cluster-c, and cluster-e. Furthermore, cluster-b (coordinates: from ~28.8 Mb to ~34.3 Mb), cluster-d (coordinates: from ~38.9 Mb to ~48.6 Mb), and cluster-f (coordinates: from ~57.8 Mb to ~61.4 Mb) seem to be tandem arrays with large palindromic repeat units of varying degrees of complexity. Similar to the other tandem array clusters described above, the repeat units of these clusters are not identical due to potential past events of break, repair, insertion, and/or deletion. The imperfect repeat units of palindromic tandem arrays were embedded with similar, but polymorphic, RE arrays. On the other hand, the direct orientation (blue) of the secondary cluster (a/c) formed by cluster-a and cluster-c indicates that the REs in these two primary clusters are directly related (Figure 1E). In contrast, the inverse orientation (red) of cluster-a/e is due to the inverse relationship between the RE populations of cluster-a and cluster-e.
The findings from this study indicate that the overall structure of the vast majority of clusters of RE arrays, which reside on MMUY (Build 38.1), is represented by various tandem array configurations (e.g., direct, inverse, palindromic) of different mosaic-patterned repeat units. It may be important to further characterize the roles of the tandem arrays of various forms, which dominantly represent MMUY (Build 38.1), in the structural configuration and/or function of the chromosome at the level of an individual cluster and/or combinations of interrelated (both direct and inverse orientations) clusters. The structural characteristics of the individual tandem arrays and bi-directional relationships among distant RE arrays and/or clusters of RE arrays may provide some insights for decoding the contribution of densely populated REs to the biology of the mouse as well as human Y chromosomes.
Localization of functional genes of MMUY in conjunction with RE and RE array profiles of the intergenic and surrounding regions
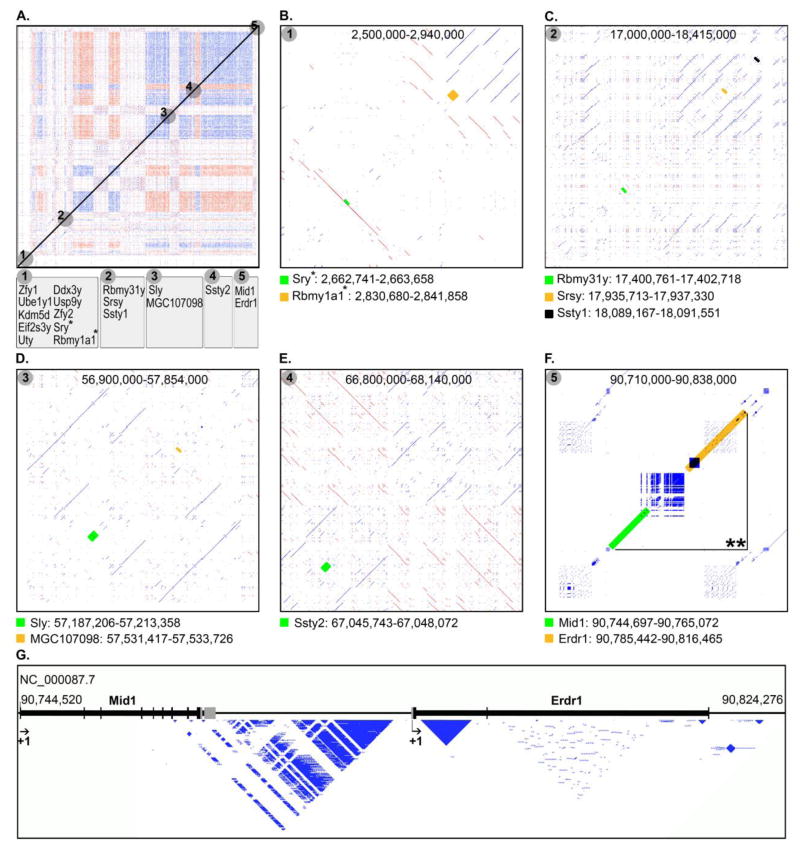
To examine the potential impact of clusters of RE arrays on functional genes of MMUY in regard to the structures of intragenic as well as surrounding regions, the genes annotated on the NCBI mouse genome database (Build 38.1) were mapped on the dot-matrix plot of REs and RE arrays of MMUY (Figure 3). An initial mapping of a total of 18 functional genes on the chromosome-wide dot-matrix plot revealed that they are segregated on five different regions of MMUY (Figure 3A). Subsequent high-resolution surveys of each gene locus and its adjacent area for the occurrence of REs and RE arrays demonstrated that the vast majority of the gene loci are surrounded by and/or embedded with diverse REs and/or RE arrays (Figure 3B–F). In particular, various tandem arrays were embedded into the introns of Mid1 and Erdr1 loci, and more than 87% of the intergenic space between these two loci was occupied by a complex tandem array (Figure 3G). Another tandem array, which occupies the first intron of the Erdr1 gene, may contribute to formation of the secondary and/or tertiary structures near the promoter region. In future studies, it will be interesting to evaluate the roles of the REs and/or RE arrays, embedded into and/or surrounding (both immediately and distantly) individual gene loci, in modulating relevant gene expression and rearrangement. It can be speculated that some of these REs and/or RE arrays, which are associated with certain gene loci, may serve as key elements of the secondary and/or tertiary structures of the regions (e.g., enhancer loop) which are directly linked to transcriptional efficiency.
Figure 3. Map of the functional genes of MMUY in conjunction with the RE and RE array profiles of intragenic and neighboring areas.
A. Five different regions (gray circles: region-1 through region-5), which harbor a total of 18 functional genes (annotated in the NCBI database), were mapped on the dot-matrix plot of REs and RE arrays of MMUY. Each region contains one to ten annotated genes. *Indicates two gene loci of region-1 which are subjected to further structural analyses in panel B. B–F. For each of the selected gene loci indicated in panel A by numbered grey circles, a high-resolution dot-matrix plot data is drawn to examine occurrences of REs and RE arrays in the intragenic and surrounding areas. Each gene locus, which is listed with the corresponding dot-matrix plot, is indicated with a green, yellow, or black box. **Indicates the section within region-5 (panel F) which is subjected to a detailed structural analysis in panel G. G. The exon-intron structures of Mid1 and Erd1 loci (the region labeled with “**” in panel F) of region-5 were aligned with the REs and RE arrays embedded in the area. Each gene locus is represented with a black horizontal line and its exons are indicated with vertical lines/boxes. The vertical grey lines/boxes identify untranslated regions of the respective exons.
Identification of orthologous gene loci on MMUY and HSAY surrounded by a similar RE array
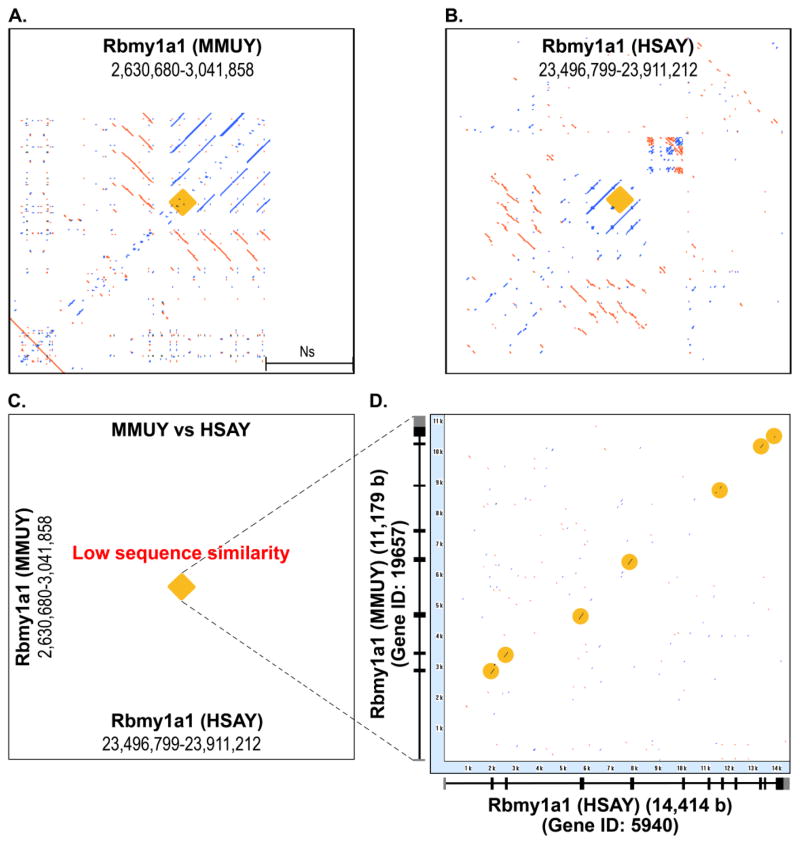
To investigate whether some orthologous gene loci of MMUY (Build 38.1) and HSAY (Build 37.2) share a similar RE array configuration, the REMiner-generated RE array data from both chromosomes was surveyed at each orthologous locus. One of the loci identified from this survey was the Rbmy1a1 orthologous gene (Figure 4A/4B) (Skrisovska et al. 2007). It appears that the Rbmy1a1 loci on MMUY and HSAY were surrounded by similar tandem RE arrays which are formed by combination of direct and inverse repeat units. We then examined whether the RE array regions surrounding the Rbmy1a1 loci are homologous between MMUY and HSAY by a two-sequence alignment using REMiner-II. It was interesting to observe that in contrast to the similar RE array configuration, there was no significant similarity in their nucleotide sequences, including gene regions, between MMUY and HSAY (Figure 4C). Since it is anticipated that the orthologous loci maintain certain level of sequence similarity, at least for most of the exon sequences, we assumed that the gene sequence-related dots/lines are invisible in this large query size due to a low resolution for the relatively small gene regions. Additional alignment analysis only with the Rbmy1a1 gene sequences of MMUY and HSAY demonstrated substantial matches at some of their exon sequences, but none evident in intron regions (Figure 4D).
Figure 4. Orthologous Rbmy1a1 gene loci of MMUY and HSAY which are surrounded by a similar RE array.
RE arrays formed in the regions surrounding the orthologous Rbmy1a1 gene loci (gene region+/− 200 Kb) on MMUY and HSAY were identified using the REMiner-II program. Both regions shared a similar RE array configuration (MMUY [A] and HASY [B]); however, there was no significant nucleotide sequence similarity (C). In panel C, gene loci are identified with a brown square. The exon structures of Rbmy1a1 genes on HSAY and MMUY are presented on X-axis and Y-axis of the dot-matrix alignment plot of the two orthologous loci, respectively (D). The Rbmy1a1 gene sequences from MMUY and HSAY aligned primarily on their exon sequences which are indicated with some lines/dots (brown circles).
Further studies are necessary to identify the functional significance of retaining a similar RE array configuration surrounding the orthologous gene loci of two different species while no meaningful similarity was detected in their nucleotide sequences. One possibility is that these RE arrays could be a component of the transcriptional machinery which control expression of the Rbmy1a1 orthologs, proximally and/or distally.
Chromosome-wide distribution of MMUY repeat unit-1 and unit-2
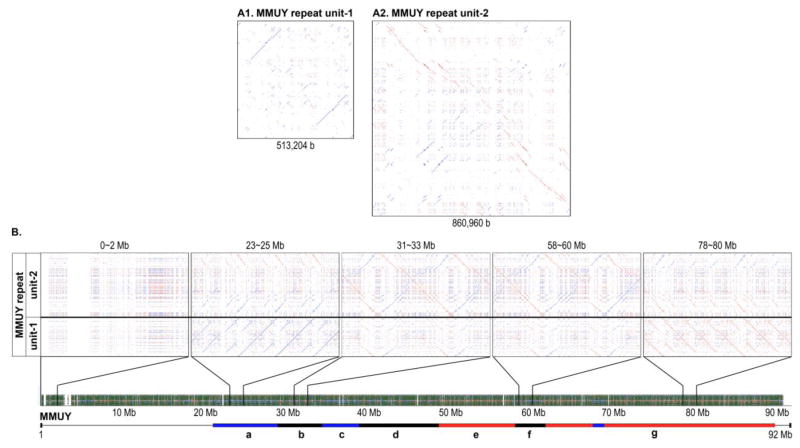
Following the initial identification and characterization of seven clusters of RE arrays in MMUY (Build 38.1) (Figures 1 and 2), a comprehensive and high-resolution survey of the RE array distribution in MMUY revealed that there are two main putative repeat units which represent the majority of MMUY: MMUY repeat unit-1 [~513 Kb] and MMUY repeat unit-2 [~860 Kb]) (Figure 5, Supplementary Files 1 and 2). An examination of the distribution patterns of MMUY repeat unit-1 and unit-2 by alignment of the repeat units (1 and 2) against the entire MMUY sequence showed that they are periodically repeated ~97 and ~22 times, respectively. Subsequently, both repeat units were subjected to RepeatMasker analyses to survey for known RE populations. While the two MMUY repeat units shared a similar RE population profile, the key difference resided in the level of LINE 1: 20.58 % in MMUY repeat unit-1 and 30.72 % in MMUY repeat unit-2 (Table 1). However, it needs to be noted that the two MMUY repeat units, although sharing a similar RE population, had two distinct RE array configurations (direct/inverse repeat unit for unit-1 and palindromic repeat unit for unit-2) (Figure 5). We then surveyed the sequence within the center of the MMUY repeat unit-2 to identify the RE population which form the palindromic structure using RepeatMasker and its database. The findings from this study confirmed a palindromic positioning of a highly similar population of REs at the center of MMUY repeat unit-2 (Supplementary File 3).
Figure 5. Identification and chromosome-wide distribution of MMUY repeat unit-1 and unit-2.
A. The dot-matrix plot RE profiles of MMUY repeat unit-1 (513,204 b) and unit-2 (860,960 b) were generated by self-alignment of each sequence using REMiner-II. B. The distribution patterns of the MMUY repeat unit-1 and unit-2 were examined by alignment of the repeat units (1 and 2) against the entire MMUY sequence. For a high-resolution pattern evaluation and presentation, the dot-matrix plots were expanded at five 2 Mb size regions. Seven RE array clusters of MMUY (a ~ g) are indicated on a scaled line map beneath the dot-matrix plot. The plot patterns confirmed that MMUY repeat unit-1 and unit-2 predominantly represent the chromosome except for the region near the 5′-end. X axis: MMUY (Build 38.1) and Y axis: MMUY repeat unit-1 and unit-2.
Table 1. RE populations in two MMUY repeat units.
The REs residing in MMUY repeat unit-1 and MMUY unit-2 were identified using RepeatMasker and its database.
| MMUY repeat unit-1 | MMUY repeat unit-2 | ||||||
|---|---|---|---|---|---|---|---|
| Total length: | 513,204 b | Total length: | 860,960 b | ||||
| GC level: | 38.97% | GC level: | 39.04% | ||||
| Bases masked: | 274,491 b | 53.49% | Bases masked: | 530,101 b | 61.57% | ||
|
| |||||||
| REs | No. of elements | Length occupied (b) | % of sequence | REs | No. of elements | Length occupied (b) | % of sequence |
| SINEs | 104 | 14,876 | 2.9 | SINEs | 158 | 22,458 | 2.61 |
|
| |||||||
| ALU/B1 | 50 | 6,405 | 1.25 | ALU/B1 | 87 | 11,049 | 1.28 |
| B2-B4 | 52 | 8,355 | 1.63 | B2-B4 | 69 | 11,275 | 1.31 |
| IDs | 2 | 116 | 0.02 | IDs | 2 | 134 | 0.02 |
|
| |||||||
| LINEs | 141 | 105,957 | 20.65 | LINEs | 246 | 264,930 | 30.77 |
|
| |||||||
| LINE1 | 138 | 105,599 | 20.58 | LINE1 | 244 | 264,479 | 30.72 |
| LINE2 | 1 | 226 | 0.04 | LINE2 | 2 | 451 | 0.05 |
| L3/CR1 | 2 | 132 | 0.03 | L3/CR1 | 0 | 0 | 0 |
|
| |||||||
| LTR elements | 180 | 118,591 | 23.11 | LTR elements | 215 | 183,871 | 21.36 |
|
| |||||||
| ERVL | 7 | 2,269 | 0.44 | ERVL | 14 | 4,111 | 0.48 |
| ERVL-MaLRs | 93 | 28,048 | 5.47 | ERVL-MaLRs | 63 | 22,686 | 2.63 |
| ERV-class I | 17 | 30,671 | 5.98 | ERV-class I | 45 | 82,098 | 9.54 |
| ERV-class II | 63 | 57,603 | 11.22 | ERV-class II | 93 | 74,976 | 8.71 |
|
| |||||||
| DNA elements | 14 | 1,924 | 0.37 | DNA elements | 13 | 1,850 | 0.21 |
|
| |||||||
| hAT-Charlie | 3 | 355 | 0.07 | hAT-Charlie | 9 | 1,267 | 0.15 |
| TcMar-Tigger | 11 | 1,569 | 0.31 | TcMar-Tigger | 4 | 583 | 0.07 |
|
| |||||||
| Unclassified | 25 | 12,476 | 2.43 | Unclassified | 17 | 18,604 | 2.16 |
|
| |||||||
| Small RNAs | 0 | 0 | 0 | Small RNAs | 5 | 629 | 0.07 |
|
| |||||||
| Satellites | 35 | 4,100 | 0.8 | Satellites | 80 | 9,915 | 1.15 |
|
| |||||||
| Simple repeats | 176 | 10,887 | 2.12 | Simple repeats | 313 | 19,812 | 2.3 |
|
| |||||||
| Low complexity | 86 | 5,680 | 1.11 | Low complexity | 132 | 8,032 | 0.93 |
A comprehensive profiling of the RE population in each MMUY repeat unit may be necessary to deconstruct how the repeat units are formulated and to understand the roles of individual REs in that process. Interestingly, the results from the RepeatMasker analysis only identified ~53 % and ~62 % of the entire sequences of MMUY repeat unit-1 and unit-2 as REs, respectively, although the center of the palindromes were dominantly populated with REs (Table 1 and Supplementary File 3), suggesting that an update of the current RE database is needed with results from unbiased surveys.
Conclusions
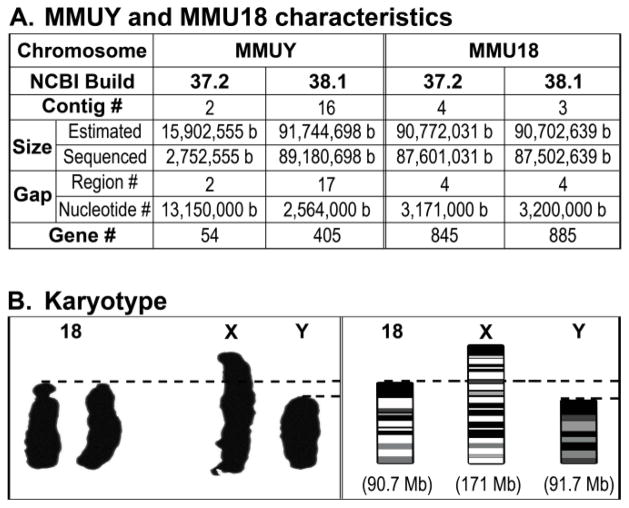
It has been reported that MMUY is densely populated with REs (Cooke et al. 1982; Jobling and Tyler-Smith 2003). Interestingly, its nucleotide length has been substantially variable depending on the studies and databases (Figure 6A) (Bishop and Mitchell 1999; Gregory et al. 2002). The most recent NCBI update of the mouse genome database (Build 38.1) enabled a meaningful survey of REs and RE arrays in MMUY for this study. A collection of large and interrelated clusters of diverse REs and RE arrays were identified throughout MMUY. In addition, a contiguous set of clusters, which spanned ~20.9 Mb to ~89.4 Mb, formed a super cluster of interrelated REs and RE arrays. Interestingly, the density of genes annotated in the current MMUY (405 loci total) was less than half of the similarly-sized MMU18 (885 loci total) which can be directly associated with the high RE density in MMUY (Figure 6A). The findings from this study suggest a new project that investigates whether the potential interactions (direct and/or inverse) of REs and RE arrays in these clusters play a role in the structural configuration and function of MMUY. The data obtained from this future project may be able to explain the differences in microscopic karyotyping sizes, such as between MMUY and MMU18, when they are similar in nucleotide length (Figure 6B). In addition, it may be important to identify the population of the individual REs and/or RE arrays in these clusters followed by characterization of their roles in the biology of MMUY, such as the modulation of gene expression, rearrangement, and centromere function. Furthermore, development of a computational tool, which can recognize and classify different types of REs and RE arrays, may be essential for functional characterization of RE arrays and their clusters, such as investigations into their roles in transcriptional control.
Figure 6. Different versions of sequence databases and karyotyping images of MMUY and MMU18. A.
The key differences in the MMUY and MMU18 characteristics between NCBI Build 37.2 and Build 38.1, in regard to number (#) of contigs, chromosome size (Size), number of gaps on chromosome (Gap), and number of genes (Gene), are summarized. B. The karyotyping images of chromosomes from a male mouse (C57BL/6J strain) were obtained from the Jackson Laboratories (Bar Harbor, ME) website to compare the microscopic sizes of MMUY and MMU18, which are similar in nucleotide length, ~91.7 Mb and ~90.7 Mb, respectively (Akeson and Davisson 2001; Guda et al. 2004). MMUX (~171 Mb) serves as a reference.
Supplementary Material
The sequence at the palindromic center of MMUY repeat unit-2 (37,853 b) was surveyed to identify the RepeatMasker-based RE population. A palindromic positioning of a highly similar population of REs at the center of MMUY repeat unit-2 was confirmed. A. REMiner-II-obtained dot-matrix plot of the entire palindromic MMUY repeat unit-2 [860,960 b], B. REMiner-II-obtained dot-matrix plot of the center [37,853 b] of the palindrome, and C. Sequence of the palindromic center [37,853 b] of MMUY repeat unit-2; blue and red highlights indicate the palindromic positioning of a population of REs which are identified on the side. Blue and red dots with arrows identify starting points of the palindromic units.
Acknowledgments
This study was supported, in part, by grants from Shriners of North America (No. 86800 to KC and No. 84302 to KHL [postdoctoral fellowship]) and the National Institutes of Health (R01 GM071360 to KC).
Abbreviation List
- HSAY
Homo sapiens chromosome Y
- MMU18
Mus musculus chromosome 18
- MMUX
Mus musculus chromosome X
- MMUY
Mus musculus chromosome Y
- NCBI
National Center for Biotechnology Information
- Rbmy1a1
RNA binding motif protein, Y chromosome, family 1, member A1
- RE
repetitive element
References
- Akeson EC, Davisson MT. Mitotic chromosome preparations from mouse cells for karyotyping. Curr Protoc Hum Genet. 2001;Chapter 4(Unit4):10. doi: 10.1002/0471142905.hg0410s25. [DOI] [PubMed] [Google Scholar]
- Bishop CE, Mitchell MJ. Mouse Y chromosome. Mamm Genome. 1999;10(10):962. doi: 10.1007/s003359901140. [DOI] [PubMed] [Google Scholar]
- Collins FS, Lander ES, Rogers J, et al. Finishing the euchromatic sequence of the human genome. Nature. 2004;431(7011):931–945. doi: 10.1038/nature03001. [DOI] [PubMed] [Google Scholar]
- Cooke HJ, Schmidtke J, Gosden JR. Characterisation of a human Y chromosome repeated sequence and related sequences in higher primates. Chromosoma. 1982;87(5):491–502. doi: 10.1007/BF00333470. [DOI] [PubMed] [Google Scholar]
- Fraser CM, Eisen JA, Salzberg SL. Microbial genome sequencing. Nature. 2000;406(6797):799–803. doi: 10.1038/35021244. [DOI] [PMC free article] [PubMed] [Google Scholar]
- Gilissen C, Hoischen A, Brunner HG, Veltmen JA. Disease gene identification strategies for exome sequencing. Eur J Hum Genet. 2012;20(5):490–497. doi: 10.1038/ejhg.2011.258. [DOI] [PMC free article] [PubMed] [Google Scholar]
- Gonzaga-Jauregui C, Lupski JR, Gibbs RA. Human genome sequencing in health and disease. Annu Rev Med. 2012;63:35–61. doi: 10.1146/annurev-med-051010-162644. [DOI] [PMC free article] [PubMed] [Google Scholar]
- Gregory SG, Sekhon M, Schein J, et al. A physical map of the mouse genome. Nature. 2002;418(6899):743–750. doi: 10.1038/nature00957. [DOI] [PubMed] [Google Scholar]
- Guda K, Upender MB, Belinsky G, et al. Carcinogen-induced colon tumors in mice are chromosomally stable and are characterized by low-level microsatellite instability. Oncogene. 2004;23(21):3813–3821. doi: 10.1038/sj.onc.1207489. [DOI] [PubMed] [Google Scholar]
- Jobling MA, Tyler-Smith C. The human Y chromosome: an evolutionary marker comes of age. Nat Rev Genet. 2003;4(8):598–612. doi: 10.1038/nrg1124. [DOI] [PubMed] [Google Scholar]
- Kaiser J. DNA sequencing. A plan to capture human diversity in 1000 genomes. Science. 2008;319(5862):395. doi: 10.1126/science.319.5862.395. [DOI] [PubMed] [Google Scholar]
- Kim WC, Lee KH, Shin KS, et al. REMiner-II: A tool for rapid identification and configuration of repetitive element arrays from large mammalian chromosomes as a single query. Genomics. 2012;100(3):131–140. doi: 10.1016/j.ygeno.2012.06.006. [DOI] [PMC free article] [PubMed] [Google Scholar]
- Lee C, Morton CC. Structural genomic variation and personalized medicine. N Engl J Med. 2008;358(7):740–741. doi: 10.1056/NEJMcibr0708452. [DOI] [PubMed] [Google Scholar]
- Lee KH, Lee YK, Kwon DN, et al. Identification of a unique library of complex, but ordered, arrays of repetitive elements in the human genome and implication of their potential involvement in pathobiology. Exp Mol Pathol. 2011;90(3):300–311. doi: 10.1016/j.yexmp.2011.02.007. [DOI] [PMC free article] [PubMed] [Google Scholar]
- Lee YK, Lee KH, Iim SG, et al. Unique profile of ordered arrangements of repetitive elements in the C57BL/6J mouse genome implicating their functional roles. PLoS One. 2012;7(4):e35156. doi: 10.1371/journal.pone.0035156. [DOI] [PMC free article] [PubMed] [Google Scholar]
- Skaletsky H, Kuroda-Kawaguchi T, Minx PJ, et al. The male-specific region of the human Y chromosome is a mosaic of discrete sequence classes. Nature. 2003;423(6942):825–837. doi: 10.1038/nature01722. [DOI] [PubMed] [Google Scholar]
- Skrisovska L, Bourgeois CF, Stefl R, et al. The testis-specific human protein RBMY recognizes RNA through a novel mode of interaction. EMBO Rep. 2007;8(4):372–379. doi: 10.1038/sj.embor.7400910. [DOI] [PMC free article] [PubMed] [Google Scholar]
- Waterston RH, Lindblad-Toh K, Birney E, et al. Initial sequencing and comparative analysis of the mouse genome. Nature. 2002;420(6915):520–562. doi: 10.1038/nature01262. [DOI] [PubMed] [Google Scholar]
- Wheeler DA, Srinivasan M, Egholm M, et al. The complete genome of an individual by massively parallel DNA sequencing. Nature. 2008;452(7189):872–876. doi: 10.1038/nature06884. [DOI] [PubMed] [Google Scholar]
Associated Data
This section collects any data citations, data availability statements, or supplementary materials included in this article.
Supplementary Materials
The sequence at the palindromic center of MMUY repeat unit-2 (37,853 b) was surveyed to identify the RepeatMasker-based RE population. A palindromic positioning of a highly similar population of REs at the center of MMUY repeat unit-2 was confirmed. A. REMiner-II-obtained dot-matrix plot of the entire palindromic MMUY repeat unit-2 [860,960 b], B. REMiner-II-obtained dot-matrix plot of the center [37,853 b] of the palindrome, and C. Sequence of the palindromic center [37,853 b] of MMUY repeat unit-2; blue and red highlights indicate the palindromic positioning of a population of REs which are identified on the side. Blue and red dots with arrows identify starting points of the palindromic units.


