Abstract
Various fluorescent nucleoside agonists of the A3 adenosine receptor (AR) were compared as high affinity probes using radioligands and flow cytometry (FCM). They contained a fluorophore linked through the C2 or N6 position and rigid A3AR-enhancing (N)-methanocarba modification. A hydrophobic C2-(1-pyrenyl) derivative MRS5704 bound nonselectively. C2-Tethered cyanine5-dye labeled MRS5218 bound selectively to hA3AR expressed in whole CHO cells and membranes. By FCM, binding was A3AR-mediated (blocked by A3AR antagonist, at least half through internalization), with t1/2 for association 38 min in mA3AR-HEK293 cells; 26.4 min in sucrose-treated hA3AR-CHO cells (Kd 31 nM). Membrane binding indicated moderate mA3AR affinity, but not selectivity. Specific accumulation of fluorescence (50 nM MRS5218) occurred in cells expressing mA3AR, but not other mouse ARs. Evidence was provided suggesting that MRS5218 detects endogenous expression of the A3AR in the human promyelocytic leukemic HL-60 cell line. Therefore, MRS5218 promises to be a useful tool for characterizing the A3AR.
Keywords: purines, fluorescence, G protein-coupled receptor, A3 adenosine receptor, flow cytometry
1. Introduction
The A3 adenosine receptor (AR) belongs to the Group A (rhodopsin-like) of G protein-coupled receptors (GPCRs). The human (h) A3AR is widespread throughout the body but generally at low levels, with expression noted in the lung, liver, brain, heart and eyes [1]. Based on in vitro and in vivo experiments, the A3AR represents a promising new target in drug discovery with cerebro- and cardioprotective, anti-cancer, anti-inflammatory and anti-asthmatic effects [2–7]. The A3AR is upregulated in diseased tissue, such as tumors and inflamed arthritic joints [1,2]. Several A3AR agonists are in advanced clinical trials for hepatocellular carcinoma, psoriasis and other conditions.
Activation of the hA3AR results in inhibition of adenylyl cyclase via Gi protein with a subsequent decrease in the level of 3′,5′-cyclic adenosine monophosphate (cAMP). Subsequent to agonist binding, the hA3AR can be phosphorylated by GPCR kinases (GRKs) followed by the binding of β-arrestins, which cause desensitization of the hA3AR and have their own signaling pathways. Receptor desensitization is associated with receptor internalization by clustering in clathrin-coated pits within minutes [8].
Agonist-induced regulation of the hA3AR has been studied by means of immunoprecipitation assays [9], adenylyl cyclase assays [10] and immunogold electron microscopy [11], or with radiolabeled ligands [12]. It has been reported that agonist-bound hA3ARs exist within highly ordered membrane domains [13], which has increased the need to study receptor-ligand interactions via potent and selective labeled ligands of the hA3AR. Radioligands used for receptor characterization suffer from various disadvantages: limited range of visualization techniques and the cost and health risk associated with their usage and disposal. Thus, fluorescent receptor ligands of high affinity are of interest as novel tools for characterization of the A3AR.
Fluorescent ligands for different AR subtypes have been used to study sub-cellular receptor localization [14], to quantify ligand-receptor interactions at the level of single cells [15] and as probes in receptor binding assays [16] in low or high throughput screening mode [17]. The use of fluorescent conjugates in ligand binding assays enables the real-time visualization and quantitation of the receptor and ligand-receptor interactions. Many of the fluorescent ligands used for binding assays or quantification of ARs are antagonists [16–18], which are suitable for labeling GPCRs on intact cells because they are not internalized, but agonists are useful for studying internalization. Therefore, our objective was the characterization of novel potent and selective fluorescent A3AR agonists to enable fluorescent binding experiments on intact cells and to allow the quantification of receptor internalization using flow cytometry (FCM) and fluorescence microscopy.
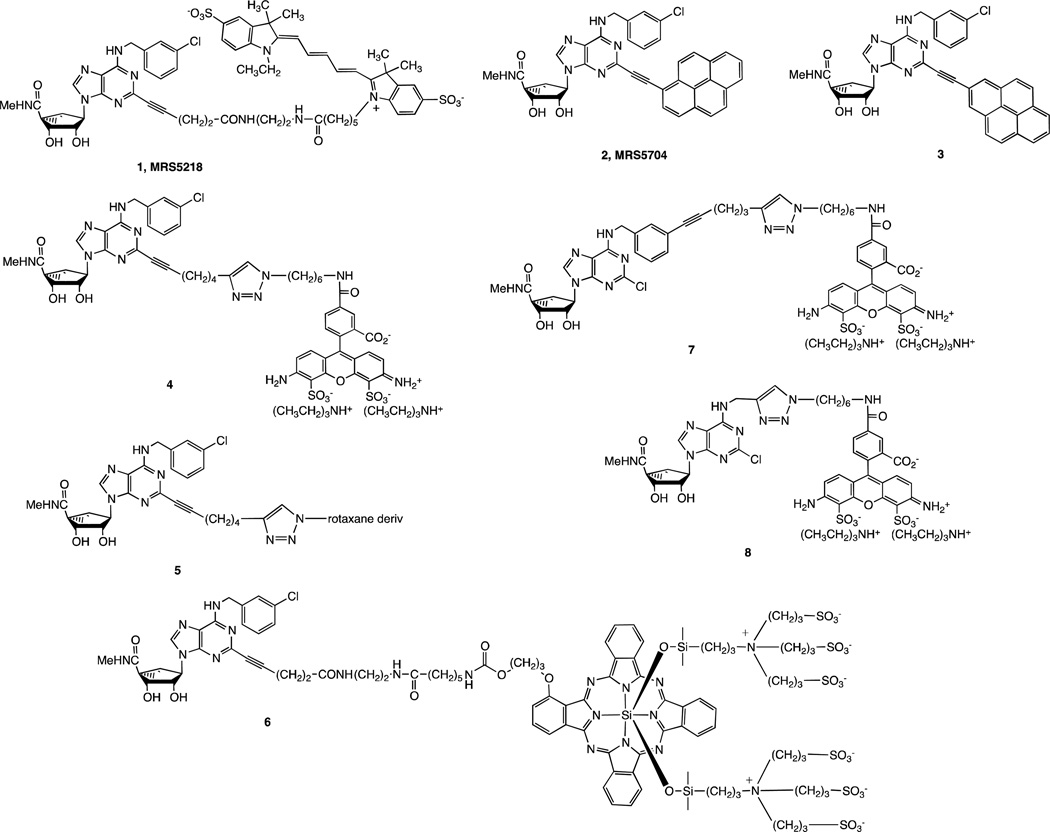
In this study, we compare the binding properties, potency and selectivity of eight fluorescent derivatives of adenine nucleosides (Figure 1), including five previously reported nucleosides (1 – 5) and three derivatives (6 – 8) prepared for this study. All contained a fluorophore linked through either the C2 or N6 position of the adenine ring. Furthermore, the rigid (N)-methanocarba ([3.1.0-bicyclohexane]) ring modification that enhances A3AR selectivity is present in all of the derivatives [19,20].
Figure 1.
Structures of the fluorescent A3AR agonist ligand probes used in this study.
2. Materials and methods
2.1. Reagents
Isomeric pyrene derivatives 2 (MRS5704) and 3 [21], C2-tethered Alexa Fluor 488 derivatives 1 (MRS5218) and 4 [19,22] and squaraine-rotaxane derivative 5 (structure of the fluorophore is undisclosed) [19] were prepared as described previously. IR dye 700 DX derivative 6 (C2-tethered) was prepared by amide formation, and Alexa Fluor 488 derivatives 7 and 8, both of which are N6-tethered, were synthesized by the general methods of click coupling of azido (fluorophore) and terminal alkyne (pharmacophore) components used to prepare a series of 1,2,3-triazole derivatives as A3AR agonists [20]. The Cy5 N-hydroxysuccinimide ester (variation containing an N-ethyl group) for preparation of 1 was purchased from GE Healthcare Life Sciences (Piscataway, NJ) or from Selleckchem.com (Houston, TX). The probes were purified using HPLC as described [20] to demonstrate >95% purity. Characterization by NMR using a 400MHz Advance™ III HD-NanoBay (Bruker BioSpin Corp., Billerica, MA, USA) and by high resolution mass spectrometry (proteomics optimized Micromass Q-TOF-2 (Waters, Milford, MA) using external calibration with polyalanine) confirmed the assigned structure.
The fluorescent probes were stored as solids at −80 °C and diluted with DMSO as concentrated stock solutions before the experiments. DMEM and F12 were purchased from Mediatech, Inc. (Herndon, VA), and hygromycin B and fetal bovine serum (FBS) were from Cellgro (Manassas, VA). Costar 6- 12- and 96-well plates, Penicillin-Streptomycin-Glutamine (PSG), G418, sucrose, Cl-IB-MECA and NECA were purchased from Sigma (St. Louis, MO). CGS21680, CPA, IB-MECA, MRS1220 and XAC were from Tocris R&D Systems, Inc. (Minneapolis, MN). Quantum Cy5 MESF beads for quantification of fluorescence intensity [31] were purchased from Bangs Laboratories, Inc. (Fishers, IN). [3H]R-N6-Phenylisopropyladenosine ([3H]R-PIA, 63 Ci/mmol), [125I]N6-(4-amino-3-iodobenzyl)adenosine-5′-N-methyluronamide ([125I]I-AB-MECA, 2200 Ci/mmol), and [3H](2-[p-(2-carboxyethyl)phenyl-ethylamino]-5′-N-ethylcarboxamido-adenosine) ([3H]CGS21680, 40.5 Ci/mmol) were purchased from PerkinElmer Life and Analytical Science (Boston, MA).
2.2. Absorbance and fluorescence measurements
The absorbance and the fluorescence spectra of 10 µM MRS5704 in DMSO, methanol, PBS or in Tris buffer and 2 µM MRS5218 in methanol was measured in a cuvette, using the corresponding solvent as reference. The effects of the addition of 50 µg/well cell membrane were measured in 96-well black plates using Tris buffer as a reference. The membranes were incubated at 22 °C with 70 nM, 200 nM or 1 µM MRS5704 and the fluorescence was measured after 5 min and 60 min. The final volume was 200 µl in each well. All spectra were measured with a SpectraMax M5 microplate reader (Molecular Devices, Sunnyvale, CA).
2.3. Cell cultures and ligand treatment
Chinese hamster ovary (CHO) cells stably expressing the human (h) A3AR were grown in DMEM/F12 (1:1) medium with 10% FBS, 2 mM L-glutamine, 50 U/ml penicillin/streptomycin in the presence of 500 µg/ml hygromycin B. Human embryonic kidney cells (HEK293) stably expressing mouse (m) ARs were grown in DMEM medium with 10% FBS, 2 mM L-glutamine, 50 U/ml penicillin/streptomycin, and 0.6 mg/ml G418. Cells used for FCM analysis were grown in 6-, 12- or 24-well plates (approximately 4 × 10⁵, 2 × 10⁵ or 1 × 10⁵ cells/well, respectively) and incubated at 37 °C for 24 h in the presence of 5% CO2. When the confluency reached 80% (approximately 106, 5 × 10⁵ or 2.5 × 10⁵ cells/well), medium was replaced with fresh medium in the presence or absence of 0.4 M sucrose, and MRS5218 was added in the presence or absence of a competitive agonist or antagonist. When the cells were incubated with sucrose-containing medium, there was a 15 min preincubation period before ligand was added. Cells were then incubated for up to 2 h at 4 or 37 °C. To study receptor internalization, after washing, cells were washed with 1 ml of ice-cold acid stripping buffer (DMEM with 0.2% BSA - bovine serum albumin - adjusted to pH 3.5 with HCl) three times for 5 min on shaking platform at 4 °C to remove surface bound ligand, and washed three times with ice-cold PBS for 5 min on shaking platform [23].
Competitive binding assays were performed as follows: CHO cells expressing the hA3AR were grown in 96-well plates. When the cells reached the 70% confluency, medium was changed to 0.2 ml fresh medium containing 0.4 M sucrose and cells were preincubated for 15 min. 30 nM MRS5218 was added along with increasing concentrations of the tested known AR igands. Cells were incubated for 1 h at 37 °C, then washed three times with 0.2 ml PBS. 0.2 ml 0.2 % EDTA was added to each well, incubated for 15 min at 37 °C and homogenized on shaker for 15 min at 24 °C at 700rpm.
HL-60 cells were obtained from the American Type Culture Collection (Manassas, VA) and grown in RPMI 1640 medium with 2 mM L-glutamine, 20% FBS, and antibiotics.
2.4. Radioligand binding assays (hARs)
Competition radioligand binding assays were conducted with cell membranes prepared from transfected CHO cells expressing hARs. For preparing cell membranes, after harvest and homogenization, the cells were centrifuged at 1000 × g for 5 min at 4 °C, and the pellet was resuspended in 50 mM Tris buffer (Tris–HCl buffer, pH 7.5, containing 10 mM MgCl2). The suspension was homogenized with an electric homogenizer for 10 s and recentrifuged at 25,000 × g for 30 min at 4 °C. The resultant membrane pellets were resuspended in buffer in the presence of 3 units/ml adenosine deaminase and incubated at 37 °C in a water bath for 1 h, and the suspension was stored at −80 °C until the binding experiments. The protein concentration was measured using the Bradford assay [24].
Into each tube in the binding assay was added 50 µl of increasing concentrations of the test ligand in Tris−HCl buffer (50 mM, pH 7.5) containing 10 mM MgCl2, 50 µl of the appropriate agonist radioligand, and finally 100 µl of membrane suspension. The agonist radioligands [3H]R-PIA (final concentration of 3.5 nM), [3H]CGS21680 (10 nM) and [125I]I-AB-MECA (0.34 nM) were used in assays with the hA1AR (22 μg protein/tube), the hA2AAR (20 µg/tube), and the hA3AR (21 µg/tube), respectively. Nonspecific binding was determined using a final concentration of 10 µM adenosine-5′-N-ethylcarboxamide (NECA) diluted with the buffer. The mixtures were incubated at 25 °C for 60 min in a shaking water bath. Binding reactions were terminated by filtration through Brandel GF/B filters under reduced pressure using an M-24 cell harvester (Brandel, Gaithersburg, MD). Filters were washed three times with 3 ml of 50 mM ice-cold Tris−HCl buffer (pH 7.5). Filters for A1 and A2AAR binding were placed in scintillation vials containing 5 ml of Hydrofluor scintillation buffer and counted using a Tri-Carb 2810TR Liquid Scintillation Analyzer (PerkinElmer, Waltham, MA). Filters for A3AR binding were counted using a Packard Cobra II γ-counter.
2.5. Radioligand binding assays (mARs)
Similar competition binding assays were conducted with HEK293 cell membranes expressing mARs using [125I]I-AB-MECA to label A1 or A3ARs and [3H]CGS21680 to label A2AARs [25]. Nonspecific binding was determined in the presence of 100 µM NECA.
2.6. Fluorescent microscopy experiments
CHO cells stably expressing the hA3AR were grown on sterile coverslips in 6-well plates, and experiments were performed when the cells reached 70% confluency after refreshing the medium. The cells were incubated with 70 nM MRS5218 for different time intervals ranging from 5 min to 2 h at 37 °C in an atmosphere containing 5% CO2. At the end of each time interval, the medium was removed, and cells were washed three times with ice-cold PBS (Crystalgen, Commack, NY). The coverslips containing the cells were placed on sterile slides, and the cells were observed under a Zeiss AxioCam MRm fluorescence microscope (Carl Zeiss, Inc., Thornwood, NY).
2.7. FCM calibration
To quantify the number of receptor-bound ligands, we used quantitative fluorescence calibration [31]. To convert measured fluorescence intensity (MFI) values into molecules of equivalent soluble fluorochrome (MESF) values, we used Quantum Cy5 MESF calibration beads and QuickCal program v. 2.3 (Bangs Laboratories, Inc., Fishers, IN) according to the instructions of the manufacturer.
2.8. Fluorescent ligand binding experiments with cells using FCM or with membranes in suspension
Fluorescent ligand binding experiments with cells using FCM were performed as follows. CHO or HEK293 cells expressing ARs were incubated with different concentrations of MRS5218 ranging from 5 nM to 1,000 nM for various times, as indicated, at 37 °C in 6-, 12- or 24-well plates. Nonspecific binding was determined in the presence of the selective nonfluorescent antagonist MRS1220 (10 µM) for studies with the hA3AR or with NECA (100 µM) in studies with the mA3AR. To determine the fraction of membrane-bound fluorescent agonist, we blocked the internalization of MRS5218 in some experiments with either a 15 min preincubation with 0.4 M sucrose containing media or an incubation at 4 °C [12,14,27].
Transfected CHO and HEK293 cells were prepared for FCM as described previously [16]. Briefly, cells were washed 3 times with ice-cold PBS, detached with 0.2 % EDTA, which was neutralized with media after 5 min incubation at 37 °C. Cell suspensions were transferred to polystyrene round-bottom BD Falcon tubes (BD, Franklin Lakes, NJ), and centrifuged twice at 400 × g for 5 min. Cells were then suspended in PBS and proceeded to FCM using a FACSCalibur flow cytometer (BD, Franklin Lakes, NJ), with a 635 nm laser. Mean fluorescent intensities (MFIs) were recorded in FL-4 channel in log mode. In competitive binding assays, cells were analyzed using an AMS system autosampler (Cytek, Fremont, CA) for a FACSCalibur. For FCM assays with undifferentiated HL-60 cells that grow in suspension, cells (1 × 10⁶ in 0.5 ml) were transferred to polystyrene tubes in culture media containing 20 mM HEPES (pH 7.4) and incubated with MRS5218 (300 nM) for 1 h, after which the cells were pelleted (400 × g for 5 min) and washed once with ice-cold PBS. The cells were resuspended in culture media with HEPES and subjected to analysis by FCM.
For FCM competitive binding experiments in hA3AR-CHO cells using MRS5218 as fluorescent tracer, cells were grown in 96-well plates. The cells were split to reach a final concentration of 2 × 10⁵ cells/ml in a round- or flat-bottom 96-well plate and used when confluency reached 70% (16 h). The medium was aspirated, and sucrose medium (0.2 ml of 0.4 M) was added to each well. After 15 min, MRS5218 (30 nM) and the test compound (at 5 different concentrations) were added in the wells. After 1 h incubation at 37 °C, the medium was aspirated, and cells were washed 3× with 0.2 ml PBS without calcium. Then cells were treated with 0.2 ml of 0.2 % EDTA solution in PBS without calcium and incubated at 37 °C for 15 min. The plate was then placed in a shaker for 15 min at 24 °C at 700 rpm.
2.7. Data analysis
All data were analyzed by non-linear least squares analysis and Ki values were calculated using Prism (GraphPad Software, San Diego, CA) for all assays. IC50 values were converted to Ki values as described [28].
3. Results
3.1. Prioritization of fluorescent probes based on radioligand binding affinity
The fluorescent derivatives were compared in radioligand binding affinity and selectivity at the hA3AR in membranes of receptor-expressing CHO cells (Table 1). It has already been shown that varying the fluorophore and the linker on the same pharmacophore affects the affinity of a fluorescent probe toward ARs [29,30]. Here we have compared the feasibility of fluorescent receptor labeling using conjugates in which the A3AR pharmacophore and fluorophore were linked through click chemistry to form a triazole ring (i.e. 4, 5, 7 and 8), by amide formation (1 and 6) or by a Sonogashira carbon−carbon bond forming reaction (2 and 3) [19,21,22]. The previously reported derivatives 1, MRS5218, and 2, MRS5704, displayed the highest affinity with Ki values of 17.2 and 68.3 nM, respectively [21,22]. These derivatives at 10 µM were also characterized as nearly full agonists of the A3AR in inhibition of adenylate cyclase in AR-transfected CHO cells, with 94.4% and 77.8% of maximal efficacy of NECA, respectively [21,22]. The remaining nucleoside derivatives (3 – 8) containing various fluorophores tethered from the adenine C2 or N6 position were less potent in hA3AR binding. Furthermore, MRS5218 was shown to be a full agonist at the A3AR [22]. Therefore, MRS5218 and MRS5704 were the most promising derivatives for comparison in subsequent experiments using whole cells.
Table 1.
Binding assays of fluorescent adenosine derivatives at three ARs (human ARs, and mouse ARs for compound 2). Structures are shown in Figure 1. When a reference is given, the Ki values listed appear in that source.
| Compound | Fluorophore | Ki (nM) or % inhibitiona | Efficacyb | Ref. | ||
|---|---|---|---|---|---|---|
| A1AR | A2AAR | A3AR | A3AR | |||
|
1, MRS5218 |
Cy5 | h: 36% | 4730 | 17.2 | 94.4% | [22] |
| m: 143±10c | 717±19c | 261±29c | NDc | N/A | ||
|
2, MRS5704 |
4-pyrene | 8% | 3110 | 68.3 | 77.8% | [21] |
| 3 | 1-pyrene | 11% | 4% | 660 | 97.1% | [21] |
| 4 | AlexaFluor 488 | 0% | 23% | 416 | 37.8% | [19] |
| 5 | Squaraine- Rotaxane |
0% | 2% | 239 | 111% | [19] |
| 6 | IR700DX | ND | ND | 1320±110 | ND | N/A |
| 7 | Alexa Fluor 488 | 12±4% | 7±2% | 400±210 | ND | N/A |
| 8 | Alexa Fluor 488 | 1860±440 | 46% | 290±50 | ND | N/A |
ND, not determined. N/A, not applicable.
Binding in membranes of CHO or HEK293 (A2A only) cells stably expressing one of three hAR subtypes. The binding affinity for A1, A2A and A3ARs was expressed as Ki values using agonist radioligands [3H]N6-R-phenylisopropyladenosine (R-PIA), [3H]2-[p-(2-carboxyethyl)phenyl-ethylamino]-5′-N-ethylcarboxamido-adenosine (CGS21680), or [125I]N6-(4-amino-3-iodobenzyl)adenosine-5′-N-methyl-uronamide (I-AB-MECA), respectively. A percent in parentheses refers to inhibition of binding at 10 µM.
In inhibition of forskolin-stimulated cyclic AMP production in hA3AR-transfected CHO cells. At 10 µM, in comparison to the maximal effect of 10 µM 5′-N-ethylcarboxamidoadenosine (=100%). Data are expressed as mean±standard error (n = 3, unless noted). Data from Tosh et al. [19,21,22].
Competition radioligand binding assays using [125I]I-AB-MECA (A1 and A3ARs) and [3H]CGS21680 (A2AAR) were conducted with membranes prepared from HEK293 cells expressing recombinant mA1, A2A, or A3ARs. The data (n = 3–4) are expressed as Ki values. A percent in parentheses refers to inhibition of radioligand binding at 10 µM. ND, not determined. N/A, not applicable.
Both MRS5218 and MRS5704 [19,20] contained a fluorophore linked through the C2 position of the adenine ring. Furthermore, N6-(3-chlorobenzyl) and rigid (N)-methanocarba ring modifications that enhanced A3AR selectivity were present. In one case (MRS5218), the fluorophore, Cy5 (a cyanine dye that absorbs in the orange region and fluoresces in the red region), was tethered at a distance from the C2 position by a flexible amide chain. In the other case (MRS5704), the fluorophore consisted of a rigid polycyclic 1-pyrenyl moiety that was coupled to the pharmacophore through an ethynyl group extending from the C2 position.
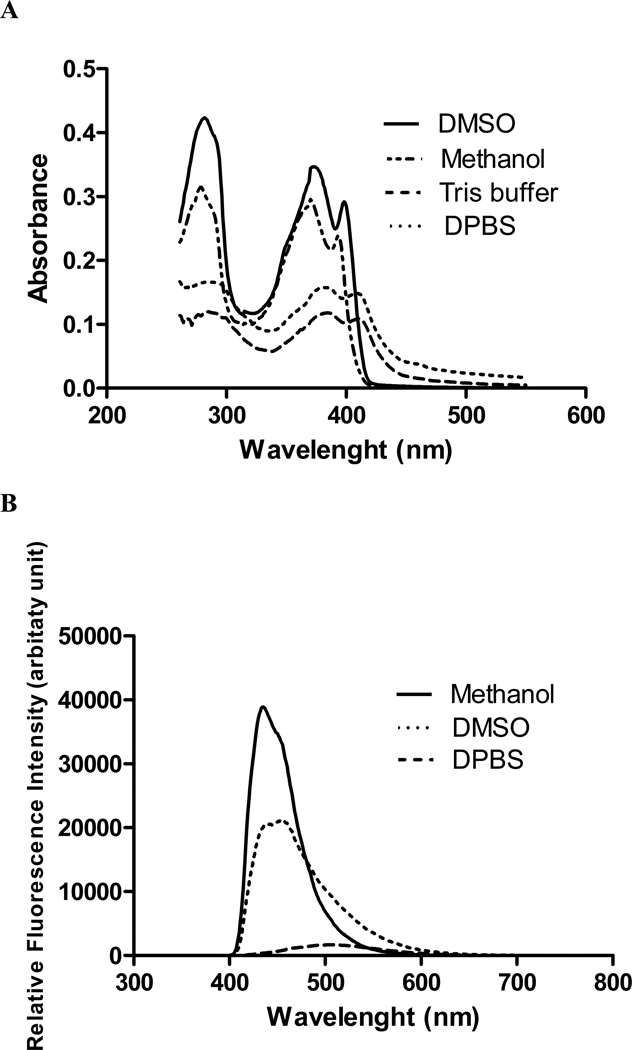
The lipid-dependent interactions of pyrene fluorophores with artificial membranes have been studied [31]. As expected, the absorption and emission spectra of the pyrene derivative MRS5704 were solvent-dependent (Figure 2). The extended conjugated system of MRS5704 was found to provide a longer wavelength of emission in methanol (~430 nm) than pyrene itself (~390 nm). To test receptor binding, we measured the changes in fluorescence with different concentrations of MRS5704 upon adding 50 µg/well hA3AR-expressing CHO cell membranes and incubating for 5 or 60 min (data not shown). Excitation was at 384 nm, and the fluorescence was measured at 430 and 508 nm. The fluorescence at 508 nm varied solely with the concentration of MRS5704 and was independent of the amount of membrane added. However, the fluorescence at 430 nm was dependent not only on the concentration, but on the incubation time as well. Increasing the concentration of cell membranes in the suspension significantly increased the fluorescence of MRS5704, which could not be blocked at any wavelength in the presence of hA3AR antagonist MRS1220 (10 µM). Therefore, the changes in fluorescence were not dependent on a specific interaction with the hA3AR in membranes.
Figure 2.
A. Absorbance spectra of 10 µM MRS5704 in solvents of different polarity (DMSO, methanol, Tris buffer, PBS). All spectra were recorded using a SpectraMax M5 microplate reader with a cuvette (solution) or 96-well black plates (membranes). MRS5704 in DMSO solution has three maxima in the absorbance spectra at 282, 372 and 398 nm. However, in more polar buffers like methanol or PBS, the absorption is lower and slightly red-shifted with maxima at 285, 384 and 410 nm. B. Fluorescence spectra of 10 µM MRS5704 in DMSO and PBS using 384 nm excitation wavelength. MRS5704 shows maximum at 508 nm in PBS and at 437 and 455 nm in DMSO. It is noteworthy that the fluorescence in a more polar solvent (PBS) not only shifted to longer wavelength, but the amplitude was significantly decreased.
MRS5704 was examined using FCM in AR-expressing HEK293 cells, and under these conditions it also failed to show specific fluorescent binding to the mA3AR or hA3AR. The traces from A3AR-expressing cells and from control cells were nearly identical. Therefore, the Cy5 derivative MRS5218 was used in subsequent fluorescent experiments with the A3AR due to its specific binding, relatively high affinity and fluorescence emission spectrum that does not overlap autofluorescence of the cells.
3.2. Fluorescence microscopy experiments
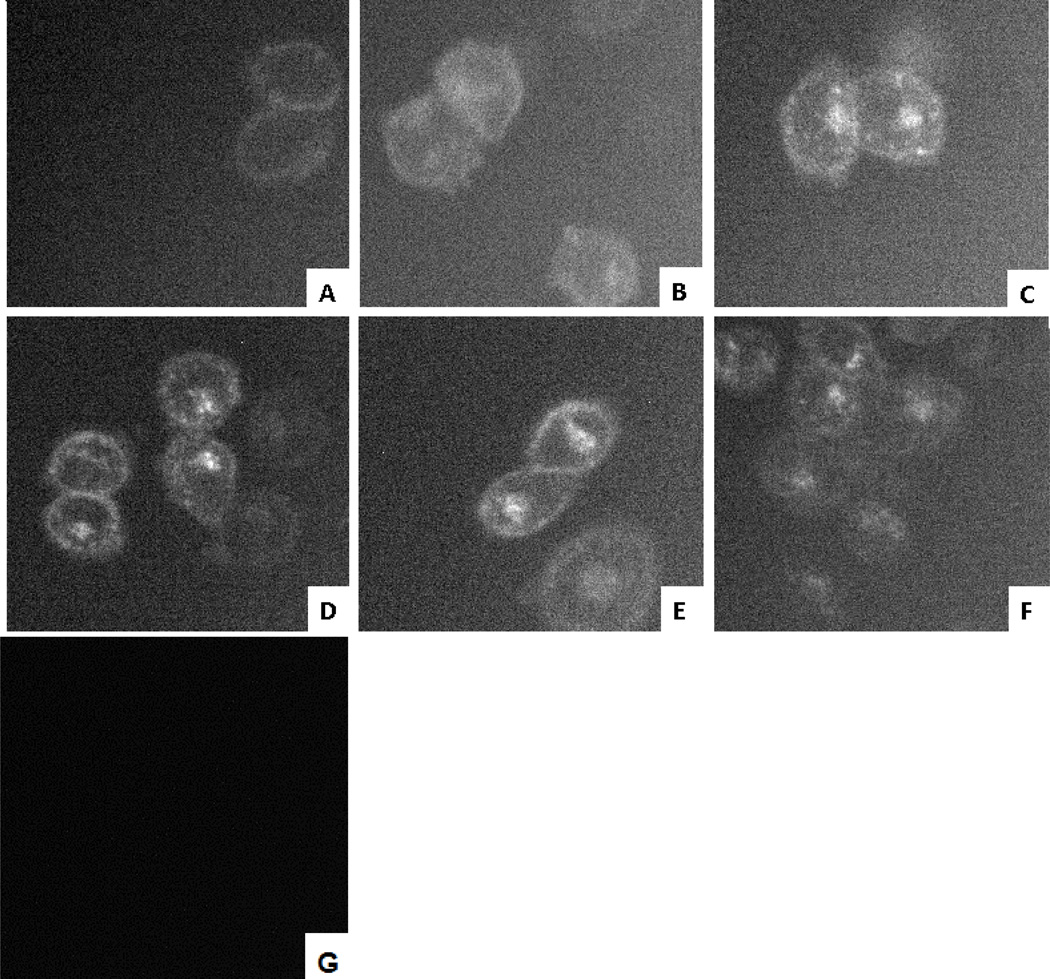
The absorption and emission spectra of MRS5218 were determined in methanol (data not shown) indicating peak absorption at 650 nm and peak emission at 674 nm. With these fluorescence parameters typical of Cy5, the time course of binding to whole cells was probed microscopically. Fluorescence micrographs showing the binding of 70 nM MRS5218 to the hA3AR expressed in CHO cells at different time points are shown in Figure 3. After a 5 min incubation period, the fluorescence was highly associated with the plasma membrane, but with longer time periods it progressively became more associated with the intracellular compartment and less with the cell membrane. After 2 h incubation with hA3AR-expressing CHO cells, the fluorescence was mainly intracellular. This was consistent with the rapid characteristic desensitization and internalization of the hA3AR upon agonist binding, as reviewed by Klaasse et al. [8]. In the corresponding control experiments performed in the absence of MRS5218, cell fluorescence was not observed, due to the lack of autofluorescence of cells at the excitation wavelength of the Cy5 dye (674 nm).
Figure 3.
Fluorescence micrograph of 70 nM MRS5218 bound to hA3AR expressed by CHO cells following incubation for the indicated times: A) 5 min; B) 15 min; C) 30 min; D) 60 min; E) 90 min; F) 120 min. hA3AR-expressing CHO cells in the absence of any fluorescence ligand were used as controls, but cell fluorescence was not observed. The images were acquired with Zeiss Axioimager D1 equipped with a filter set 50 (Zeiss) with excitation and emission wavelengths at BP640/30 nm and BP690/50 nm, respectively.
3.3. Fluorescent ligand binding experiments with FCM
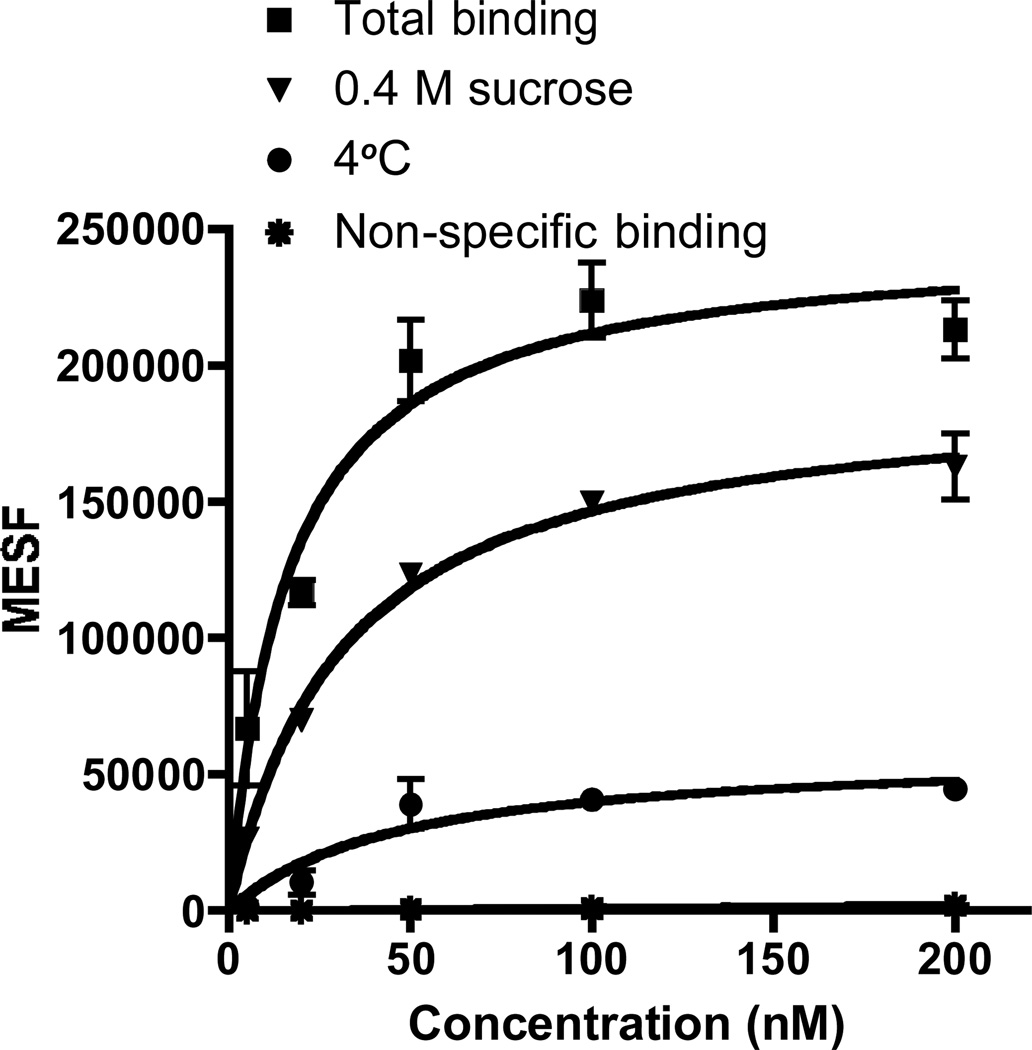
We varied the concentration of fluorescent ligand MRS5218 from 5 nM to 200 nM and used FCM to determine the measured fluorescence intensity (MFI) of the ligand present on or within the cell, i.e. either receptor-bound at the surface or internalized. Saturation curves for binding of MRS5218 to CHO cells expressing the hA3AR were obtained using Molecules of Equivalent Soluble Fluorochrome (MESF) values (Figure 4) [26]. CHO cells expressing the hA3AR were used to measure autofluorescence in the absence of fluorescence ligand, and nonspecific binding was measured in the presence of both MRS5218 and 10 µM MRS1220. The specific binding of fluorescent signal to the cells appeared to be saturable, and the ratio of specific to nonspecific binding was very high. From the saturation curve, an apparent binding constant (Kd app) was determined to be 16.1±4.3 nM. This parameter is not directly comparable to a Kd determined for equilibrium binding to a cell surface receptor, because it is likely to represent a composite of surface binding of the label and receptor internalization processes.
Figure 4.
Saturation binding assays with MRS5218 using FCM following incubation for 1 h with the hA3AR expressed in CHO cells in the absence or presence of different inhibitors of receptor internalization. Fluorescent intensity values of small molecule-cell conjugates were measured using a FACSCalibur flow cytometer (BD, Franklin Lakes, NJ) with a 635 nm laser, FL4 channel and log mode and Cell Quest Pro software (BD, Franklin Lakes, NJ). MFIs were converted to MESF (Figures S5 and S6) values using QuickCal program v. 2.3 (Bangs Laboratories, Inc., Fishers, IN). Nonspecific binding was measured in the presence of 10 µM MRS1220. The apparent Kd values were determined to be 16.1±4.3 nM (without blocking internalization), 31.4±4.6 nM (0.4 M sucrose in the media) and 46.9±23.5 nM (4 °C incubation). Results are expressed as mean ± S.E. (n=3).
The binding saturation procedure was modified to separate surface-bound label from internalized fluorescence. Incubation for one hour at 4 °C or treatment with sucrose, both of which are known to inhibit the internalization of cell surface GPCRs [12], significantly lowered the maximal fluorescent intensity (Bmax=58,655 and 192,689 MESF, respectively, compared to Bmax=245,974 MESF using 37 °C incubation in sucrose-free media), with Kd app values of 46.9±23.5 nM and 31.4±4.6 nM , respectively (Figure 4). At low temperature, the rate of ligandreceptor binding will be slower (similar to other AR agonists [32]), which may explain why the slope of the curve at 4 °C was less steep than that of the sucrose curve.
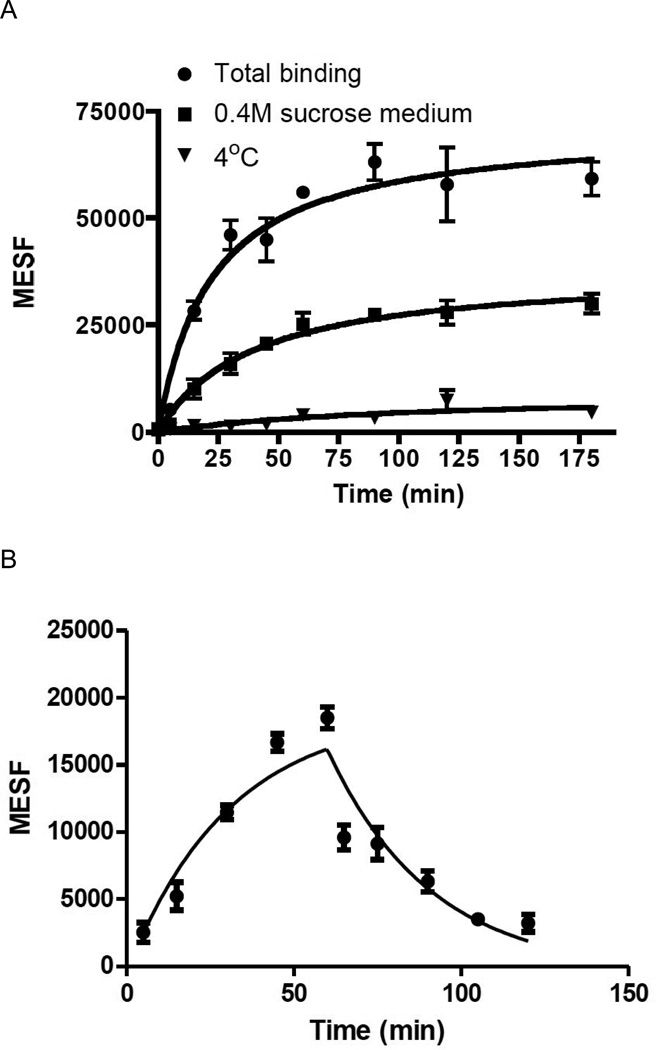
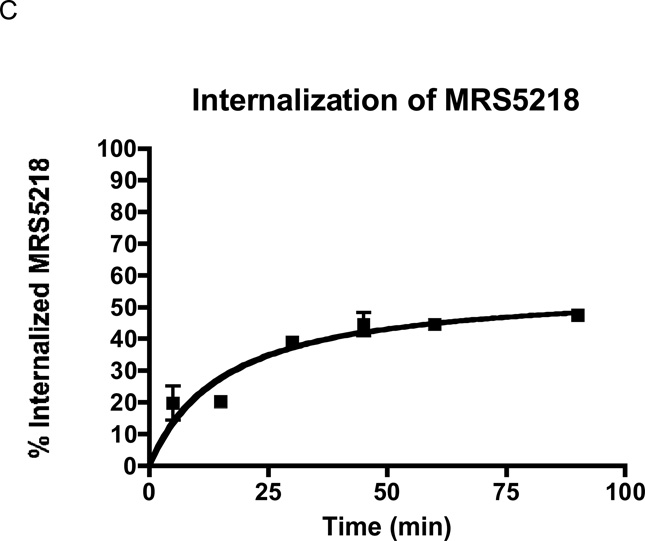
The kinetics of MRS5218 binding in CHO cells expressing the hA3AR was studied using FCM. The rate of association of the fluorescently labeled MRS5218 (30 nM) was measured in the absence or presence of 0.4 M sucrose. We found that the association of the fluorescent compound occurred rapidly (within 30 min), and by the end of the incubation period about half of the observed fluorescence was internalized (Figure 5A). The association of MRS5218 was slower when receptor internalization was blocked (t1/2=17.6 min in sucrose-free media and 26.4 min in sucrose-containing media).
Figure 5.
Kinetics of MRS5218 binding to the hA3AR expressed in CHO cells determined using FCM. Each graph represents the average of three experiments. A) Association in the absence or presence of 0.4 M sucrose at 37°C and in absence of sucrose at 4°C. Cells were incubated with 30 nM MRS5218 for different time intervals from 5 min to 180 min. The observed association rate constant (K) was 0.039 min−1 for the incubation in absence of sucrose at 37°C, K = 0.026 min−1 for the incubation in presence of sucrose at 37°C and K = 0.013 min−1 for the incubation at 4°C, determined by fitting a one phase exponential association equation to the obtained data. B) Association followed by dissociation of MRS5218 (30 nM) initiated at 60 min by the addition of 10 µM MRS1220, measured in the presence of 0.4 M sucrose at 37°C. The observed t1/2 of the dissociation was 21.4 min. C) Internalization kinetics of 30 nM MRS5218. Cells were incubated with 30 nM MRS5218 for different time intervals from 5 min to 90 min. Internalized amount (%int) was calculated as the acid insensitive fluorescence at x time point (MESFx) compared to total MESF (MESFtotal) and corrected with the nonspecific binding (MESFnonspec): %int = (MESFx - MESFnonspec) / (MESFtotal - MESFnonspec). The acid-insensitive binding of MRS5218 was measured after removing cell-surface bound ligand by 3 × 5 min acid wash (pH 3.5). After 90 min of incubation, the percentage of internalized MRS5218 was 47.6%. The t1/2 of the internalization was 12.9 min.
The rate of dissociation of the fluorescent label from CHO cells expressing the hA3AR was measured by FCM (Figure 5B). Dissociation of MRS5218 (30 nM), in the presence of 0.4 M sucrose to prevent internalization, was initiated after 60 min of incubation at 37 °C by adding 10 µM MRS1220. A t1/2 value of 21.4 min for dissociation of surface-bound fluorescence was observed. The rate and degree of internalization of fluorescent agonist were determined as follows. Cells were incubated with 30 nM MRS5218 for different time intervals at 37 °C, and cell-surface bound ligands were removed using three 5 min washes with medium at pH 3.5. The remaining cell fluorescence represented internalized MRS5218, which was measured by FCM. The t1/2 of internalization was 12.9 min, and it reached a plateau after 45 min (Figure 5C), at which point roughly 50% of the fluorescent label was internalized, i.e. similar to the fraction of internalization as determined with inhibition by sucrose.
Competition for fluorescent binding with known AR ligands was performed using FCM in the presence of sucrose. To determine the Ki values of known ligands, we used MRS5218 as a tracer, at a concentration of 30 nM (close to its Kd value). Competitive binding results with known agonists and chemically diverse antagonists are shown in Table 2. The observed pharmacology of agonists in this whole cell FCM assay (Figure 6) corresponded to that previously observed for the hA3AR. However, the correspondence of the affinity of known antagonists with that determined by FCM was mixed, i.e. the determined affinity of MRS1220 was roughly 10-fold lower than its known hA3AR binding affinity and the affinity of XAC was closer to the previously reported value.
Table 2 .
Inhibition of A3AR binding of known AR agonists and antagonists using MRS5218 (30 nM) as a FCM tracer in whole cells.a
| Compound | hA3AR radioligand binding, Ki (nM)b |
FCM binding at hA3AR, Ki(nM) |
|---|---|---|
| Agonists | ||
| Cl-IB-MECA | 1.4 | 1.3±0.3 |
| IB-MECA | 1.8 | 2.7±0.4 |
| NECA | 25 | 73.6±7.9 |
| CPA | 72 | 88.4±13.6 |
| Antagonists | ||
| MRS1220 | 0.65 | 5.9±0.7 |
| XAC | 13.8 | 17.6±3.6 |
Incubation of A3AR-expressing CHO cells with MRS5218 (30 nM) for 60 min at 37 °C was performed in the presence of 0.4 M sucrose (60 min). The inhibitors were added 15 min prior to the fluorescent tracer. Ki values represent the mean of at least three replicates.
Ki values for A3AR binding affinity in cell membrane preparations using [125I]I-AB-MECA are reported [16 and references therein].
Figure 6.
Inhibition of fluorescent binding by known AR ligands (Cl-IB-MECA, CPA and XAC) using FCM. Competitive binding assay was performed using CHO cells expressing the hA3AR incubated with 30 nM MRS5218 and increasing concentrations of the adenosine receptor ligands for 60 min at 37 °C in the presence of 0.4 M sucrose. The Ki values are (nM) 1.3±0.3, 88.4±13.5 and 17.6±3.6; respectively. Results are expressed as mean±S.E. (n = 3).
3.4. Radioligand binding and fluorescent binding with FCM at mARs
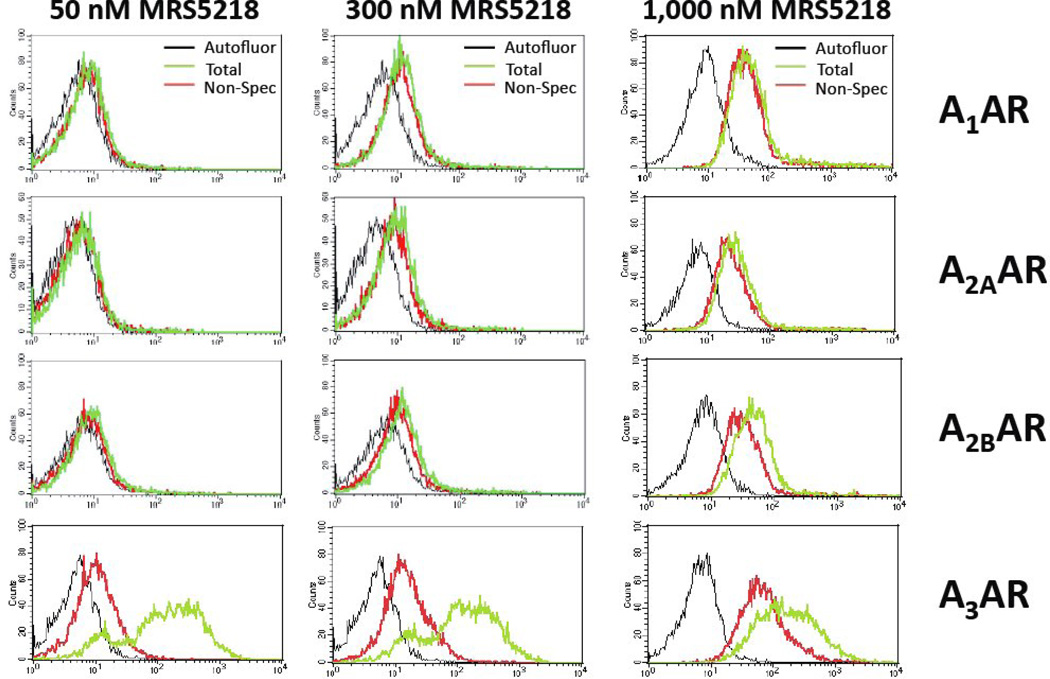
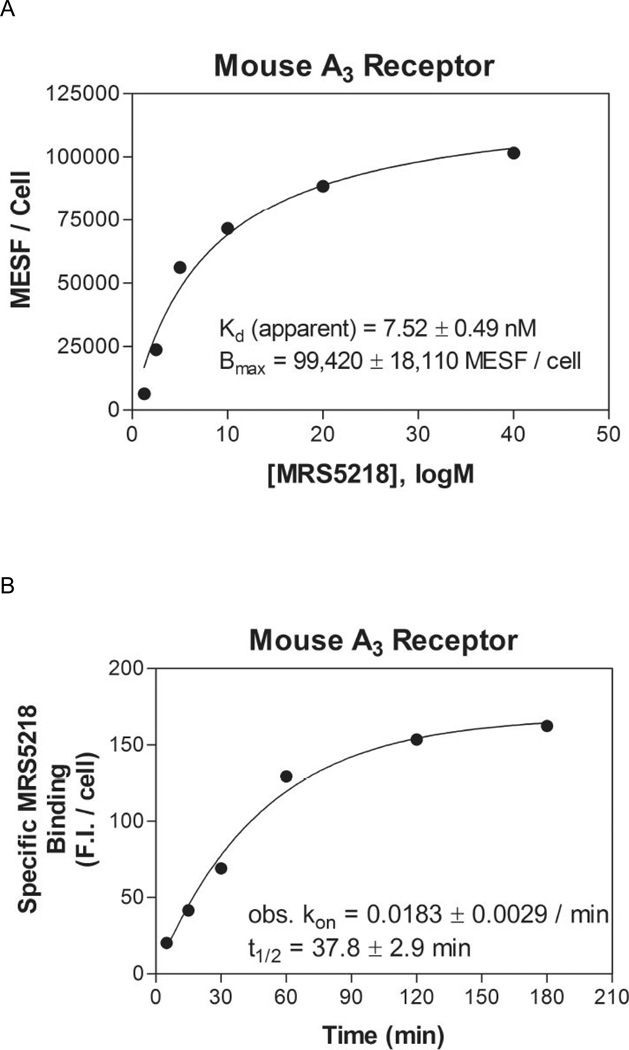
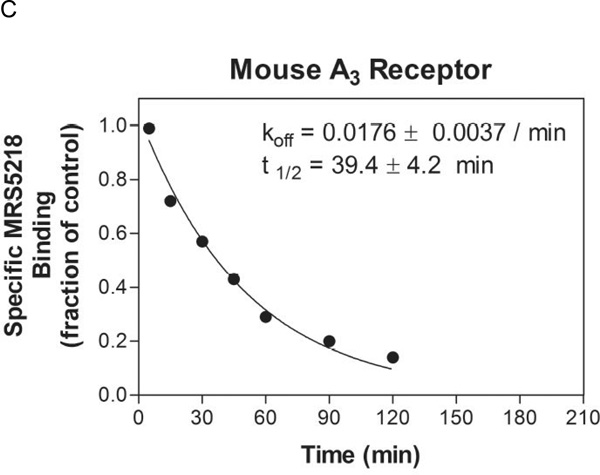
In the radioligand binding assays in membranes of mAR-expressing HEK cells (Table 1), MRS5218 was found to bind with moderate affinity at the mA3AR (Ki 261 nM) but not selectively in comparison to mA1AR (Ki 143 nM) and mA2AAR (Ki 717 nM). However, in FCM assays with whole cells, MRS5218 at concentrations as high as 300 nM specifically labeled mA3AR-HEK293 cells versus cells expressing other AR subtypes (Figure 7). At a concentration of 1 µM, specific binding of MRS5218 to mA2BAR-HEK293 cells became detectable (Figure 7), but this was not observed for mA1 or mA2AAR subtypes. In saturations assays with whole cells, MRS5218 was found to bind to the mA3AR in the absence of sucrose with a Kd app of 7.52±0.49 nM, which is substantially lower than that determined in radioligand binding assays with membranes (Table 1), and with a Bmax of 99,420±18,110 MESF/cell (Figure 8A). In kinetic FCM binding assays, MRS5218 (5 nM) associated rapidly (t1/2 = 37.8±2.9 min) with the mA3AR (Figure 8B). After incubation at a concentration of 5 nM for 2 h to achieve equilibrium, the t1/2 for MRS5218 to dissociate from mA3AR-expresssing HEK293 cells was observed to be 39.4±4.2 min (Figure 8C). The binding affinity (Kd) of MRS5218 determined from the kinetic binding data was calculated to be ~126 nM according to the following equation: [Kd = Koff / (obs Kon – Koff/ ligand concentration)].
Figure 7.
Flow assays using HEK293 cells expressing mARs. The cells were incubated with 50, 300 or 1,000 nM MRS5218 for 2 h before being prepared for analysis by FCM. Non-specific binding was determined in these assays by including 100 µM NECA in the incubations. Histograms plotting cell counts versus mean fluorescence intensity per cell is shown.
Figure 8.
A) Saturation binding in FCM assays using HEK293 cells expressing the mA3AR. The data are plotted as MESF values versus the concentration of MRS5218. B) Association and C) dissociation kinetics of MRS5218 binding to the mA3AR expressed in HEK293 cells by FCM. For the saturation assays, the cells were incubated with increasing concentrations of MRS5218 for 2 h prior to measurement of fluorescence. In the kinetic binding assays, MRS5218 was used at a concentration of 5 nM. Cells were incubated with MRS5218 for 2 h in the dissociation studies after which fluorescence was measured at the times indicated following the addition of NECA (100 µM). Results of a representative experiment performed in triplicate are shown. Average binding parameters (mean±SEM) from three experiments are summarized in the figures.
3.5. FCM binding experiments with HL-60 cells
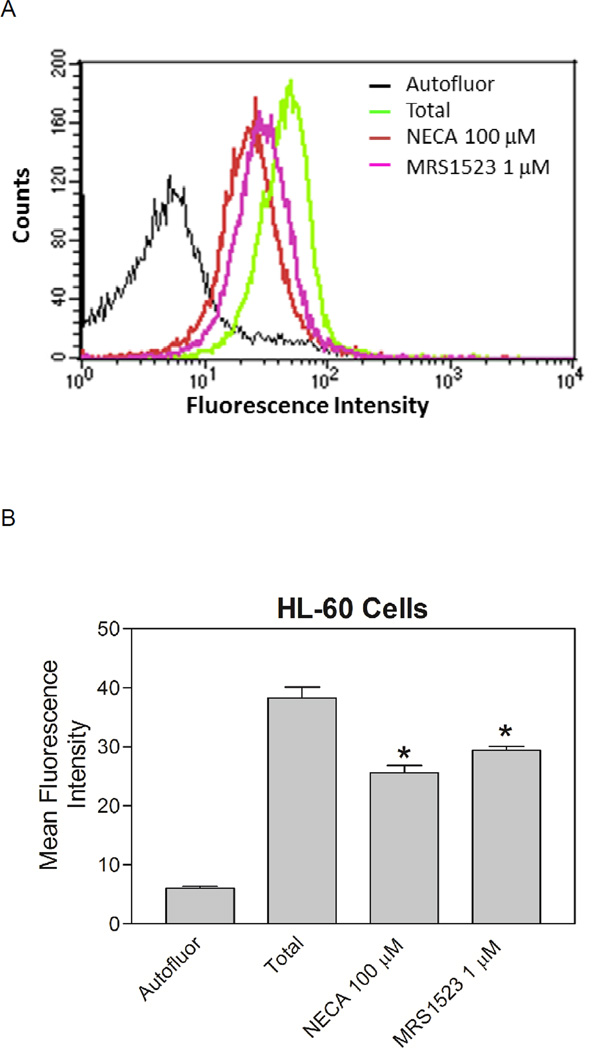
We examined if the specific binding of MRS5218 to the A3AR could be seen in a native cell line expressing the receptor. Human promyelocytic leukemic HL-60 cells, which have been reported to express the A3AR [33], were incubated with 300 nM MRS5218 for 1 h in the presence of 100 nM XAC to prevent binding to A1, A2A and A2BARs; the cells were washed and then subjected to analysis by FCM. As shown in Figure 9, specific binding of MRS5218 to HL-60 cells was detected in these assays, which appears to be attributable to binding to the A3AR based on displacement by 1 µM of the potent, selective A3AR antagonist MRS1523 [34]. The extent of displacement by MRS1523 was similar to that produced by 1 µM NECA.
Figure 9.
Flow assays using HL-60 cells. Cells were incubated with 300 nM MRS5218 for 1 h in the presence of 100 nM XAC before being prepared for analysis by FCM. Binding was determined after the addition of 100 µM NECA or 1 µM MRS1523. A) Histogram data from a representative experiment plotting cell counts versus fluorescence intensity. B) Averaged data (mean±SEM) from 6 independent experiments. * P<0.05 versus total binding by one-way ANOVA followed by post-hoc analysis using a t-test and the Bonferoni correction.
4. Discussion
Three new fluorescent nucleosides were synthesized in the series of (N)-methanocarba adenosine derivatives, which has members with excellent selectivity and sub-nanomolar potency toward the hA3AR [19,21,22]. In order to be able to visualize the A3AR, various fluorophores with different linker lengths were attached through the N6 position or through an ethynyl group extending from the C2 position. The 5′-N-methyluronamide group was included in all for the purpose of maximizing A3AR agonist efficacy, and the (N)-methanocarba modification of the ribose ring tended to increase selectivity. A total of eight fluorescent nucleosides were compared; based on human A3AR binding affinity and bound fluorescence, we narrowed the group to the most promising derivatives, MRS5218 and MRS5704, and studied their interaction with cells expressing the human or mouse A3AR. In both cases, the adenosine pharmacophore contained a 3-Cl-substituted N6-benzyl group that favored affinity/selectivity at the A3AR.
During spectral characterization, we could not observe the well-known vibrational structure in the absorption spectra of MRS5704, which corresponds to the previously described behavior of pyrene derivatives; it has already been reported that the vibrational structure of the pyrene absorption spectra is lost upon more complex derivatization. Here, MRS5704 contains attached adenine and ethynyl moieties that may be able to interact with the π-system of pyrene, especially in polar solvents [35].
The fluorescence spectra of pyrene-containing molecules typically increases upon increasing solvent polarity [36]. However, we observed a significant decrease in the fluorescence and also in the absorption of the pyrene derivative MRS5704. This altered behavior may derive from the different molecular structure, the different excitation wavelength used or from aggregaton of the hydrophobic solute created upon serial dilution with PBS [37].
We proposed that upon transfer from a polar to a nonpolar environment (i.e. upon receptor binding) we would observe changes in fluorescence intensity. We recorded increases in fluorescence upon membrane addition; however, the cell-bound fluorescence of MRS5704 proved to be unrelated to receptor binding. It has been reported that due to its apolarity, the pyrene moiety tends to bind preferentially nonspecifically within the phospholipid bilayer [38]. Our ligand has increased fluorescence in non-polar solvents, unlike previous observations with pyrene and its less complex derivatives, and a similar increase in fluorescence upon membrane binding was consistent with nonspecific membrane localization.
Therefore, MRS5704 was found to be too hydrophobic to be used as a ligand binding probe for the A3AR. Thus, in designing new fluorescent ligands for GPCRs, it is necessary to take into account other physicochemical properties, in addition to the receptor binding affinity.
However, MRS5218 was a useful fluorescent probe for characterizing the A3AR. At 30 nM, roughly half of the bound fluorescence after 90 min incubation period was internalized, as determined using acid wash and sucrose, in qualitative agreement with the microscopic images (Figure 3). Unlike antagonist ligands of the A3AR and other GPCRs that bind predominantly at the cell surface [16], the agonist probes are internalized by well-characterized processes [8].
Trincavelli et al. investigated agonist-induced endocytosis and recycling of the hA3AR using [125I]AB-MECA with CHO cells expressing the A3AR, and they found that the internalization occurs with a t1/2 of 17 min [11, 12]. However, removal of the agonist led to recycling of the receptors with a t1/2 of 35 min, while the cAMP signal was resensitized within 120 min. A fluorescently-labeled agonist of the Gs-coupled A2AAR stimulated adenylyl cyclase and was a useful tool for tracking receptor internalization [14]. Using hyperosmolaric sucrose to inhibit clathrin-mediated endocytosis, internalization of this label and its localization to early endosomes were shown to be receptor-dependent via clathrin-coated vesicles. Similarly, in the present study, sucrose inhibited internalization of a fluorescent agonist of the Gi-coupled A3AR.
For use with whole cells, as in FCM, the agonist fluorescent probes provide an advantage over antagonists in the determination of the relative level of expression of the receptor, because the internalization concentrates such probes intracellularly. Thus, binding of a fluorescent agonist can provide an amplification process to increase the signal, which could be particularly valuable when the receptor surface expression level is low. In addition, it indicates the initial presence of receptors capable of activation on the cell surface. In the present studies, we provide evidence that MRS5218 may be useful in detecting surface expression of the A3AR in the human HL-60 promyelocytic cell line by FCM, although further validation experiments using “knock-down” approaches are required. Chen and colleagues [33] previously demonstrated that HL-60 cells prominently express the A3AR, which is involved in amplifying signaling cascades involved in chemotaxis, and its expression increased upon differentiation. Several A3AR-selective ligands currently in clinical development are agonists [2]. Therefore, by this method one can detect and perhaps quantify the presence on the cell surface of receptors that are amenable to modulation by agonist ligands.
The nonspecific binding associated with MRS5218, determined by co-administration of either a potent, nonfluorescent A3AR antagonist (MRS1220) or a potent agonist (NECA), was too low to quantify (Figure 4). This indicated that the majority of the fluorescent label bound to the cell and entered through receptor-mediated processes, rather than by nonspecific membrane association or diffusion.
We found that the Ki value for MRS5218 determined using CHO cell membranes expressing the hA3AR and [125I]I-AB-MECA (17.2 nM) was comparable to the apparent binding constant (Kd app 31.4 nM) determined by saturation using the FCM assay with intact cells in the absence of sucrose. In contrast, a much higher affinity of MRS5218 was calculated with intact HEK293 cells expressing the mA3AR compared to assays with membrane preparations (~35-fold higher Kd value). It has been reported that GPCRs can assume multiple agonist-selective active conformations due to protein-protein interactions, which can lead to changes in binding affinity and intracellular signaling mechanisms (biased agonism) [39]. These interactions can vary between cell types for the same receptor. Therefore, we speculate that the differences in binding affinity observed in assays with intact cells and isolated membranes may be related to loss of the influence of allosteric interactions with intracellular proteins. The binding affinity in cell-based assays of a given ligand can also be influenced by dynamic processes, such as regulation of G protein coupling and cellular trafficking of the receptors [8]. The influence of these processes, which likely vary between cell types, might also account for the differences observed between the experiments. These processes might also underlie the different Kd values calculated for MRS5218 binding to the murine A3AR in FCM assays when using results from kinetic binding assays versus equilibrium saturation binding assays. Considering that roughly half of the fluorescence detected in the FCM assays reflected binding to receptors that had been internalized, it was somewhat surprising that the dissociation rate of MRS5218 was found to be so rapid. This observation further supports the idea that the A3AR recycles rapidly following agonist exposure. The dynamic nature of the A3AR compared to the other AR subtypes might explain the observation that MRS5218 exhibited binding selectivity for the A3AR in the cell-based binding assays with murine receptors.
A further advantage of a fluorescent agonist probe for the A3AR is in the screening of agonist ligands. The use of antagonist fluorescent probe MRS5449 was previously shown to be suitable for screening of antagonists, but not agonists in whole cells using FCM [16]. Here, we observed the converse, i.e. FCM competition for fluorescent binding with known AR agonists, but antagonist affinities did not consistently reflect expected affinities. This might relate to the fact that the radioligand binding Ki values were determined in cell membranes and the FCM assay in whole cells.
In conclusion, we now have identified a preferred fluorescent agonist ligand MRS5218 that is selective for the A3AR and displays relatively high affinity and low nonspecific binding in various models. The far red-fluorescing cyanine5 dye avoids interference from the autofluorescence of cells. The feasibility of using this click-linked conjugate has been demonstrated at both human and mouse A3ARs, and the affinities of known AR agonists at the hA3AR were correctly determined. The amount of fluorescence specifically bound to receptors on the surface of hA3AR-expressing cells can be separated from internalized label by various methods to demonstrate that at least half of the cell-associated label internalized rapidly corresponding to the known properties of the A3AR. This probe now can be added to the armamentarium of fluorescent ligands that may be utilized in drug discovery for various AR subtypes.
Acknowledgements
This research was supported by the National Institutes of Health (R01HL077707) and the Intramural Research Program of National Institute of Diabetes and Digestive and Kidney Diseases). EK thanks the Hungarian-American Enterprise Scholarship Foundation (HAESF) for financial support. LS thanks the University of Florence, Italy for financial support.
Abbreviations
- cAMP
3′,5′-cyclic adenosine monophosphate
- CHO
Chinese hamster ovary
- Cl-IB-MECA
1-[2-chloro-6-[[(3-iodophenyl)methyl]amino]-9H-purin-9-yl]-1-deoxy-N-methyl-β-D-ribofuranuronamide
- DMEM
Dulbecco's Modified Eagle Medium
- DMSO
dimethyl sulfoxide
- FBS
fetal bovine serum
- PBS
phosphate buffered saline
- FCM
flow cytometry
- GPCR
G protein-coupled receptor
- HEK
human embryonic kidney
- [125I]I-AB-MECA
[125I]4-amino-3-iodobenzyl-5′-N-methylcarboxamidoadenosine
- IB-MECA
1-deoxy-1-[6-[[(3-iodophenyl)methyl]amino]-9H-purin-9-yl]-N-methyl-β-D-ribofuranuronamide
- MESF
molecules of equivalent soluble fluorochrome
- MFI
measured fluorescent intensity
- MRS1220
N-[9-chloro-2-(2-furanyl)[1,2,4]-triazolo[1,5-c]quinazolin-5-yl]benzene acetamide
- MRS5218
(1′S,2′R,3′S,4′S,5′S)-4′-[6-(3-chlorobenzylamino)-2-(N-cyanine(β-aminoethylaminocarbonyl)-1-butynyl)-9-yl]-2′,3′-dihydroxybicyclo[3.1.0]hexane-1′-carboxylic acid N-methylamide
- MRS5449
2-(6-amino-3-iminio-4,5-disulfonato-3H-xanthen-9-yl)-5-((6-(4-(4-((9-chloro-2-(furan-2-yl)-[1,2,4]triazolo[1,5-c]quinazolin-5-yl)amino)-4-oxobutyl)-1H-1,2,3-triazol-1-yl)hexyl)carbamoyl)benzoate
- MRS5704
(1S,2R,3S,4R,5S)-4-(6-(3-chlorobenzylamino)-2-(pyren-1-ylethynyl)-9H-purin-9-yl)-2,3-dihydroxy-N-methylbicyclo[3.1.0]hexane-1-carboxamide
- NECA
5′-N-ethylcarboxamidoadenosine
- XAC
xanthine amine congener, N-(2-aminoethyl)-2-[4-(2,3,6,7-tetrahydro-2,6-dioxo-1,3-dipropyl-1H-purin-8-yl)phenoxy]-acetamide hydrochloride
Footnotes
Publisher's Disclaimer: This is a PDF file of an unedited manuscript that has been accepted for publication. As a service to our customers we are providing this early version of the manuscript. The manuscript will undergo copyediting, typesetting, and review of the resulting proof before it is published in its final citable form. Please note that during the production process errors may be discovered which could affect the content, and all legal disclaimers that apply to the journal pertain.
References
- 1.Gessi S, Merighi S, Varani K, Leung E, MacLennan S, Borea PA. The A3 adenosine receptor: An enigmatic player in cell biology. Pharmacol Therap. 2008;117:123–140. doi: 10.1016/j.pharmthera.2007.09.002. [DOI] [PubMed] [Google Scholar]
- 2.Fishman P, Bar-Yehuda S, Liang BT, Jacobson KA. Pharmacological and therapeutic effects of A3 adenosine receptor (A3AR) agonists. Drug Disc Today. 2012;17:359–366. doi: 10.1016/j.drudis.2011.10.007. [DOI] [PMC free article] [PubMed] [Google Scholar]
- 3.Chen GJ, Harvey BK, Shen H, Chou J, Victor A, Wang Y. Activation of adenosine A3 receptors reduces ischemic brain injury in rodents. J Neurosci Res. 2006;84:1848–1855. doi: 10.1002/jnr.21071. [DOI] [PubMed] [Google Scholar]
- 4.Armstrong S, Ganote CE. Adenosine receptor specificity in preconditioning of isolated rabbit cardiomyocytes: evidence of A3 receptor involvement. Cardiovasc Res. 1994;28:1049–1056. doi: 10.1093/cvr/28.7.1049. [DOI] [PubMed] [Google Scholar]
- 5.Jajoo S, Mukherjea D, Watabe K, Ramkumar V. Adenosine A3 Receptor Suppresses Prostate Cancer Metastasis by Inhibiting NADPH Oxidase Activity. Neoplasia. 2009;11:1132–1145. doi: 10.1593/neo.09744. [DOI] [PMC free article] [PubMed] [Google Scholar]
- 6.Antonioli L, Fornai M, Colucci R, Ghisu N, Tuccori M, Awwad O, Bin A, Zoppellaro C, Castagliuolo I, Gaion RM, Giron MC, Blandizzi C. Control of enteric neuromuscular functions by purinergic A3 receptors in normal rat distal colon and experimental bowel inflammation. Br J Pharmacol. 2010;161:856–871. doi: 10.1111/j.1476-5381.2010.00917.x. [DOI] [PMC free article] [PubMed] [Google Scholar]
- 7.Jin X, Shepherd RK, Duling BR, Linden J. Inosine binds to A3 adenosine receptors and stimulates mast cell degranulation. J Clin Invest. 1997;100:2849–2857. doi: 10.1172/JCI119833. [DOI] [PMC free article] [PubMed] [Google Scholar]
- 8.Klaasse EC, IJzerman AP, Grip WJ, Beukers MW. Internalization and desensitization of adenosine receptors. Purinergic Signal. 2008;4:21–37. doi: 10.1007/s11302-007-9086-7. [DOI] [PMC free article] [PubMed] [Google Scholar]
- 9.Ferguson G, Watterson KR, Palmer TM. Subtype-specific kinetics of inhibitory adenosine receptor internalization are determined by sensitivity to phosphorylation by G protein-coupled receptor kinases. Mol Pharmacol. 2000;57:546–552. [PubMed] [Google Scholar]
- 10.Palmer TM, Harris CA, Coote J, Stiles GL. Induction of multiple effects on adenylyl cyclase regulation by chronic activation of the human A3 adenosine receptor. Mol Pharmacol. 1997;52:632–640. doi: 10.1124/mol.52.4.632. [DOI] [PubMed] [Google Scholar]
- 11.Trincavelli ML, Tuscano D, Marroni M, Falleni A, Gremigni V, Ceruti S, Abbracchio MP, Jacobson KA, Cattabeni F, Martini C. A3 adenosine receptors in human astrocytoma cells: agonist-mediated desensitization, internalization, and down-regulation. Mol Pharmacol. 2002;62:1373–1384. doi: 10.1124/mol.62.6.1373. [DOI] [PMC free article] [PubMed] [Google Scholar]
- 12.Trincavelli ML, Tuscano D, Cecchetti P, Falleni A, Benzi L, Klotz KN, Gremigni V, Cattabeni F, Lucacchini A, Martini C. Agonist-induced internalization and recycling of the human A3 adenosine receptors: role in receptor desensitization and resensitization. J Neurochem. 2000;75:1493–1501. doi: 10.1046/j.1471-4159.2000.0751493.x. [DOI] [PubMed] [Google Scholar]
- 13.Cordeaux Y, Briddon SJ, Alexander SP, Kellam B, Hill SJ. Agonist-occupied A3 adenosine receptors exist within heterogeneous complexes in membrane microdomains of individual living cells. FASEB J. 2008;22:850–860. doi: 10.1096/fj.07-8180com. [DOI] [PubMed] [Google Scholar]
- 14.Brand F, Klutz AM, Jacobson KA, Fredholm BB, Schulte G. Adenosine A2A receptor dynamics studied with the novel fluorescent agonist Alexa488-APEC. Eur J Pharmacol. 2008;590:36–42. doi: 10.1016/j.ejphar.2008.05.036. [DOI] [PMC free article] [PubMed] [Google Scholar]
- 15.Middleton RJ, Briddon SJ, Cordeaux Y, Yates AS, Dale CL, George MW, Baker JG, Hill SJ, Kellam B. New fluorescent adenosine A1-receptor agonists that allow quantification of ligand-receptor interactions in microdomains of single living cells. J Med Chem. 2007;22:782–793. doi: 10.1021/jm061279i. [DOI] [PubMed] [Google Scholar]
- 16.Kozma E, Kumar TS, Federico S, Phan K, Balasubramanian R, Gao ZG, Paoletta S, Moro S, Spalluto G, Jacobson KA. Novel fluorescent antagonist as a molecular probe in A3 adenosine receptor binding assays using flow cytometry. Biochem Pharmacol. 2012;83:1552–1561. doi: 10.1016/j.bcp.2012.02.019. [DOI] [PMC free article] [PubMed] [Google Scholar]
- 17.Kecskés M, Kumar TS, Yoo L, Gao ZG, Jacobson KA. Novel Alexa Fluor-488 labeled antagonist of the A2A adenosine receptor: Application to a fluorescence polarization-based receptor binding assay. Biochem Pharmacol. 2010;80:506–511. doi: 10.1016/j.bcp.2010.04.027. [DOI] [PMC free article] [PubMed] [Google Scholar]
- 18.Vernall AJ, Stoddart LA, Briddon SJ, Hill SJ, Kellam B. Highly potent and selective fluorescent antagonists of the human adenosine A3 receptor based on the 1,2,4-triazolo[4,3-a]quinoxalin-1-one scaffold. J Med Chem. 2012;55:1771–1782. doi: 10.1021/jm201722y. [DOI] [PubMed] [Google Scholar]
- 19.Tosh DK, Chinn M, Yoo LS, Kang DW, Luecke H, Gao ZG, Jacobson KA. Dialkynyl derivatives of (N)-methanocarba nucleosides: “Clickable” A3 adenosine receptor-selective agonists. Bioorg Med Chem. 2010;18:508–517. doi: 10.1016/j.bmc.2009.12.018. [DOI] [PMC free article] [PubMed] [Google Scholar]
- 20.Tosh DK, Phan K, Deflorian F, Wei Q, Yoo LS, Gao ZG, Jacobson KA. Click modification in the N6 region of A3 adenosine receptor-selective carbocyclic nucleosides for dendrimeric tethering that preserves pharmacophore recognition. Bioconjugate Chem. 2012;23:232–247. doi: 10.1021/bc200526c. [DOI] [PMC free article] [PubMed] [Google Scholar]
- 21.Tosh DK, Deflorian F, Phan K, Gao ZG, Wan TC, Gizewski E, Auchampach JA, Jacobson KA. Structure-guided design of A3 adenosine receptor-selective nucleosides: Combination of 2-arylethynyl and bicyclo[3.1.0]hexane substitutions. J Med Chem. 2012;55:4847–4860. doi: 10.1021/jm300396n. [DOI] [PMC free article] [PubMed] [Google Scholar]
- 22.Tosh DK, Chinn M, Ivanov AA, Klutz AM, Gao ZG, Jacobson KA. Functionalized congeners of A3 adenosine receptor-selective nucleosides containing a bicyclo[3.1.0]hexane ring system. J Med Chem. 2009;52:7580–7592. doi: 10.1021/jm900426g. [DOI] [PMC free article] [PubMed] [Google Scholar]
- 23.Li N, Hill KS, Elferink LA. Analysis of receptor tyrosine kinase internalization using flow cytometry. Methods Mol Biol. 2008;457:305–317. doi: 10.1007/978-1-59745-261-8_23. [DOI] [PMC free article] [PubMed] [Google Scholar]
- 24.Bradford MM. A rapid and sensitive method for the quantitation of microgram quantities of protein utilizing the principle of protein-dye binding. Anal Biochem. 1976;72:248–254. doi: 10.1016/0003-2697(76)90527-3. [DOI] [PubMed] [Google Scholar]
- 25.Kreckler LM, Wan TC, Ge ZD, Auchampach JA. Adenosine inhibits tumor necrosis factor-α release from mouse peritoneal macrophages via A2A and A2B but not the A3 adenosine receptors. J Pharmacol Exp Ther. 2006;317:172–180. doi: 10.1124/jpet.105.096016. [DOI] [PubMed] [Google Scholar]
- 26.National Committee for Clinical Laboratory Standards. Fluorescence Calibration and Quantitative Measurement of Fluorescence Intensity; Approved Guideline. NCCLS Document I/LA24-A (ISBN 1-56238-543-7)
- 27.Mundell SJ, Kelly E. The effect of inhibitors of receptor internalization on the desensitization and resensitization of three Gs-coupled receptor responses. Br J Pharmacol. 1998;125:1594–1600. doi: 10.1038/sj.bjp.0702234. [DOI] [PMC free article] [PubMed] [Google Scholar]
- 28.Cheng YC, Prusoff WH. Relationship between inhibition constant (K1) and concentration of inhibitor which causes 50 percent inhibition (I50) of an enzymatic-reaction. Biochem Pharmacol. 1973;22:3099–3108. doi: 10.1016/0006-2952(73)90196-2. [DOI] [PubMed] [Google Scholar]
- 29.Baker JG, Middleton R, Adams L, May LT, Briddon SJ, Kellam B, Hill SJ. Influence of fluorophore and linker composition on the pharmacology of fluorescent adenosine A1 receptor ligands. Br J Pharmacol. 2010;159:772–786. doi: 10.1111/j.1476-5381.2009.00488.x. [DOI] [PMC free article] [PubMed] [Google Scholar]
- 30.Jacobson KA. Functionalized congener approach to the design of ligands for G protein–coupled receptors (GPCRs) Bioconjugate Chem. 2009;20:1816–1835. doi: 10.1021/bc9000596. [DOI] [PMC free article] [PubMed] [Google Scholar]
- 31.Ioffe V, Gorbenko GP. Lysozyme effect on structural state of model membranes as revealed by pyrene excimerization studies. Biophys Chem. 2005;114:199–204. doi: 10.1016/j.bpc.2004.11.010. [DOI] [PubMed] [Google Scholar]
- 32.Borea PA, Dalpiaz A, Varani K, Gessi S, Gilli G. Binding thermodynamics at A1 and A2A adenosine receptors. Life Sci. 1996;59:1373–1388. doi: 10.1016/0024-3205(96)00311-6. [DOI] [PubMed] [Google Scholar]
- 33.Chen Y, Corriden R, Inoue Y, Yip L, Hashiguchi N, Zinkernagel A, Nizet V, Insel PA, Junger WG. ATP release guides neutrophil chemotaxis via P2Y2 and A3 receptors. Science. 2006;314:1792–1795. doi: 10.1126/science.1132559. [DOI] [PubMed] [Google Scholar]
- 34.Ge ZD, Peart JN, Kreckler LM, Wan TC, Jacobson MA, Gross GJ, Auchampach JA. Cl-IB-MECA [2-chloro-N6-(3-iodobenzyl)adenosine-5′-N-methylcarboxamide] reduces ischemia/reperfusion injury in mice by activating the A3 adenosine receptor. J Pharmacol Exper Ther. 2006;19:1200–1210. doi: 10.1124/jpet.106.111351. [DOI] [PubMed] [Google Scholar]
- 35.Weigel W, Rettig W, Dekhtyar M, Modrakowski C, Beinhoff M, Schlüter AD. Dual fluorescence of phenyl and biphenyl substituted pyrene derivatives. J Phys Chem A. 2003;107:5941–5947. [Google Scholar]
- 36.Nakajima A. Solvent effect on the vibrational structures of the fluorescence and absorption spectra of pyrene. Bull Chem Soc Jpn. 1971;44:3272–3277. [Google Scholar]
- 37.Nakajima A. Fluorescence spectra of anthracene and pyrene in water and in aqueous surfactant solution. J Luminescence. 1976;18:277–282. [Google Scholar]
- 38.Hoff B, Strandberg E, Ulrich AS, Tieleman DP, Posten C. 2H-NMR study and molecular dynamics simulation of the location, alignment, and mobility of pyrene in POPC bilayers. Biophys J. 2005;88:1818–1827. doi: 10.1529/biophysj.104.052399. [DOI] [PMC free article] [PubMed] [Google Scholar]
- 39.Kenakin TP. New concepts in pharmacological efficacy at 7TM receptors. Br J Pharmacol. 2013;168:554–575. doi: 10.1111/j.1476-5381.2012.02223.x. [DOI] [PMC free article] [PubMed] [Google Scholar]


