Abstract
This study represented a unique opportunity to understand changes in the human motion biomechanics during basic locomotion within a time interval of 4 years, when the monitored individual regained his original aerobic fitness, running performance and body mass index as prior to the injury. The participant visited the laboratory a month prior to the injury and during 4 years after the surgery. The surgery, subsequent rehabilitation and a 4-year running training programme in the studied recreational athlete did not completely eliminate the consequences of the Achilles tendon rupture. The function muscle deficit is namely manifested by a lower net plantar flexion moment and a lower net-generated ankle joint power during the take-off in the stance phase. The greater dorsal flexion in the affected ankle joint at the first contact with the ground and consequently higher peaks of ground reaction forces during running are consequences of the longer Achilles tendon in the affected lower extremity and weakened calf muscles.
Background
The Achilles tendon (AT) rupture is a devastating injury that causes a functional deficit in the triceps surae muscle–tendon complex.1 The number of cases with this injury has increased in the last decade from 2 to 12 individuals in every 100 000 individuals.2 Möller et al3 recommended an operative approach to the treatment of the AT rupture. However, the functional deficit of the triceps surae muscle–tendon complex exists up to 2 years after the injury regardless of the treatment approach.3 A greater amount of collagen type III versus type I was found in the operated ATs in comparison with control animal samples4 indicating that structural properties of tendons were changed. Moreover, they also showed worse mechanical properties.5
The objective of the AT rupture treatment is to restore, as close as possible, to the original quality of life. Running is a fundamental movement in sports and it often becomes a means of acquiring health-oriented fitness. However, as we know that the muscle–tendon complex of an operated triceps surae still has a functional deficit, 2 years after surgery,1 will the biomechanics of running be affected? Is it possible that there are higher biomechanical risk factors in an extremity with an operated AT that could subsequently cause further pathology of the muscular skeletal system?
Therefore, the aim of the study is to compare the basic biomechanical variables and the biomechanics of the ankle joint during running on an involved and uninvolved lower extremity after the AT rupture surgery in a recreational runner. To reduce the effect of potentially confounding variables, we carried out this study when the original body mass index (BMI) level, aerobic fitness and performance prior to the surgery were obtained. With regard to the structural and functional changes in operated triceps surae muscle–AT complex, we assume that the functional deficit of the atrophied lower extremity versus the non-atrophied lower extremity will manifest during running.4 5
Case presentation
A man at the age of 31 (body mass 83 kg and height 1.84 m) sustained an acute rupture of the left AT while playing tennis in June, 2008. The patient managed to gradually decrease the body weight of 96 kg that he put on immediately after the injury due to the lack of physical activity to 83 kg during the study (figure 1). At present, he subjectively perceives almost no difficulties during running. But, injuries occurred (medial tibial stress syndrome and Achilles tendonitis) when the runner has increased the volume of training for marathon. When the runner returns again to the original 30 km/week injury resolved. However, the maximum circumference of the uninvolved shank is 41 cm, whereas the maximum circumference of the involved shank is 38 cm (figure 2). The ankle range of motion was within normal limits, similar to his uninvolved side. The AT on the involved side is 3.5 cm longer and its width in the narrowest place is+0.5 cm (2 and 2.5 cm) greater than the uninvolved side. During a 10 km performance race, he finished in 43.23 s and the maximal oxygen consumption, VO2max, measured on a treadmill during a load test,6 was determined to be VO2max=55.7 ml/kg/min at the maximal mechanical power of 512 W and maximal pulse rate of HRmax=179 beats/min, which corresponds with the aerobic fitness condition prior to the injury.
Figure 1.
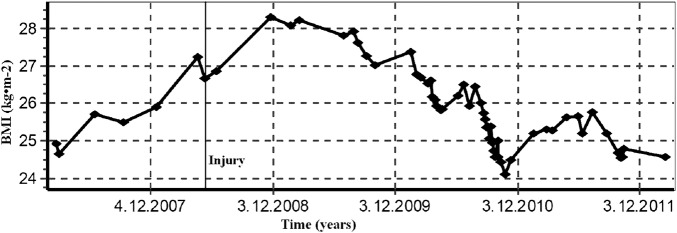
Development of the body mass index during 1 year prior to the surgery and 4 years after the surgery of the Achilles tendon.
Figure 2.
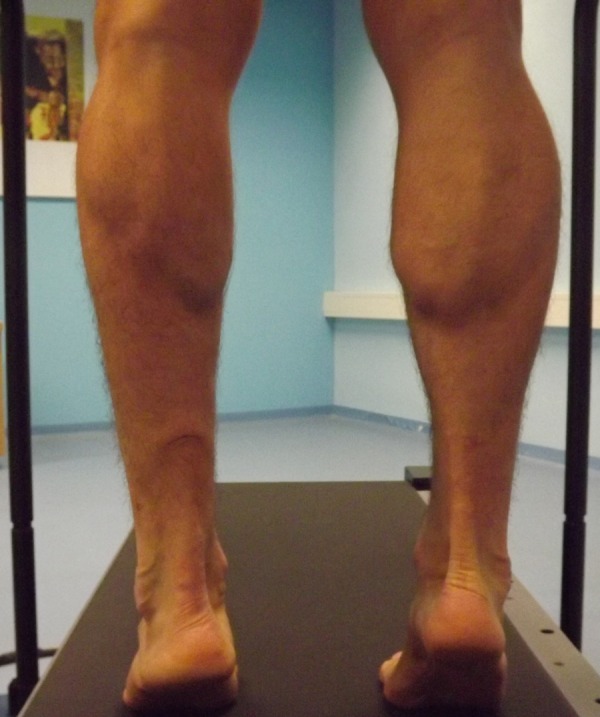
Photographs of affected (left) and unaffected (right) lower extremities during stance plantar flexion.
Investigations
A bio-impendence device (TANITA 418, Massachusetts, USA) was used to measure the BMI. The maximal oxygen consumption test was performed on a Lode Valiant motor-driven treadmill (Groningen, The Netherlands). The expired air was continuously monitored for an analysis of O2 and CO2 concentrations during the graded treadmill test (GXT) by using a breath-by-breath system (ZAN 600 Ergo, Oberthulba, Germany).6
Two Kistler force plates (9286AA, Switzerland) built in the floor were disguised with the same surface colour as the surrounding floor of the 15 m long walkway in the biomechanics laboratory.
The positions of the reflective markers in the calibrated area of the laboratory were recorded by optoelectronic stereophotogrammetry with a system of eight infrared cameras with the frequency of 247 Hz (Qualisys, Oqus 100, Sweden). The kinetics of running was measured with the use of a Bertec running treadmill with an integrated measurement of ground reaction forces with the frequency of 1235 Hz. The kinematic and kinetic data were temporally and spatially synchronised.7 Prior to the measurement, a global coordinated system was created using the rectangular calibration device with the known positions of the reference markers. The research was executed in the Biomechanical Laboratory under standardised conditions.
The participant completed 60 visits at the Physiology and Functional Anthropology Laboratory for the purpose of measuring BMI during a period of 5 years (figure 1). The sessions involved BMI measurements and maximal oxygen consumption (VO2max) testing 4 years after the injury according to the protocol of Cipryan and Gajda.6
The participant visited the Biomechanics Laboratory 4 times. In May 2008, a month prior to the injury, and in 2012, 4 years after the injury, a dynamic gait analysis was carried out. The participant underwent a walking practice over force plates on a 15 m long walkway. Subsequently, he executed five trials over the force plates at his natural walking speed. The trial was accepted when both the left-and-right lower extremities contacted the force plate in a one-step cycle.
The following tests included measuring the biomechanics of running that were planned for the time when the subject of measurement obtained the original BMI level (below 25 kg/m2) and aerobic fitness prior to the surgery expressed by the result of VO2max (above 50 ml/kg/min) and a 10 km long run at an athletic stadium (below 45 min). A repeated visit at the Biomechanics Laboratory was planned (with a time interval of 1 day of rest) in order to verify the reliability of measurement. Following a warm-up, the subject ran in a natural way on the treadmill for 5 min with the speed set to 2.4 m /s. Subsequently, the speed of the treadmill belt was increased to preferred running speed 3.2 m/s. Prior to the measurement, retro-reflective markers were placed on the skin of the shank and the foot in a bilaterally. Specifically, for calibration, markers were placed on the medial and lateral femoral epicondyles, on the medial and lateral malleolus, on the neutral Mizuno running shoe in the posterior aspect of the heel and above the first and fifth metatarsal head of the foot. Moreover, light-weight rigid plates holding a quaternion of markers7 were attached to the shank; two other tracking retro-reflexive markers were attached to the shoe posteriorly (figure 3).
Figure 3.
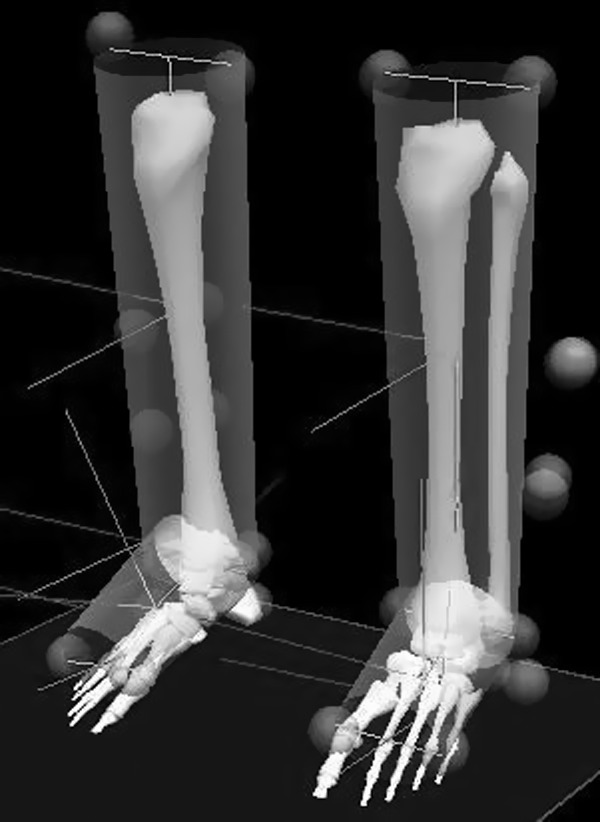
A lower extremity model created on the basis of the retro-reflexive markers located on singular points of the shank and foot.
The kinetic and kinematic data were processed in Visual3D programme (C-motion, Rockville, Maryland, USA). The support phase of the right and left contacts was defined when the vertical ground reaction force was greater than 20 N. Five gait cycles were analysed from each of the two separate measurements in the Biomechanical Laboratory. The local coordinate systems of the individual segments were defined at the static calibration trial in the natural stance (figure 2). The coordinate data were filtered by a low-pass filter (fourth-order Butterworth filter) with a cut-off frequency of 12 Hz and the analogue data were filtered with the frequency of 50 Hz. The angular displacements, angular velocities and angular accelerations were obtained from the reciprocal positions of the local coordinate systems of the foot and the shank.7 The net ankle joint moment of force at the sagittal plane of the ankle joint in which the moment of force during running is the greatest when compared to the transversal and frontal plane was calculated using a Newton-Euler inverse dynamics technique.
The net ankle joint power was calculated as the product of the instantaneous net ankle joint and the angular velocity in the sagittal plane. The output power is expressed in the local coordinate system of the shank with the use of the Cardan rotation sequence XYZ.8 The negative power represents energy absorption through the net eccentric muscle action and the positive power of the energy generation through the net concentric muscle action.
The peaks of the anteroposterior ground reaction forces in the plantar flexion on the involved and uninvolved lower extremity obtained from the dynamic analysis of walking were used for further processing. A symmetry index was used to quantify asymmetries in gait.9
The mean and SD of the five analysed gait cycles in each of the two measurements was determined for the peak net ankle joint power in the absorption and generation phase of running as well as for both peaks of the vertical ground reaction force during running and the peak of the anteroposterior power during walking.
In addition, the length of the unaffected and affected AT was measured from the calcaneal osteotendinous junction to the gastrocnemius musculotendinous junction10 using MRI (Philips INTERA, Achieva 1.5 Tesla, Guildford, UK) in the frontal plane. The maximum transverse muscle diameter of tibialis anterior (TA), lateral (LG) and medial (MG) gastrocnemius and soleus (Sol) in the transversal plane was measured repeatedly (3x) using images from the MRI (Philips INTERA, Achieva 1.5 Tesla, Guildford, UK). Furthermore, we used a questionnaire with symptoms related to the handicap after the AT rupture: The Achilles Tendon Total Rupture Score (ATRS).11
The kinematics, kinetics and mechanical properties of the operated and non-operated lower extremity were compared using the effect of size (ES). The effect of size ES <0.2 was considered trivial, ES=0.2–0.6 small, ES=0.7–1.2 medium, ES=1.3–2.0 large, ES=2.1–4.0 very large and ES >4.0 nearly perfect.12 Moreover, the differences between the involved and uninvolved lower extremity were expressed as a percentage of the mean value of the two separated measurements. The analysis was performed in the PASW Statistics 18 program.
Treatment
One day after the injury, the patient underwent a reconstruction procedure during which the ruptured AT was repaired with an open surgical technique and an end-to-end suture. Owing to the mop-end type of the tear and the delicate structure of the tendon in comparison with the enormous size of the calf muscle, the suture was augmented by a graft collected from fascia latae. The extremity was immobilised in an above-knee plaster cast with the foot and knee placed in the position of flexion of 30 s for 4 weeks. Thereafter, a below-knee plastic brace with an adjustable ankle joint was used. The foot was placed in flexion of 10 s for another week and in a neutral position for 1 more week. Afterwards, the restriction of the dorsal flexion of the foot was abandoned; however, a rubber band exerting a pull force towards the flexion was applied. After another week, the fixation was completely removed.
Physical therapy was initiated on the inpatient basis for 2 weeks and then for another 10 weeks on the outpatient basis. In the course of rehabilitation, the functional deficit of the dorsal flexor muscles of the ankle joint was found to manifest as a rapid decrease of the foot with a thud against the ground. Upon the completion of the rehabilitation, the subject of the measurement started a regular physical activity programme. He gradually worked to his regular training regimen of 30 km running per week.
Outcome and follow-up
The measurements from the dynamic analysis of natural gait imply that the peak anteroposterior ground reaction force in the propulsive phase prior to the injury on the involved lower extremity was the same as in the uninvolved extremity (225±11 N and 222±6 N, ES=0.01). Four years after the surgery, however, the anteroposterior peak of the ground reaction force was greater in the uninvolved extremity (224±5 N) than in the involved extremity (209±5 N, ES=3.0).
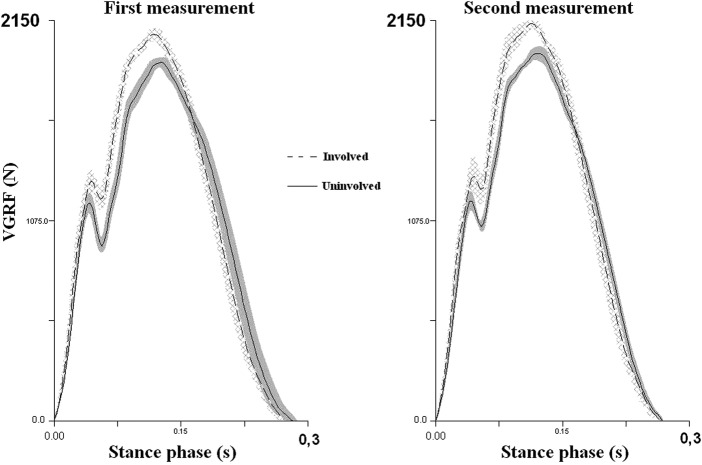
With regard to the uninvolved lower extremity, the involved lower extremity was exposed to a greater passive (+18% of the body weight) as well as active (+20% of the body weight) peaks of the vertical ground reaction force during running at the speed of 3.2 m/s, 4 years after the surgery (figure 4).
Figure 4.
The mean and SD of the vertical ground reaction force 4 years after the surgery in the first and second measurement of the biomechanics of running at the speed of 3.2 m/s. The areas around the force curves represent the SDs of five trials for each lower extremity.
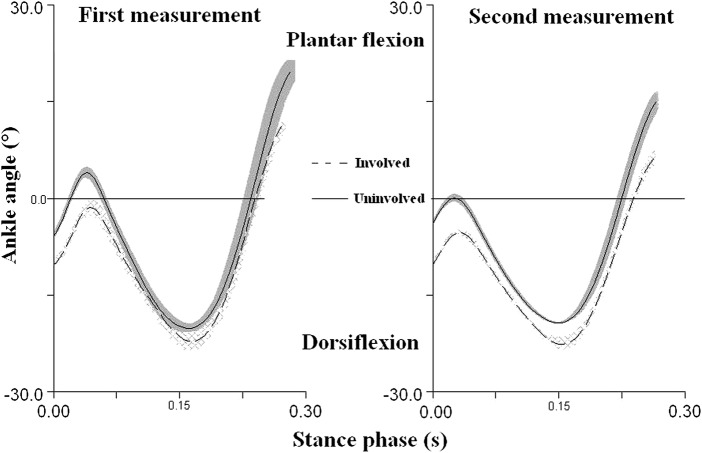
The joint ankle of the involved extremity is in a greater dorsiflexion at the first contact with the ground than the ankle joint of the uninvolved extremity (Table 1). This asymmetry is 55% according to Robinson et al,9 during initial contact and obvious during the entire stance phase (figure 5).
Table 1.
The mean and SDs of kinetics and kinematics variables calculated from five trials in each of the two measurements 4 years after the surgery
| First measurement |
Second measurement |
|||||||||||||
|---|---|---|---|---|---|---|---|---|---|---|---|---|---|---|
| Quantity | Involved mean | SD | Uninvolved mean | SD | Δ | ES | Effect | Involved mean | SD | Uninvolved mean | SD | Δ | ES | Effect |
| First peak of VGRF (N) | 1286 | 58 | 1167 | 53 | 119 | 2.1 | Very large | 1335 | 37 | 1174 | 55 | 161 | 3.4 | Very large |
| Second peak of VGRF (N) | 2076 | 29 | 1927 | 24 | 149 | 5.6 | n. perfect | 2151 | 10 | 1972 | 38 | 179 | 6.4 | n. perfect |
| Dorsiflexion angle—first contact (°) | −10.2 | 0.7 | −5.8 | 0.5 | −4.4 | 7.3 | n. perfect | −12.7 | 1 | −7.4 | 0.2 | −5.3 | 7.4 | n. perfect |
| Peak dorsiflexion moment (Nm) | 17.8 | 0.9 | 18.1 | 2.3 | −0.2 | 0.2 | small | 16.1 | 6.4 | 11.5 | 2.1 | 4.6 | 1 | Moderate |
| Peak plantar flexion moment (Nm) | −184.8 | 2 | −207.3 | 5.9 | 22.5 | 5.1 | n. perfect | −176 | 10 | −209 | 2.9 | 33 | 4.5 | n. perfect |
| Peak mechanical power during dorsiflexion (W) | −75 | 13 | −68.1 | 23.5 | −6.9 | 0.4 | Small | −38.8 | 16.1 | −30.3 | 17 | −8.4 | 0.5 | Small |
| Peak absorption plantar flexor power (W) | −530 | 70.7 | −570.2 | 49.1 | 40.2 | 0.7 | Moderate | −508.7 | 50.2 | −519.3 | 11.1 | 10.6 | 0.3 | Small |
| Peak generation plantar flexor power (W) | 739.6 | 57.4 | 859.9 | 64.2 | −120.3 | 2 | Large | 682.2 | 92.8 | 837.5 | 112.1 | −155.3 | 1.5 | Large |
Δ, The difference between the average value of the force acting on the involved and uninvolved foot; effect, the effect of size interpreted according to Hopkins12; ES, the effect of size (Cohen's d) ; n. perfect, nearly perfect; VGRF, the vertical ground reaction force.
Figure 5.
The mean ankle joint angle 4 years after the surgery in relation to the stance phase duration of five trials in each of the two temporally separated measurements at the running speed of 3.2 m/s. The areas around the curves represent the SDs of five trials for each lower extremity.
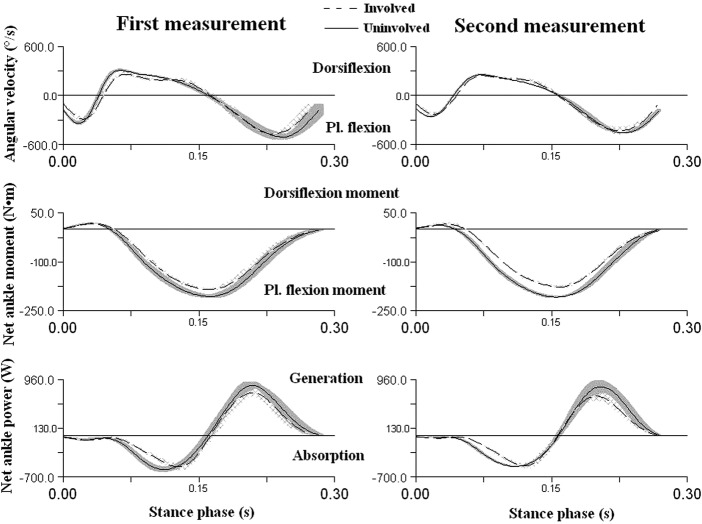
The net plantar flexion joint moment in the stance phase was greater (+13%) in the uninvolved extremity and, moreover, the joint transfers greater net plantar flexion joint power (+16%) as against the involved extremity (table 1 and figure 6).
Figure 6.
The average angular velocity, average net moment of force and net ankle power 4 years after the surgery in the sagittal plane in the stance phase of running by the first rear-foot contact on the treadmill at the speed of 3.2 m/s. The quantities are expressed in the coordinate system of the shank with the use of the Cardan's angle of rotation sequence XYZ. The areas around the curves represent the SDs of five trials for each lower extremity.
On average, the measurements of the AT on the affected lower extremity showed that it was longer by 3.5±0.4 cm (ES=7.6) (figure 7; left AT=25.1±0.1 cm, right AT=21.6±0.4 cm). As for the affected extremity, we also determined a practically significant lower maximum diameter of tibialis anterior by 0.3 cm (ES=7, left TA=4.4±0.08 cm, right TA=4.7±0.04 cm), lateral gascrocnemius by 1.9 cm (ES=7, left LG=5.3±0.14 cm, right LG=7.2±0.12 cm), medial gastrocnemius by 0.7 cm (ES=6.8, left MG=6.1±0.08 cm, right MG=6.8±0.04 cm) and soleus by 1.6 cm (ES=4.8, left Sol=10.0±0.16 cm, right Sol=11.6±0.20 cm). The value of the AT total rupture score was measured at the level of 75 of 100.
Figure 7.
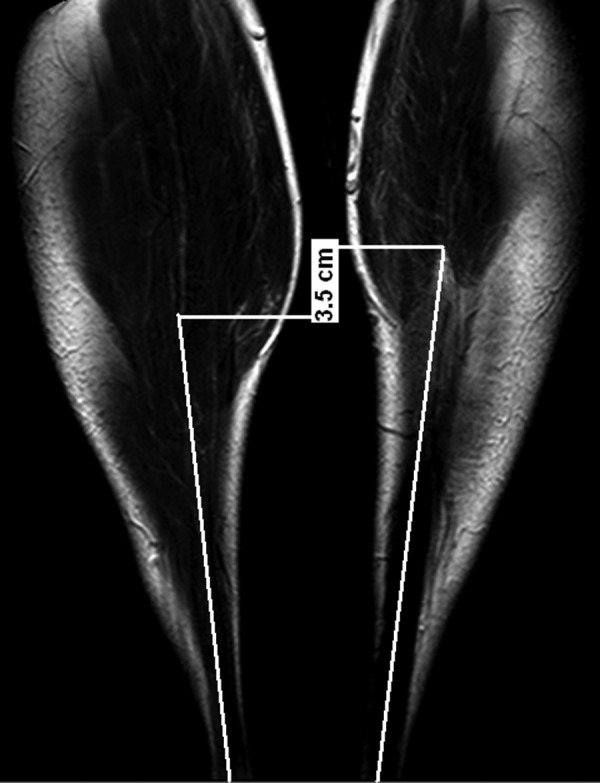
An MRI of the affected (left) and unaffected (right) frontal plane Achilles tendons in the prone position with a straight knee and 90 degrees in the ankle joint.
Discussion
The study represented a unique opportunity to understand the changes in the human motion biomechanics during basic locomotion within a time interval of 4 years when the monitored individual regained his original aerobic fitness, running performance and BMI as prior to the injury. The assumption that the functional deficit on the atrophied extremity as against the non-atrophied extremity would show during running was confirmed. Both the net-generated ankle joint power and the plantar flexion moment of force in the stance phase are greater in the uninvolved extremity (table 1 and figure 6). The plantar flexion moment of the involved extremity was on average lower by −10.85% in the first measurement and by −15.78% in the second measurement. The positive mechanical power in the plantar flexion in the concentric contraction of the involved joint is practically significantly lower by −13.98% in the first measurement and by −18.54% in the second measurement than the power in the uninvolved joint (table 1 and figure 5). The fact that the AT is longer, shank muscles are atrophied and tendon properties may be changed may have a negative effect on the muscle–tendon interaction and thus the entire stretch-shortening cycle during the stance phase of the involved extremity. It has been proven that the muscle fibre contracts in an almost constant length during motions such as jumps or walking, while the tendon performs the stretch-shortening cycle.13
This findings are in accordance with a study that monitored a woman before and after an AT rupture surgery10 whose involved ankle joint showed a reduced plantar flexion power (−21%) and lower moment of the plantar flexion (−6%) as against the uninvolved extremity 1 year after the surgery. Moreover, the net knee joint power of the uninvolved extremity in the sagittal plane in this study10 was lower both in the absorption (−24.7%) and generation (−10%) stance phase. In this case, the knee most likely replaced the insufficient function of the ankle joint muscles. We can thus assume the same behaviour of the knee joint of the involved lower extremity during running in the case of the individual that we studied. Moreover, an anomalous co-contraction of tibialis anterior and soleus muscles was confirmed in the gait of 41 patients (male and female). The co-contraction still had a negative effect on the power of plantar flexors during concentric contraction 1 year after the surgery.14
The kinematic results (table 1 and figure 5) show that the subject of measurement executes the first contact with the ground of the involved extremity with a greater dorsal flexion in the ankle joint, while McClay and Manal15 measured a dorsiflexion angle at contact in 18 healthy runners below 5°, which is closer to the results of the uninvolved extremity in this study (table 1). We assume that the subject of measurement tries to compensate the insufficient function of the dorsal flexors through the greater dorsal flexion in the ankle joint. The insufficient function of the dorsiflexors, such as tibialis anterior, resulting in the foot moving to a footflat position too fast having a negative effect on rolling the foot away. From the aspect of the creation of the moment of dorsal flexion, the involved extremity is in a better position in the dorsal flexion greater by 5° during the first contact (table 1). Based on this study, it is not possible to unambiguously determine whether the greater dorsal flexion of the involved lower extremity during the contact with the ground is caused by the weakening of dorsal flexors, such as tibialis anterior or by the weakening of plantar flexors and elongation of the AT. However, the results of the MRI showed that most were weakened calf muscles. Ultimately, this method of execution of the first contact subsequently causes a greater passive and active peak of the vertical ground reaction force in the involved extremity as against the uninvolved one. Review research has suggested that runners who exhibit relatively large and rapid impact forces, while running, have an increased risk of developing an overuse injury of the lower extremity.16 The differences between second peaks of ground reaction force were higher than the minimal detectable change 105 N calculated according to Haley and Fragala-Pinkham.17
The subject underwent a dynamic analysis of gait at our laboratory prior to the injury and the peaks of the anteroposterior ground reaction forces in the propulsion phase showed a left-to-right symmetry 1.3% according to Robinson et al.9 Thus, in this study, we assume that the kinetics of running prior to the surgery also showed symmetry. In this study, we only analysed the sagittal plane of the ankle joint as it is this plane where the greatest moments of force are created when compared to the frontal and transversal planes. Moreover, Reinschmidt et al18 state a relative error of 21% in the sagittal plane, but more than 60% in the transversal and frontal planes. The study is also limited by the negligence of the movement of the sole against the shoe.19 We assumed that reduced size of the calf muscles was accompanied by their weakening.20 In spite of the fact that there was a great practically significant asymmetry between the muscles of the shank of the affected and unaffected lower extremity, the value of the AT total rupture score was measured at the level of 75 of 100. In healthy subjects, ATRS was measured between 94 and 100. In patients after a surgery of the ruptured AT, the value ranges from 17 to 100 with a median value of 85.11
Learning points.
Four-year running training programme did not eliminate the consequences of the Achilles tendon rupture, in spite of the fact that the runner subjectively states only minimal difficulties in regular running and regained his original aerobic fitness, running performance and body mass index as prior to the injury.
The greater dorsal flexion in the ankle joint at the first contact with the ground is a consequence of the longer Achilles tendon in the affected lower extremity and weakened calf muscles.
Although this adaptation allows returning to the original aerobic fitness, in this case, the negatively influenced passive and active peak of the vertical ground reaction force during stance of affected leg.
Footnotes
Competing interests: None.
Patient consent: Obtained.
Provenance and peer review: Not commissioned; externally peer reviewed.
References
- 1.Bressel EE, Larsen BT, McNair PJ, et al. Ankle joint proprioception and passive mechanical properties of the calf muscles after an Achilles tendon rupture: a comparison with matched controls. Clin Biomech 2004;19:284–91 [DOI] [PubMed] [Google Scholar]
- 2.Hess G. Achilles tendon rupture: a review of etiology, population, anatomy, risk factors, and injury prevention. Foot Ankle Spec 2010;3:29–32 [DOI] [PubMed] [Google Scholar]
- 3.Möller MM, Lind K, Movin T, et al. Calf muscle function after Achilles tendon rupture. A prospective, randomized study comparing surgical and non-surgical treatment. Scan J Med Sci Sports 2002;12:9–16 [DOI] [PubMed] [Google Scholar]
- 4.Eriksen H, Pajala A, Leppilahti J, et al. Increased content of type III collagen at the rupture site of human Achilles tendon. J Orthop Res 2002;20:1352–7 [DOI] [PubMed] [Google Scholar]
- 5.Liu S, Yang R, al-Shaikh R, et al. Collagen in tendon, ligament, and bone healing. A current review. Clini Orthop Relat Res 1995;318:265–78 [PubMed] [Google Scholar]
- 6.Cipryan L, Gajda V. The influence of aerobic power on repeated anaerobic exercise in junior soccer players. J Hum Kin 2011;28:63–71 [DOI] [PMC free article] [PubMed] [Google Scholar]
- 7.Hamill J, Selbie S. Three-dimensional kinematics. In: Robertson GE, Caldwell G, Hamill J, Kamen G, Whittlesey S. (eds) Research methods in biomechanics. Champaign, IL: Human Kinetics, 2004a;35–54 [Google Scholar]
- 8.Hamill J, Selbie S. Three-dimensional kinetics. In: Robertson GE, Caldwell G, Hamill J, Kamen G, Whittlesey S. (eds) Research methods in biomechanics. Champaign, IL: Human Kinetics; 2004b;145–62 [Google Scholar]
- 9.Robinson RO, Herzog W, Nigg BM. Use of force platform variables to quantify the effects of chiropractic manipulation on gait symmetry. J Manipulative Physiol Ther 1987;10:172–6 [PubMed] [Google Scholar]
- 10.Silbernagel KG, Willy RW, Davis IS. Pre- and post-injury running analysis along with measurements of strength and tendon length in a patient with a surgically repaired Achilles tendon rupture. J Orthop Sports Phys Ther 2012;42:521–9 [DOI] [PubMed] [Google Scholar]
- 11.Nilsson-Helander K, Thomeé R, Karlsson J, et al. The Achilles tendon total rupture score (ATRS): development and validation. Am J Sports Med 2007;35:421–6 [DOI] [PubMed] [Google Scholar]
- 12.Hopkins WG. A scale of magnitudes for effect statistics. In A New View of Statistics 2002. http://www.sportsci.org/resource/stats/effectmag.html (accessed date 10 June 2012).
- 13.Fukunaga T, Kawakami Y, Kubo K, et al. Muscle and tendon interaction during human movements. Exer Sport Sci Rev 2002;30:106–10 [DOI] [PubMed] [Google Scholar]
- 14.Don R, Ranavolo A, Cacchio A, et al. Relationship between recovery of calf-muscle biomechanical properties and gait pattern following surgery for Achilles tendon rupture. Clin Biomech 2007;22:211–20 [DOI] [PubMed] [Google Scholar]
- 15.McClay I, Manal KA. Comparison of three-dimensional lower extremity kinematics during running between excessive pronators and normal. Clin Biomech 1998;13:195–203 [DOI] [PubMed] [Google Scholar]
- 16.Hreljac A. Impact and overuse injuries in runners. Med Sci Sports Exerc 2004;36:845–9 [DOI] [PubMed] [Google Scholar]
- 17.Haley S, Fragala-Pinkham M. Interpreting change scores of tests and measures used in physical therapy. Phys Ther 2006;86:735–43 [PubMed] [Google Scholar]
- 18.Reinschmidt C, van den Bogert AJ, Murphy N, et al. Tibiocalcaneal motion during running, measured with external and bone markers. Clin Biomech 1997;12:8–16 [DOI] [PubMed] [Google Scholar]
- 19.Reinschmidt C, van den Bogerd AJ, Nigg BM, et al. Effect of skin movement on the analysis of skeletal knee joint motion during running. J Biomech 1997;30:729–32 [DOI] [PubMed] [Google Scholar]
- 20.Van der Krogt M, Delp S, Schwartz M. How robust is human gait to muscle weakness? Gait Posture 2012;36:113–19 [DOI] [PMC free article] [PubMed] [Google Scholar]


