Abstract
Purpose
This study was performed to suggest reference line-pair values of panoramic images with clinically desirable qualities using an arch-form phantom stand.
Materials and Methods
The line-pair test phantom was chosen. A real skull model was selected for setting the arch-form model of the phantom stand. The phantom stand had slits in four regions (incisor, premolar, molar, TMJ). Four raw images of the test phantom in each region and one raw image of the real skull were converted into 50 test phantom images and 50 skull phantom images with various line-pair values. 50 post-processed real skull phantom images were divided into 4 groups and were randomly submitted to 14 evaluators. Image quality was graded on a 4 point scale (1. good, 2. normal, 3. poor but interpretable, and 4. not interpretable). The reference line pair was determined as the first line-pair value scored less than 2 points.
Result
The mean scores tended to decrease as the line-pair values increased. The reference line-pair values were 3.19 LP/mm in the incisor, 2.32 LP/mm in the premolar and TMJ, and 1.88 LP/mm in the molar region.
Conclusion
Image quality evaluation methods and criteria should be able to assess various regions considering the characteristics of panoramic systems. This study suggested overall and regional reference line-pair values and established a set of standard values for them.
Keywords: Radiography, Panoramic; Quality Assurance; Phantom, Imaging
Introduction
The quality assurance program of a diagnostic radiographic system usually consists of a safety and functionality test, geometry test, and image quality test.1 The safety and functionality test assesses the stability of the X-ray generating equipment. Currently, all diagnostic radiographic systems in South Korea are under the regulation of the diagnostic radiology safety control act.2 The geometry quality assurance program verifies the stability and geometric accuracy of the hardware and the software of X-ray machines, and image quality assurance evaluates the spatial resolution and contrast sensitivity of radiologic images.
The Ministry of Health and Welfare in Korea commissions the Korean Institute for Accreditation of Medical Image (KIAM) to perform image quality assurance tests. The KIAM assesses the quality of images in two ways: (1) A clinical image quality test evaluates the radiographic images of patients in clinical situations according to the evaluation criteria, and (2) a phantom image test examines the images of radiographic phantoms to assess image quality.3,4 A phantom image test is an essential method for assessing image quality. It evaluates radiographic systems using standardized phantoms for the accurate control of image quality. However, it is difficult to control the image quality of dental diagnostic radiographic systems due to a lack of proper image quality tests and criteria.
Kim et al reported that the number of panoramic radiographic examinations increased by 112.6% between 2006 and 2009 in South Korea.5 It can be said that panoramic radiographic examinations performed in the dental field contribute to a relatively high proportion of the radiation exposure of the general population. Recently, with the advancement of image transmission systems and digital panoramic radiographic equipment, the prevalence of digital radiographic exams has increased in the diagnosis and treatment of dental procedures. In spite of their widespread usage, the image quality of panoramic radiographic systems is only evaluated privately by the manufacturers. The manufacturers use their own non-standardized phantoms and conduct the tests in their own way. Panoramic radiography requires a precisely located jaw bone within the focal trough since the imaging system is based on the principles of tomography and scanning. If the position of the jaw bone is improper, the resulting panoramic radiograph may have no diagnostic value due to inadequate quality.6 From this point of view, the current phantom for panoramic radiographs has the limitation that it can be used to evaluate the spatial resolution of the anterior region only. Therefore, a standardized phantom for the full arch of the jaw bone is urgently needed to regulate the panoramic machines used in all dental specialties and to consistently evaluate the image quality tests.
A phantom image test is generally carried out using line-pair and contrast resolution phantoms. It is difficult for general dentists to measure the fundamental imaging metrics, such as the modulation transfer function (MTF), noise power spectrum (NPS), and detective quantum efficiency (DQE). Therefore, in order to perform the test appropriately, the phantom image test using the line-pair and contrast resolution phantoms should be easy to conduct in clinical settings.7
This study was performed to evaluate the spatial resolution of panoramic radiographs at the incisor, premolar, molar, and temporomandibular joint (TMJ) regions using a line-pair test device on a specially designed phantom stand. The horse shoe-shaped phantom stand representing the arch-form of the jaw bone with 4 slits at the locations of the incisor, premolar, molar, and TMJ regions. This study also aimed to determine the optimal reference line-pair values of the clinically desirable image level.
Materials and Methods
Selection of line-pair test phantom
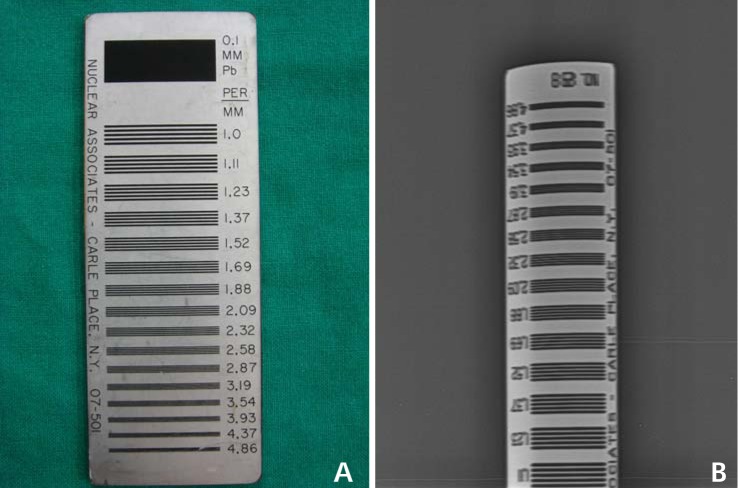
The Nuclear Associates model 07-501 Ser. N0.12913 (Fluke Co., Cleveland, OH, USA) was used to evaluate the spatial resolution as line-pairs (LP) per millimeter (Fig. 1), and could measure 16 different line-pair values as follows: 1.0, 1.11, 1.23, 1.37, 1.52, 1.69, 1.88, 2.09, 2.32, 2.58, 2.87, 3.19, 3.54, 3.93, 4.37, and 4.86 LP/mm.
Fig. 1.
A. Line-pair test phantom (Nuclear Associates model 07-501 SER. NO.12913). B. The radiographic image of the line-pair test phantom.
Fabrication of the phantom stand
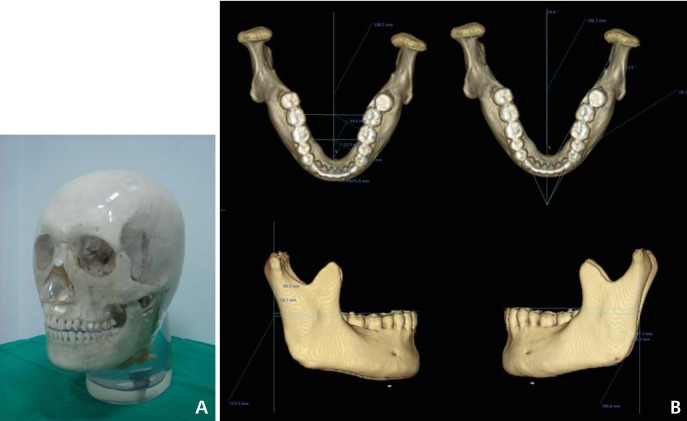
A real skull phantom with a transparent soft tissue replica (X-ray phantom, head; product number 7280, Erler Zimmer Co., Lauf, Germany) was used to fabricate an archform model. The phantom included 5 cervical vertebrae, a real human skull, and a soft tissue replica.
The skull phantom was scanned using a Somatom Sensation 10 (Siemens AG, Erlangen, Germany) multidetector CT machine, and the CT images and its three-dimensional (3D) images were analyzed using 3D modeling software (V-works, Cybermed, Seoul, Korea) (Fig. 2).
Fig. 2.
A. Transparent real skull X-ray phantom. B. The structural connection of the mandibular condyle with the lower dental arch of the skull phantom is measured on the 3D CT images.
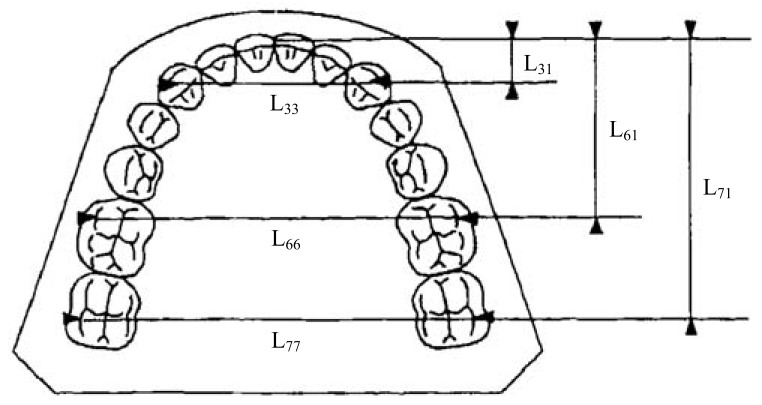
The dimensions of the dental arches were measured according to the Raberin method8 in order to fabricate an arch-form model as a new phantom stand (Fig. 3). Briefly, the structural relationship of the mandibular condyle with the lower dental arch of the skull phantom were evaluated in two ways: (1) measuring the distance between the distobuccal cusp of the mandibular second molar and the center of the mandibular condyle on the sagittal plane on the lateral view and (2) measuring the angle of the line connecting the center of the condyle and the distobuccal cusp of the mandibular second molar about the midsagittal plane on the axial view.
Fig. 3.
Reference points and associated measurements. The dimensions of the dental arches are determined according to three sagittal and three transverse measurements. (This image is cited from a study by Raberin et al.8)
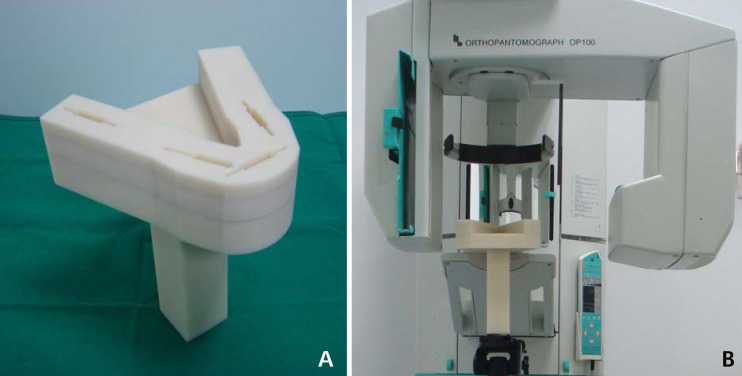
The dental arch of the skull phantom was reproduced as the schematized arch-form which is the central line of a horse-shoe-shaped phantom stand body by using the measurements. The outline of the body of the phantom stand was designed to run parallel to the central line and 1.5 cm medial and lateral to the central line. Slits were prepared in 4 regions including the incisor, right premolar, left molar, and right TMJ regions to hold line-pair test phantoms. The center of each slit was set to match the center of each region, except at the premolar region. The center point of the slit at the premolar region was shifted 1.5 mm forward due to structural limitations. This problem was solved by adjusting for the region of interest (ROI). Underneath the horse-shoe-shaped stand body, a rectangular post of 15 cm in height was installed. The screw holes for the tripod connection were prepared on the base of the post to position the stand during panoramic image acquisition (Fig. 4).
Fig. 4.
A. The phantom stand: Slits are prepared in 4 regions including the incisor, right premolar, left molar, and right TMJ regions to hold the test phantoms. B. Positioning the phantom stand for panoramic image acquisition using the tripod connection.
Acquisition of images
Four raw images of the phantom stand with the line-pair test phantoms, one in each area,and 1 raw image of the real skull phantom were taken as a DICOM file under identical conditions (70 kVp, 8.0 mA, 13.5 s) using the PaxPrimo (Vatech, Hwaseong, Korea) (Fig. 5).
Fig. 5.
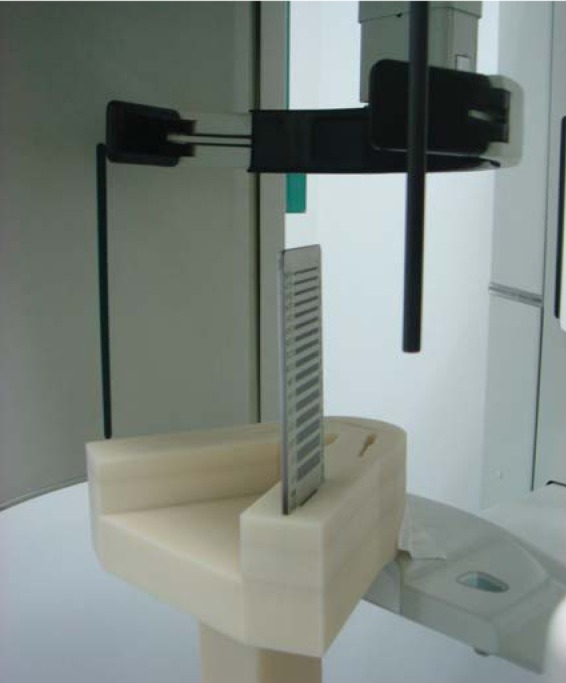
The selected line-pair phantom is inserted in the right TMJ slit of the phantom stand and these are positioned for panoramic image acquisition.
Processing of acquired images to obtain various linepair values
The acquired raw images were converted into post-processed images using a software program(ImgProc_TestNew®, Vatech Co., Seoul, Korea) that could produce a variety of images by altering the post-processing parameters including noise factors (the NRK size [NRK sigma], Gaussian blur size, and mask factor). This post-processing procedure produced differences in the spatial resolution, or line-pair value.
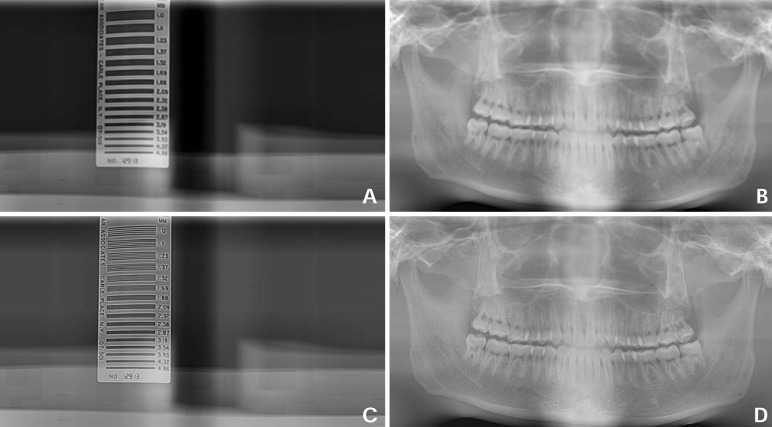
The raw images of the test phantom at the incisor, premolar, and TMJ regions were post-processed under the different settings into 13 images showing various line-pair values (1.0, 1.11, 1.23, 1.37, 1.52, 1.69, 1.88, 2.09, 2.32, 2.58, 2.87, 3.19, and 3.54 LP/mm), producing 39 images in total. The raw image of the molar region of the test phantom was also post-processed into 11 images showing diverse line-pair values (1.0, 1.11, 1.23, 1.37, 1.52, 1.69, 1.88, 2.09, 2.32, 2.58, and 2.87 LP/mm). A total of 50 post-processed test phantom images were acquired. In order to obtain post-processed images of the test phantom and skull phantom showing the same line-pair value, each of the raw images of the test phantom and real skull phantom were post-processed under the same respective settings. As a result, a total of 50 post-processed real skull phantom images were obtained (Fig. 6).
Fig. 6.
The post-processed test phantom radiographs and corresponding post-processed real skull phantom radiographs, respectively. A. The post-processed image of the test phantom in premolar region showing a 1.11 line-pair value (1.11 LP/mm). B. The post-processed image of the real skull phantom under the same parameter settings for "A" image post-processing. C. The post-processed image of the test phantom in the premolar region showing a 2.87 line-pair value (2.87 LP/mm). D. The post-processed image of the real skull phantom under the same parameter settings for "C" image post-processing.
Assessment of clinical image quality
The clinical image quality evaluators consisted of 14 oral and maxillofacial radiology specialists. Before assessing the image quality, the evaluators were trained in image quality assessment and they discussed the reliability and consistency of the assessment. 50 post-processed real-skull images were divided into 4 distinct groups according to the test phantom images that corresponded to each other: the incisor, premolar, molar, and TMJ groups. The images from each group were each randomly submitted to all of the 14 evaluators. The evaluators observed and scored only their assigned regions. The image quality was graded on a 4-point scale: 1. good, 2. normal, 3. poor but interpretable, and 4. not interpretable.
Statistical analysis
The images of the incisor, premolar, and TMJ groups were assessed by 14 evaluators, and those of the molar region were assessed by 13 evaluators. The acquired scores of the images in the same group were averaged by each line-pair value. The mean scores decreased as the line-pair values increased, and the reference line-pair value was determined according to the line-pair value scored less than 2 points for the first time. Inter-evaluator reliability was calculated by intra-class correlation (ICC). All statistical analyses were performed using SPSS for Windows (version 12.0, SPSS Inc., Chicago, IL, USA). A p value of <0.01 was considered statistically significant.
Results
A total of 50 images of the incisor, premolar, molar, and TMJ regions were submitted to 14 evaluators. The evaluators were oral and maxillofacial radiology specialists and trained in image quality assessment prior to the evaluations. The incisor, premolar, and TMJ regions were assessed by 14 evaluators, and the molar region was evaluated by 13 evaluators (one evaluator did not evaluate the images of the molar region). The inter-evaluator reliability was calculated using ICC. The ICC analysis revealed a high intra-observer agreement rate in both individual and average measurements with statistical significance (p<0.001) (Table 1).
Table 1.
Inter-evaluator reliability is calculated by intra-class correlation (ICC)

*p<0.001, LP: line pair, ICC1=single measure, ICC2=average measure
Incisor region
The mean scores tended to decrease as line-pair values increased. The opposite tendency was observed at a few line-pair values and this tendency was most prominent at 1.52 LP/mm with statistical significance. As the line-pair values increased, the images were rarely assessed as good quality (1 point). A mean score of less than 2 points was not observed. Since the images at 3.19 LP/mm had the first score closest to 2 points (2.07 points), 3.19 LP/mm was determined to be the reference line-pair value (Fig. 7).
Fig. 7.
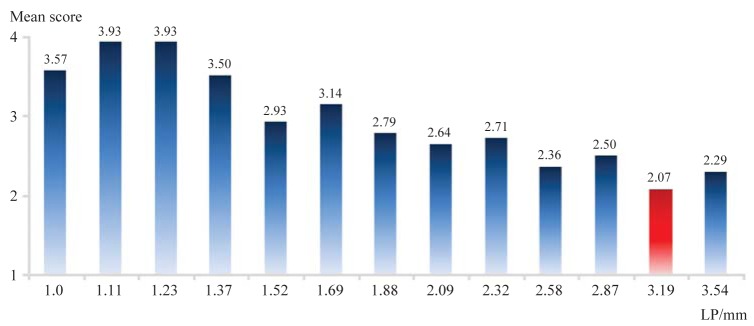
The mean scores in the incisor group tend to decrease as the line-pair values increased. 3.19 LP/mm is determined to be the reference line-pair value.
Premolar region
The mean scores consistently decreased as the line-pair values increased up to 2.87 LP/mm, and then the mean scores increased slightly at values over 2.87 LP/mm. Images at 2.32 LP/mm showed the first mean score of less than 2 points. Therefore, 2.32 LP/mm was determined to be the reference line-pair value (Fig. 8).
Fig. 8.
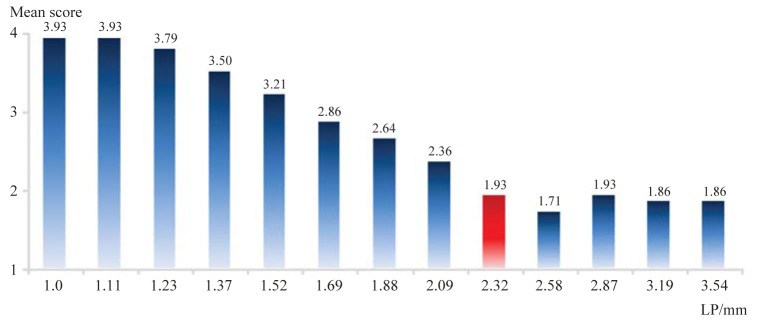
The mean scores in the premolar group tend to decrease as the line-pair values increases. 2.32 LP/mm is determined to be the reference line-pair value.
Molar region
The mean scores consistently decreased as the line-pair values increased. Images at 1.88 LP/mm had the first mean score of less than 2 points, and this value was determined to be the reference line-pair value (Fig. 9).
Fig. 9.
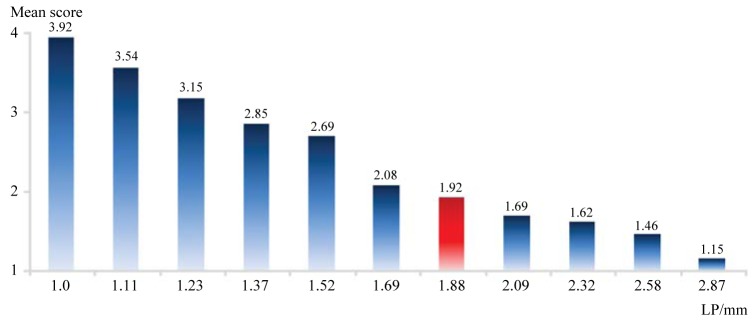
The mean scores in the molar group consistently decrease as the line-pair values increases. 1.88 LP/mm is determined to be the reference line-pair value.
TMJ region
The mean scores tended to decrease as the line-pair values increased. The opposite tendency was observed at a few line-pair values and was remarkable at 1.52 LP/mm. The mean scores consistently decreased as the line-pair values increased. Images at 2.32 LP/mm had the first mean score of less than 2 points, and this value was thus determined to be the reference line-pair value (Fig. 10).
Fig. 10.
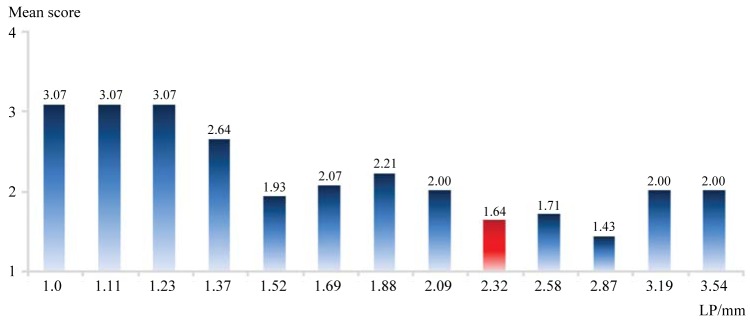
The mean scores in the TMJ group tend to decrease as the line-pair values increases. 2.32 LP/mm is determined to be the reference line-pair value.
Discussion
Spatial resolution assessment of radiographic systems with an objectified phantom is essential for accurate image quality control. The Nuclear Associates model 07-501 Ser. No.12913 (Fluke Co., Cleveland, OH, USA) line-pair test phantom, was used in our study. In contrast with the MTF test, this method is not very complicated to conduct or overly sensitive. Dentists are in charge of managing panoramic radiographic systems in clinics, and because they are not technicians, this method can be used as a substitute for the MTF. Gopal and Samant7 have demonstrated that image quality assurance using bar patterns, similar to the line-pair phantoms, is an appropriate tool for routine quality assurance since it can make fundamental imaging metrics, including MTF, NPS, and DQE, computed using a sequence of algorithms.
A line-pair test phantom and a transparent real skull X-ray phantom (product no. 7280) were used in our study. The mean scores obtained from images of the incisor group decreased with increasing line-pair values. The opposite tendency was also observed at a few line-pair values. Images of the incisor group rarely received 1 point, even though the line-pair values increased. This is partly due to the small size of the anatomical structures and subtle structural changes of the incisor region. Therefore, a certain level of clinical image quality is absolutely necessary in these regions. The line-pair value of the images that had the first mean score less than 2 points was determined to be the reference line-pair value; however, no images of the incisor group had a mean score less than 2 points. Since the mean score of the images at 3.19 LP/mm (2.07 points) was the closest to 2 points, 3.19 LP/mm was considered to be the reference line-pair value.
The mean scores of the images in the premolar group consistently decreased as the line-pair values increased. Since the images at 2.32 LP/mm had the first mean score less than 2 points, 2.32 LP/mm was determined to be the reference line-pair value. This tendency was reversed when the line-pair value was over 2.87 LP/mm; thus the mean value was increased slightly. The reason for this is that the parameters for adjusting the line-pair values are also related to the noise factor. The mean scores of the images were relatively higher in the premolar region than in the molar region. The evaluators pointed out that this might be related to excessive overlapping of the interproximal surfaces due to a moderate reverse in the skull's curve of Spee.
In the molar group images, the mean scores consistently decreased as the line-pair values increased. The images at 1.88 LP/mm had the first mean score less than 2 points, and 1.88 LP/mm was thus determined to be the reference line-pair value. This value was the lowest among the reference line-pair values of the 4 groups. Because anatomical structures are relatively large in the molar region, a relatively lower line-pair value was required in this region.
Although in the TMJ region, the phantom images were deformed due to location characteristics and the moving path of the system, the line-pair values were important in getting interpretable images. The mean scores of the TMJ group images also decreased as the line-pair values increased. Since the images at 2.32 LP/mm had the first mean score less than 2 points, 2.32 LP/mm was determined to be the reference line-pair value.
In 2009, the Deutsches Institut für Normung (DIN) located in Germany proposed a minimal requirement value of 2.5 LP/mm to acquire images with acceptable diagnostic value.9 The reference line-pair value was the highest in the incisor group (3.19 LP/mm) in our study, and this exceeded the minimal requirement (2.5 LP/mm) proposed by the DIN. The reason for this may be the increased radiopacity of the soft tissue replica around the cervical vertebrae of the real skull model. Further studies are required to verify the appropriateness of this soft tissue value. The reference line pairs of the TMJ and premolar regions were the same (2.32 LP/mm) and were slightly lower than the minimal requirement of 2.5 LP/mm proposed by the DIN. The reference line pair at the molar region was the lowest (1.88 LP/mm). Therefore, the overall reference line pair can be determined to be 3.19 LP/mm. However, the image evaluation criteria for the incisor region images showed limitations in examining panoramic radiographs. This is due to the characteristics of panoramic radiographic systems that combine principles of tomography and slit-beam scanography. Clinicians often observe that the quality of images varies depending on the region in the same panoramic radiographs. We should determine whether the causes of inconsistency are equipment problems, such as faulty sensors or mismatches between the arch and the image layer, or any other problems, including errors during radiograph acquisition. Therefore, image quality evaluation methods and criteria should be able to assess all the different regions considering the characteristics of panoramic systems as well. This study aimed to present the overall and regional reference line-pair values and to establish a set of standard values.
Detailed methods and reference values are necessary for clinical and phantom image quality evaluation to carry out image quality control of panoramic radiographic images. For the quality control procedure, image quality evaluation forms should be prepared and standard phantoms for testing should be selected. Reference values should be provided as a guideline for the assessment. We aimed to establish a new image quality management system by identifying reference line-pair values of panoramic clinical images of good quality. Further studies are needed to confirm our results.
References
- 1.Yoo S, Kim GY, Hammoud R, Elder E, Pawlicki T, Guan H, et al. A quality assurance program for the on-board imagers. Med Phys. 2006;33:4431–4447. doi: 10.1118/1.2362872. [DOI] [PubMed] [Google Scholar]
- 2.Enforcement regulation No.65 of Ministry of Health and Welfare. 2003. Enforcement regulations of the installation and operation of special medical equipments. [Google Scholar]
- 3.Lee SH, Choe YH, Chung SY, Kim MH, Kim EK, Oh KK, et al. Establishment of quality assessment standard for mammographic equipments: evaluation of phantom and clinical images. J Korean Radiol Soc. 2005;53:117–127. [Google Scholar]
- 4.Korean Institute for Accreditation of Medical Imaging [internet] Table for mammographic quality control. Available from: http://www.ikiami.or.kr/Data/KMI501QD.aspx.
- 5.Kin HJ, Lee HG, Jeong JB, Im CI, Son HK. A study on guidance for medical radiation safety. Final report. Seoul: Korea Food and Drug Administration; 2010. Report No.: 10171Radiology 457. [Google Scholar]
- 6.White SC, Pharoah MJ. Oral Radiology: principles and interpretation. 6th ed. St. Louis: Mosby-Year Book Inc; 2009. [Google Scholar]
- 7.Gopal A, Samant SS. Use of a line-pair resolution phantom for comprehensive quality assurance of electronic portal imaging devices based on fundamental imaging metrics. Med Phys. 2009;36:2006–2015. doi: 10.1118/1.3099559. [DOI] [PubMed] [Google Scholar]
- 8.Raberin M, Laumon B, Martin JL, Brunner F. Dimensions and form of dental arches in subjects with normal occlusions. Am J Orthod Dentofacial Orthop. 1993;104:67–72. doi: 10.1016/0889-5406(93)70029-N. [DOI] [PubMed] [Google Scholar]
- 9.DIN German Institute for Standardization. DIN 6868-151. Image quality assurance in diagnostic X-ray departments - Part 151: acceptance testing of dental radiographic equipment accordance to RöV - Rules for the inspection of image quality after installation, maintenance and modification. Berlin: DIN Deutsches Institut fur Normung e. V.; 2010. [Google Scholar]


