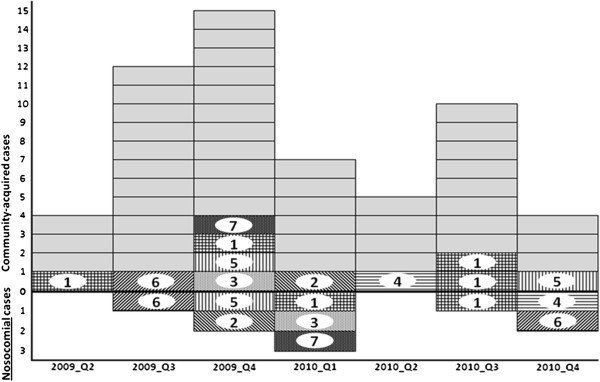
Figure 1.

Epidemic curve of ESBL anal colonization in our septic orthopaedic ward. Horizontal axis: Study years stratified in quarters. Vertical axis: Number of positive ESBL isolates on the septic ward. The zero lines divide community-acquired cases (above) from nosocomially acquired cases (below). Grey cases are isolates without genotypic relation to other isolates. Genotypically identical strains are marked with numbers (for example isolate 5 occurs three times).
