

Abstract
Objective
To systematically review cohort studies of mortality among people who inject drugs, examine mortality rates and causes of death in this group, and identify participant- and study-level variables associated with a higher risk of death.
Methods
Tailored search strings were used to search EMBASE, Medline and PsycINFO. The grey literature was identified through online grey literature databases. Experts were consulted to obtain additional studies and data. Random effects meta-analyses were performed to estimate pooled crude mortality rates (CMRs) and standardized mortality ratios (SMRs).
Findings
Sixty-seven cohorts of people who inject drugs were identified, 14 of them from low- and middle-income countries. The pooled CMR was 2.35 deaths per 100 person–years (95% confidence interval, CI: 2.12–2.58). SMRs were reported for 32 cohorts; the pooled SMR was 14.68 (95% CI: 13.01–16.35). Comparison of CMRs and the calculation of CMR ratios revealed mortality to be higher in low- and middle-income country cohorts, males and people who injected drugs that were positive for human immunodeficiency virus (HIV). It was also higher during off-treatment periods. Drug overdose and acquired immunodeficiency syndrome (AIDS) were the primary causes of death across cohorts.
Conclusion
Compared with the general population, people who inject drugs have an elevated risk of death, although mortality rates vary across different settings. Any comprehensive approach to improving health outcomes in this group must include efforts to reduce HIV infection as well as other causes of death, particularly drug overdose.
Résumé
Objectif
Examiner systématiquement les études de cohortes de la mortalité chez les toxicomanes par injection, étudier les taux de mortalité et les causes de décès dans ce groupe, et identifier les variables, au niveau des participants et des études, associées à un risque accru de décès.
Méthodes
Des critères de recherche spécifiquement adaptés ont été utilisés pour les recherches réalisées sur EMBASE, Medline et PsycINFO. La littérature grise a été identifiée par le biais de bases de données de littérature grise disponibles en ligne. Des experts ont été consultés pour obtenir des données et des études supplémentaires. Des méta-analyses des effets aléatoires ont été réalisées afin d’estimer les taux bruts de mortalité (TBM) groupés et les taux de mortalité standardisés (TMS).
Résultats
Soixante-sept cohortes de personnes qui s'injectent des drogues ont été identifiées, dont 14 appartenant à des pays à revenu faible et intermédiaire. Le TBM groupé était de 2,35 décès pour 100 personnes-années (intervalle de confiance de 95%, IC: 2,12 – 2,58). Les TMS étaient indiqués pour 32 cohortes, avec un TMS groupé de 14,68 (IC de 95%: 13,01 – 16,35). La comparaison des TBM et le calcul des taux de TMS ont révélé une mortalité plus élevée parmi les cohortes des pays à revenu faible et intermédiaire, les sujets masculins et les toxicomanes par injection séropositifs. Elle était également plus élevée pendant les périodes d’interruption thérapeutique. L’overdose et le syndrome d'immunodéficience acquise (SIDA) étaient les causes principales des décès parmi ces cohortes.
Conclusion
Si l’on compare avec la population globale, les personnes qui s'injectent des drogues ont un risque élevé de décès, bien que les taux de mortalité varient selon les contextes. Toute approche exhaustive visant à améliorer les résultats de ce groupe en matière de santé doit comprendre des efforts en vue de diminuer l'infection par le VIH, ainsi que d'autres causes de décès, notamment l’overdose.
Resumen
Objetivo
Revisar de forma sistemática los estudios de cohortes sobre la mortalidad entre los consumidores de drogas inyectables, examinar las tasas de mortalidad y las causas de muerte en este grupo e identificar las variables relacionadas con el estudio y los participantes asociadas a un mayor riesgo de muerte.
Métodos Se emplearon cadenas de búsqueda adaptadas para registrar EMBASE, Medline y PsycINFO. La literatura gris se identificó por medio de bases de datos de literatura gris en línea. Se consultaron expertos a fin de obtener datos y estudios adicionales y se llevaron a cabo metaanálisis de efectos aleatorios para calcular las tasas brutas combinadas de mortalidad y las tasas de mortalidad estandarizadas.
Resultados Se identificaron diecisiete cohortes de consumidores de drogas inyectables, 14 de las cuales en países con ingresos bajos y medios. La tasa bruta combinada de mortalidad fue de 2,35 fallecimientos por cada 100 años-persona (intervalo de confianza del 95%, IC: 2,12-2,58). Se declararon las tasas de mortalidad estandarizadas para 32 cohortes; la tasa bruta combinada de mortalidad fue de 14,68 (IC 95%: 13,01-16,35). La comparación de las tasas brutas combinadas de mortalidad y el cálculo de las proporciones de la mortalidad bruta combinada revelaron que la mortalidad fue superior en las cohortes de países con ingresos bajos y medios, en varones y entre consumidores de drogas inyectables que dieron positivo para el virus de la inmunodeficiencia humana (VIH), así como durante los periodos sin tratamiento. Las sobredosis y el síndrome de la inmunodeficiencia adquirida (SIDA) fueron las causas principales de muerte en las cohortes.
Conclusión En comparación con la población general, los consumidores de drogas inyectables presentan un riesgo elevado de muerte, si bien las tasas de mortalidad varían en los distintos lugares. Cualquier enfoque completo para mejorar los resultados sanitarios en este grupo deberá esforzarse por reducir la infección por VIH, así como las otras causas de muerte, en especial, la sobredosis.
ملخص
الغرض
استعراض الدراسات الأترابية المعنية بمعدل الوفيات بين الأشخاص الذين يتعاطون المخدرات عن طريق الحقن على نحو منهجي، ودراسة معدلات الوفيات وأسباب الوفاة في هذه الفئة، وتحديد متغيرات مستوى المشاركين والدراسة المرتبطة بارتفاع خطر الوفاة.
الطريقة
تم استخدام عبارات بحث مخصصة للبحث في قواعد بيانات EMBASE وMedline وPsycINFO. وتم تحديد الكتابات غير الرسمية من خلال قواعد بيانات الكتابات غير الرسمية على شبكة الإنترنت. وتم استشارة الخبراء للحصول على دراسات وبيانات إضافية. وتم إجراء التحليلات الوصفية للتأثيرات العشوائية لتقييم معدلات الوفيات الأولية المجمعة (CMRs) ونسب الوفيات الموحدة (SMRs).
النتائج
تم تحديد سبع وستين مجموعة من الأشخاص الذين يتعاطون المخدرات عن طريق الحقن، أربع عشرة منها من البلدان المنخفضة والمتوسطة الدخل. وكان معدل الوفيات الأولي المجمع 2.35 وفاة لكل 100 شخص-سنة (فاصل الثقة 95 %، فاصل الثقة: 2.12 إلى 2.58). وتم الإبلاغ عن نسب الوفيات الموحدة لاثنتين وثلاثين مجموعة؛ وكانت نسبة الوفيات الموحدة 14.68 (فاصل الثقة 95 %: 13.01 إلى 16.35). وأظهرت مقارنة معدلات الوفيات الأولية وحساب نسب معدلات الوفيات الأولية ارتفاع معدل الوفيات في البلدان المنخفضة والمتوسطة الدخل بين المجموعات والذكور والأشخاص الإيجابيين لفيروس العوز المناعي البشري (HIV) الذين تعاطوا المخدرات عن طريق الحقن. وكان المعدل مرتفعاً كذلك خلال فترات وقف العلاج. وكان فرط جرعة المخدرات ومتلازمة العوز المناعي المكتسب (الأيدز) السببين الرئيسيين للوفاة بين المجموعات.
الاستنتاج
مقارنة بعامة السكان، يتعرض الأشخاص الذين يتعاطون المخدرات عن طريق الحقن لخطر وفاة مرتفع، على الرغم من تفاوت معدلات الوفيات بين البيئات المختلفة. ويجب أن يتضمن أي نهج شامل لتحسين حصائل الصحة في هذه الفئة جهوداً لخفض عدوى الإصابة بفيروس العوز المناعي البشري بالإضافة إلى غيرها من أسباب الوفاة، ولاسيما فرط جرعة المخدرات.
摘要
目的
系统回顾药物注射人群死亡率的队列研究,检查该群体的死亡率和死亡原因,并确定与较高死亡风险相关的参与水平和研究水平变量。
方法
使用定制的搜索字符串搜索EMBASE、Medline和PsycINFO。通过网上灰色文献数据库识别灰色文献。咨询专家以获取更多的研究和数据。执行随机效果荟萃分析来估计汇集的粗死亡率(CMR)和标准化死亡率(SMR)。
结果
确定67 个药物注射人群队列,其中14 个来自中低收入国家。汇集的CMR为每100 人年2.35 例死亡(95%置信区间,CI:2.12-2.58)。报告32 个队列的SMR;汇集的SMR为14.68(95% CI:13.01-16.35)。CMR的比较和CMR比率的计算表明,中低收入国家的队列、男性以及艾滋病毒(HIV)呈阳性的药物注射人群中的死亡率较高。治疗结束期间死亡率也较高。药物过量和艾滋病(AIDS)是各个队列的主要死亡原因。
结论
尽管不同环境中的死亡率各异,与普通人群相比,药物注射人群的死亡风险更高。任何改善该群体的健康疗效的综合方案都必须包括减少艾滋病毒感染以及其他死亡致因(尤其是药物过量)的努力。
Резюме
Цель
Провести систематический обзор когортных исследований смертности среди лиц, вводящих наркотики внутривенно, изучить уровни смертности и причины смерти в данной группе и определить переменные на уровне участников и исследований, связанные с высоким риском смерти.
Методы
Поиск исследований осуществлялся по базам данных EMBASE, Medline и PsycINFO по специализированным критериям поиска. Поиск литературы для служебного пользования осуществлялся по онлайновым базам данных литературы для служебного пользования. С целью получения дополнительных данных и исследований проводились консультации с экспертами. Для определения суммарных общих показателей смертности (ОПС) и стандартизированных коэффициентов смертности (СКС) выполнялся мета-анализ случайных эффектов.
Результаты
Были выявлены шестьдесят семь когорт лиц, вводящих наркотики внутривенно, 14 из которых относятся к странам с низким и средним уровнями доходов. Суммарный ОПС составлял 2,35 смертей на 100 человеко-лет (95% доверительный интервал, ДИ: 2,12–2,58). СКС фиксировался для 32 когорт; суммарный СКС составлял 14,68 (95% ДИ: 13,01-16,35). Сравнение ОПС и расчет коэффициентов ОПС выявил высокий уровень смертности в когортах, относящихся к странам с низким и средним уровнями доходов, среди мужчин и лиц, вводивших наркотики внутривенно, которые имели положительные результаты на вирус иммунодефицита человека (ВИЧ). Высокий уровень также отмечен вне периодов лечения. Передозировка наркотиков и синдром приобретенного иммунодефицита (СПИД) являлись основными причинами смерти в когортах.
Вывод
По сравнению с населением в целом, лица, вводящие наркотики внутривенно, подвержены повышенному риску смерти несмотря на то, что уровни смертности варьируются в зависимости от условий. Любой комплексный подход к улучшению результатов мероприятий по охране здоровья в данной группе должен включать в себя меры по сокращению уровня ВИЧ-инфекции, а также других причин смерти, в особенности, передозировки наркотиков.
Introduction
People who use drugs, especially by injection, are at higher risk of dying from both acute and chronic diseases, many of which are related to their drug use, than people who do not use these drugs. Fatal overdose and infection with human immunodeficiency virus (HIV) and other blood-borne viruses transmitted through shared needles and syringes are the most common causes of death in this group.1 Understanding causes of death is important when setting priorities for programmes designed to reduce deaths from the use of drugs. Longitudinal studies of people who inject drugs are critical for assessing the magnitude, nature and correlates of the risk of death in this population.
A systematic review conducted in 2004 identified 30 prospective studies published between 1967 and 2004 that dealt with “problematic drug users” or people who inject drugs.2 These reviews have consistently shown that the practice of injecting drugs is associated with an elevated risk of death, particularly from the complications of HIV infection, drug overdose and suicide. Since these reviews were conducted, the number of studies examining mortality among cohorts of people who inject drugs has risen substantially. This has made it possible to perform fine-grained analyses that were not feasible in earlier reviews. Furthermore, those earlier reviews did not examine the potential impact of study-level variables, variation across countries, or of participant-level variables that could affect both mortality rates and differences in causes of death, yet study-level evidence suggests that males who inject drugs may be at higher risk of dying than females and that different types of drugs are associated with different risks of death.3–5 Findings from other reviews have also suggested that rates of death among people who are dependent on opioids are different from the rates of death observed in people who are dependent on stimulants such as cocaine and amphetamine type stimulants.3–5
In recent years the number of studies reporting on mortality among people who inject drugs has increased. Hence, the objective of this review was to determine the following:
overall crude mortality rates (CMRs) and excess deaths across cohorts of people who inject drugs, by sex;
causes of death across studies, particularly from drug overdose and acquired immunodeficiency syndrome (AIDS); differences in mortality rates and causes of death among HIV-positive (HIV+) and HIV-negative (HIV−) people who inject drugs;
differences in mortality rates across cohorts by geographical location and country income level;
mortality rates by type of drug injected (e.g. opioids versus stimulants);
mortality rates during in-treatment and off-treatment periods.
Methods
Identifying studies
A recent series of reviews identified cohort studies among opioid, amphetamine and cocaine users to examine mortality.3–5 In these reviews tailored search strings were used to search three electronic databases for studies published between 1980 and 2012: Medline, EMBASE and PsycINFO. The search strings contained keywords and database-specific terms (MeSH headings, EMTREE terms and explode terms; Box 1). All results were limited to human subjects. We identified grey literature sources reporting on mortality by searching online grey literature databases, library databases and the web sites listed in a published technical report.6 To make sure that no relevant papers had been missed, we sent the draft lists of the papers identified through these searches to experts for their review.
Box 1. Strategy for search of the peer-reviewed literature.
Database specific search terms were developed and combined using Boolean operators as follows:
( < opioids > OR < cocaine > OR < amphetamine type stimulants > ) AND < drug use > AND < mortality > AND < longitudinal studies >
All results were limited to human subjects and publication years between 1980 and 2012. The full search strings used for each database were as follows:
Medline: ((heroin or opiate$ OR opium OR opioid$ OR Exp Opium/ OR exp Narcotics/ OR exp Heroin Dependence/ OR exp Heroin/ OR exp Morphine/ OR exp Opioid-Related Disorders/ OR exp Opiate Alkaloids/ OR exp Methadone/ OR exp Analgesics, Opioid/) OR (Cocaine exp Cocaine-Related Disorders/ or exp Cocaine/ or exp Crack Cocaine/) OR (ATS OR amphetamine type stimulant$ OR amphetamine$ OR methamphetamine OR deoxyephedrine OR desoxyephedrine OR Desoxyn OR madrine OR metamfetamine OR methamphetamine hydrochloride OR methylamphetamine OR n-methylamphetamine OR d-amphetamine OR dextroamphetamine sulfate OR dexamphetamine OR dexedrine OR dextro-amphetamine sulfate OR dextroamphetamine sulfate OR d-amphetamine sulfate OR stimulant$ exp amphetamines/ or exp amphetamine/ or exp dextroamphetamine/ or exp p-chloroamphetamine/ or exp 2,5-dimethoxy-4-methylamphetamine/ or exp p-hydroxyamphetamine/ or exp iofetamine/ or exp methamphetamine/ or exp benzphetamine/ or exp phentermine/ or exp chlorphentermine/ or exp mephentermine/ or exp amphetamine-related disorders/)) AND (drug abuse$ OR drug use$ OR drug misuse$ OR drug dependenc$ OR substance abuse$ OR substance use$ OR substance misuse$ OR substance dependenc$ OR addict$ OR Exp Substance-related disorders/) AND (Mortal$ OR fatal$ OR death$ OR exp “death and dying”/ OR exp mortality/ OR exp hospitalization) AND (“cohort” OR “longitudinal” OR “incidence” OR “prospective” OR “follow-up” OR exp cohort studies/ OR exp longitudinal studies/ OR exp follow-up studies/ OR exp prospective studies/)
EMBASE: ((heroin OR opioid$ OR opiate$ OR opium OR exp Diamorphine/ OR exp Opiate/ OR exp Methadone treatment/ OR exp Methadone/) OR (Cocaine exp Cocaine-Related Disorders/ or exp Cocaine/ or exp Crack Cocaine/) OR (ATS OR amphetamine type stimulant$ OR amphetamine$ OR methamphetamine OR deoxyephedrine OR desoxyephedrine OR Desoxyn OR madrine OR metamfetamine OR methamphetamine hydrochloride OR methylamphetamine OR n-methylamphetamine OR d-amphetamine OR dextroamphetamine sulfate OR dexamphetamine OR dexedrine OR dextro-amphetamine sulfate OR dextroamphetamine sulfate OR d-amphetamine sulfate OR stimulant$ exp amphetamines/ or exp amphetamine/ or exp dextroamphetamine/ or exp p-chloroamphetamine/ or exp 2,5-dimethoxy-4-methylamphetamine/ or exp p-hydroxyamphetamine/ or exp iofetamine/ or exp methamphetamine/ or exp benzphetamine/ or exp phentermine/ or exp chlorphentermine/ or exp mephentermine/ or exp amphetamine-related disorders/)) AND (Drug abuse OR drug use$ OR drug misuse OR drug dependenc$ OR substance abuse OR substance use$ OR substance misuse OR substance dependenc$ OR addict$ OR exp substance abuse/ OR exp drug abuse/ OR exp analgesic agent abuse/ OR exp drug abuse pattern/ OR exp drug misuse/ OR exp drug traffic/ OR exp multiple drug abuse/ OR exp addiction/ OR exp drug dependence/ OR exp cocaine dependence/ OR narcotic dependence/ OR exp heroin dependence/ OR exp morphine addiction/ OR exp opiate addiction/) AND (Mortal$ OR fatal$ OR death$ OR exp death/ OR exp “cause of death”/ OR exp accidental death/ OR exp sudden death/ OR exp fatality/ OR exp mortality/ OR exp hospitalization/) AND (“cohort” OR “longitudinal” OR “incidence” OR “prospective” OR “follow-up” OR exp cohort analysis/ OR exp longitudinal study/ OR exp prospective study/ OR exp follow up/)
PsychINFO: ((“heroin” OR “opium” OR “opiate$” OR “methadone” OR exp Opiates/ OR exp METHADONE/ OR exp HEROIN ADDICTION/ OR exp HEROIN) OR (Cocaine exp Cocaine-Related Disorders/ or exp Cocaine/ or exp Crack Cocaine/) OR (ATS OR amphetamine type stimulant$ OR amphetamine$ OR methamphetamine OR deoxyephedrine OR desoxyephedrine OR Desoxyn OR madrine OR metamfetamine OR methamphetamine hydrochloride OR methylamphetamine OR n-methylamphetamine OR d-amphetamine OR dextroamphetamine sulfate OR dexamphetamine OR dexedrine OR dextro-amphetamine sulfate OR dextroamphetamine sulfate OR d-amphetamine sulfate OR stimulant$ exp amphetamines/ or exp amphetamine/ or exp dextroamphetamine/ or exp p-chloroamphetamine/ or exp 2,5-dimethoxy-4-methylamphetamine/ or exp p-hydroxyamphetamine/ or exp iofetamine/ or exp methamphetamine/ or exp benzphetamine/ or exp phentermine/ or exp chlorphentermine/ or exp mephentermine/ or exp amphetamine-related disorders/)) AND (Drug abuse OR drug use$ OR drug misuse OR drug dependenc$ OR substance abuse OR substance use$ OR substance misuse OR substance dependenc$ OR addict$ OR Exp drug abuse/ OR exp drug addiction/ OR exp addiction/ OR exp drug usage) AND (Mortal$ OR fatal$ OR death$ OR exp “death and dying”/ OR exp mortality/ OR exp hospitalization) AND (“cohort” OR “longitudinal” OR “incidence” OR “prospective” OR “follow-up” OR Exp age differences/ OR exp cohort analysis/ OR exp human sex differences)
Note: $ indicates wildcard.
For the current study we examined all papers found in the reviews of drug-related mortality but selected only cohorts composed of people who injected opioids and other drugs. We used the strategy outlined in the preceding paragraph to further search for these cohorts. We included in the analysis only studies of drug users that included mortality data disaggregated by participants’ injecting drug use; studies were included only if more than 70% of the cohort was composed of people who injected drugs.
The searches yielded a total of 5981 studies of mortality related to the use of opioids, amphetamines and cocaine. We identified another 79 articles by searching the reference lists of reviews on mortality related to drug use. Experts provided additional studies for 16 cohorts. From these 5981 articles we excluded a total of 5762: 4999 did not focus on drug dependence or mortality, 118 did not include raw data, 292 were case series, and 600 had insufficient mortality data on people who inject drugs. In total, we selected 67 cohort studies for inclusion in the analyses (Fig. 1). These studies were further assessed using STROBE reporting guidelines.7
Fig. 1.

Flowchart showing study selection process for systematic review of studies on mortality in people who inject drugs
Data extraction
Once we had identified all studies, one of the authors (JL) extracted the data into an Excel database (Microsoft, Redmond, United States of America) and two others rechecked them (BM, CB). This yielded the basic data set for the statistical analyses. We extracted information on the location of each study, the period of recruitment and duration of follow-up, the number of people in the cohort, the percentage of people in the cohort who injected drugs, the number of person–years (PY) of follow-up and the number of deaths.
We extracted CMRs and standardized mortality ratios (SMRs). We expressed CMRs as the number of deaths per 100 PY of follow-up. We reported SMRs as calculated in the source papers. In several cases standard errors, confidence intervals (CIs) and CMRs were not reported, so we estimated them using standard calculations. We also put into the database CMRs and SMRs that were reported according to sex, HIV status, treatment status and type of drug injected, as well as data on deaths from drug overdose or AIDs-related causes.
We included in the analyses studies that specified treatment status if they classified the data by mutually exclusive treatment groups or periods. We only included studies in which the exact dates of entry into and exit from the study had been recorded and used to calculate the number of PYs, the number of deaths and mortality rates.
Statistical analysis
We performed meta-analyses to estimate pooled all-cause CMRs and all-cause SMRs, and pooled estimates of deaths from specific causes, as in previous reviews.8 To perform the meta-analyses we used the “metan” command in STATA version 10.1 (StataCorp LP, College Station, USA). The “metan” command uses inverse-variance weighting to calculate random effects pooled summary estimates and their confidence limits, true effect differences between studies and study heterogeneity.9,10 Random effects models allow for heterogeneity between and within studies. We expected high levels of heterogeneity between studies because of the marked differences between the samples of people injecting drugs; accordingly, we applied a random effects model to all analyses. The appropriateness of this a priori decision was confirmed by the resultant χ2 and the I-squared statistic. To further investigate this heterogeneity, when the data permitted we divided the cohorts into subgroups and used CMR ratios to compare differences in mortality.11 We made comparisons between subgroups as follows: sex (male versus female); primary drug injected at baseline (opioids versus stimulants); HIV status (HIV+ versus HIV−); and treatment for drug dependence (in-treatment period versus off-treatment period).
We examined the following as potential sources of heterogeneity in CMRs or SMRs using random effects univariate meta-regressions in STATA: geographic region, country income group (based on World Bank categories), percentage of sample that injected drugs, were male or were HIV+ at baseline; presence of opioid users in the cohort; and the year in which the follow-up period ended.12,13
Results
We included 67 cohorts in the analysis; 14 were from low- and middle-income countries (Table 1). Studies from Europe, North America and Australasia were the most common; nine studies were from Asia and one was from South America. The pooled CMR across the 65 cohorts for which a CMR was provided was 2.35 deaths per 100 PY (Fig. 2). Cohorts from Asia had the highest pooled CMRs (5.25), followed by the cohorts from North America (2.64) and western Europe (2.31); cohorts from Australasia had the lowest pooled CMR (0.71).
Table 1. Studies included in this systematic review of studies on mortality among people who inject drugs.
| Study | Country | Country income | Sampling frame | n | People who inject drugs (%) | Males (%) | Drug(s) used | Recruitment period | End of follow-up period | PYs of follow-up | CMR | 95% CI | SMR | 95% CI |
|---|---|---|---|---|---|---|---|---|---|---|---|---|---|---|
| Antolini et al. (2006)14 | Italy | High | DTS | 4644 | 100 | 79.1 | O, S | 1975–1999 | 1999 | 39 667 | 2.01 | 1.80–2.16 | 13.01 | 12.11–13.91 |
| Azim et al. (2008)15 | Bangladesh | Low | DTS | 552 | 100 | 100 | O | 2002–2004 | 2007 | 901.6 | 6.32 | 4.68–7.96 | – | – |
| Azim et al. (2009)16 | Bangladesh | Low | DTS | 675 | 100 | 100 | O | 2005–2007 | 2007 | 1191.7 | 3.52 | 2.46–4.59 | – | – |
| Bargagli et al. (2001)17 | Italy | High | DTS | 11 432 | 84 | 82.2 | O | 1980–1995 | 1997 | 80 787 | 2.15 | 2.05–2.25 | 17.3 | 16.5–18.2 |
| Bauer et al. (2008)18 | Austria | High | DTS | 114 | 99a | 58.8 | O | 1998–1999 | 2004 | 534.8 | 5.42 | 3.45–7.40 | 29.13 | 19.27–44.04 |
| Brancato et al. (1995)19 | Italy | High | DTS | 138 | 100 | 76.8 | O | 1985 | 1994 | 1272 | 2.04 | 1.26–2.83 | – | – |
| Cardoso et al. (2006)20 | Brazil | Middle | NSP | 478 | 100 | 78.7 | S | 2000–2001 | 2001 | 612 | 2.77 | 1.45–4.09 | – | – |
| Ciccolallo et al. (2000)21 | Italy | High | DTS | 4260 | 100 | 78.0 | – | 1975–1995 | 1995 | 28 424 | 2.26 | 2.08–2.43 | 30.7 | 17.3–44.0 |
| Clausen et al. (2008)22 | Norway | High | DTS | 3789 | 90–95 | 68.1 | O | 1997–2003 | 2003 | 10 934 | 1.95 | 1.7–2.23 | – | – |
| Cornish et al. (2010)23 | United Kingdom | High | HC | 5577 | ≥ 70b | 69 | O | 1990–2005 | 2005 | 17 731.5 | 1.00 | 0.86–1.15 | – | – |
| Copeland et al. (2004)24 | United Kingdom | High | DTS | 660 | 100 | 67.4 | – | 1980–2001 | 2001 | 6244 | 2.45 | 2.06–2.84 | 17.45 | 14.59–20.3 |
| Davoli et al. (2007)25 | Italy | High | DTS | 10 454 | 72 | 80 | O | 1998–2001 | 2001 | 13 538.2 | 0.74 | 0.59–0.88 | – | – |
| Degenhardt et al. (2009)26 | Australia | High | DTS | 42 676 | ≥ 70b | – | O | 1985–2006 | 2006 | 425 998 | 0.89 | 0.86–0.92 | 6.4 | 6.2–6.6 |
| DiGiusto et al. (2004)27 | Australia | High | DTS | 1244 | ≥ 70b | 65.0 | O | 1998 | 2002 | 394 | 1.27 | 0.4–2.29 | – | – |
| Eskild et al. (1993)28 | Norway | High | T&C | 1009 | 100 | 64.0 | O, S | 1985–1991 | 1991 | 3136.4 | 2.77 | 2.22–3.42 | 31 | 24.6–37.4 |
| Esteban et al. (2003)29 | Spain | High | DTS | 1487 | 85 | – | O | 1990–1997 | 1997 | 4352 | 3.68 | 3.11–4.25 | – | – |
| EMCDDA (2011)30 | Bulgaria | Middle | DTS | 652 | > 80 | 81.6 | O | 1999 | 2008 | 6011 | 1.18 | 0.91–1.46 | – | – |
| EMCDDA (2011)30 | Croatia | Middle | DTS | 3059 | > 73 | 78.0 | O | 2000–2006 | 2007 | 15 968 | 1.09 | 0.93–1.25 | 10.3 | 8.9–12 |
| EMCDDA (2011)30 | Latvia | Middle | DTS | 3644 | > 98 | 80.0 | O | 2000–2009 | 2009 | 21 294 | 1.60 | 1.43–1.77 | 9.0 | 8.0–10.0 |
| EMCDDA (2011)30 | Romania | Middle | DTS | 2707 | > 94 | 30.8 | O | 2001–2006 | 2010 | 20 188 | 0.57 | 0.47–0.68 | 6.5 | 5.4–7.7 |
| EMCDDA (2011)30 | Sweden | High | DTS | 678 | > 72 | – | O | 1981–1988 | 2007 | 10 307 | 3.33 | 2.98–3.68 | 27.6 | 24.9–30.7 |
| Evans (2012)31 | USA | High | OR | 644 | 100 | 68.3 | O, S | 1997–2007 | 2007 | 4167 | 0.91 | 0.62–1.20 | ||
| Ferri et al. (2007)32 | Italy | High | DTS | 10 376 | 72 | 85.6 | O | 1998–2001 | 2001 | 15 369 | – | – | 7.77 | 6.7–8.95 |
| Fingerhood et al. (2006)33 | USA | High | DTS | 175 | 100 | O, S | 1994–1998 | 5 yearsc | 742.5 | 7.14 | 5.22–9.06 | – | – | |
| Frischer et al. (1997)34 | United Kingdom | High | DTS | 459 | 100 | 99.4 | O | 1982–1993 | 1994 | 2547 | 2.08 | 1.52–2.64 | 22 | 16.5–28.8 |
| Fugelstad et al. (1995)35 | Sweden | High | DTS, other | 472 | 100 | – | O, S | 1986–1990 | 1990 | 1793 | 3.85 | 2.94–4.76 | – | – |
| Fugelstad et al. (1997)36 | Sweden | High | DTS | 1640 | ≥ 70a | 69.2 | O, S | 1981–1988 | 1992 | 10 772 | 1.99 | 1.72–2.25 | – | – |
| Fugelstad et al. (1998)37 | Sweden | High | DTS | 101 | 100 | 55.4 | O | 1986–1988 | 1993 | 515.3 | 7.76 | 5.54–10.58 | – | – |
| Galli & Musicco (1994)38 | Italy | High | DTS | 2432 | 100 | 78.3 | O | 1980–1998 | 1991 | 16 415 | 2.52 | 2.28–2.77 | 20.5 | 20.02–24.34 |
| Goedert et al. (1995)39 | Italy | High | DTS | 4962 | 99d | – | O | 1980–1990 | 1990 | 21 130 | 1.57 | 1.41–1.75 | – | – |
| Goedert et al. (2001)40 | USA | High | DTS | 6570 | 100 | 66.0 | – | 1987–1991 | 1998 | 28 900.2 | 4.67 | 4.42–4.92 | – | – |
| Golz et al. (2001)41 | Germany | High | DTS | 178 | 100 | 58.0 | – | 1996–2000 | 2000 | 805 | 4.22 | 2.80–5.64 | – | – |
| Haarr & Nessa (2007)42 | Norway | High | DTS | 146 | 100 | 70.0 | O | 1997–2006 | 2006 | 574 | 1.92 | 0.95–3.44 | – | – |
| Hickman et al. (2003)43 | United Kingdom | High | DTS | 881 | 76 | 74.5 | O | 1997–1999 | 2001 | 2075 | 1.59 | 1.13–2.23 | – | – |
| Jafari et al. (2010)44 | Islamic Republic of Iran | Middle | DTS | 66 | 100 | – | O | – | – | 196 | 4.08 | 1.25–6.91 | – | – |
| Jarrin et al. (2007)45 | Spain | High | PR | 6575 | 100 | 77.2 | – | 1987–1996 | 2004 | 73 901 | 2.02 | 1.92–2.12 | – | – |
| Lejckova et al. (2007)46 | Czech Republic | High | DTS | 12 207 | 80 | 67.5 | O, S | 1997–2002 | 2002 | 38 131.2 | 0.84 | 0.75–0.93 | 8.15 | 7.28–9.09 |
| Liu et al. (2011)47 | China | Middle | DTS | 860 | 95.2 | 96.1 | O | 2005–2011 | 2011 | 2192.9 | 6.85 | 5.79–7.98 | ||
| Lumbreras et al. (2006)48 | Spain | High | DTS, other | 3247 | 100 | 77.4 | – | 1990–1996 | 2002 | 26 826 | 2.18 | 2.00–2.36 | – | – |
| Manfredi et al. (2006)49 | Italy | High | DTS | 1214 | 100 | 75.5 | O | 1977–1996 | 2002 | 13 280.3 | 2.04 | 1.8–2.3 | – | – |
| McAnulty et al. (1995)50 | USA | High | OR, HC | 1769 | 100 | 73.3 | – | 1989–1991 | 1992 | 3149 | 1.05 | 0.69–1.41 | 8.3 | 5.71–11.66 |
| Mezzelani et al. (1998)51 | Italy | High | DTS | 6248 | 100 | – | – | 1991 | 1991 | 6158.5 | 2.91 | 2.48–3.33 | 14.28 | 12.28–16.56 |
| Miller et al. (2007)52 | Canada | High | SIF | 572 | 100 | 53.1 | O, S | 1966–2004 | 2004 | 1608 | 1.37 | 0.80–1.94 | 16.4 | 9.1–27.1 |
| Moroni et al. (1991)53 | Italy | High | DTS | 2279 | 100 | – | O | 1981–1988 | 1989 | 13 069 | 2.43 | 2.16–2.69 | – | – |
| Moskalewicz et al. (1996)54 | Poland | Middle | DTS | 656 | 100 | 74.2 | O | 1983–1992 | 1992 | 3594 | 2.28 | 1.81–2.83 | 12.06 | 9.6–15.0 |
| Muga et al. (2007)55 | Spain | High | DTS | 1181 | 100 | 79.5 | O | 1987–2004 | 2004 | 10 116 | 3.74 | 3.38–4.14 | – | – |
| Nyhlén (2011)56 | Sweden | High | DTS | 561 | 79 | 68 | O, S | 1970–1978 | 2006 | 15 203.1 | 1.30 | 1.12–1.48 | 5.94 | 5.5–6.8 |
| O’Driscoll et al. (2001)57 | USA | High | DTS, other | 2849 | 100 | 63.9 | O, S | 1994–1997 | 1997 | 4591 | 1.59 | 1.22–1.96 | – | – |
| Oppenheimer et al. (1994)58 | United Kingdom | High | DTS | 128 | 100 | 72.7 | O | 1969 | 1991 | 2349.7 | 1.83 | 1.28–2.38 | 11.9 | 8.64–16.09 |
| Quan et al. (2007)59 | Thailand | Middle | DTS | 346 | 100 | 93.1 | O, S | 1999 | 2002 | 571.4 | 3.85 | 2.42–5.83 | 13.9 | 8.71–21.04 |
| Quan et al. (2010)60 | Viet Nam | Middle | DTS | 894 | 100 | 100 | O | 2005 | 2007 | 710.1 | 6.30 | 4.60–8.50 | 13.4 | 11.4–15.3 |
| Rahimi-Movaghar et al. (2009)61 | Islamic Republic of Iran | Middle | DTS | 79 | 100 | – | O | 2007 | 2007 | 20.7 | 4.83 | 0–14.30 | – | – |
| Reece (2010)62 | Australia | High | DTS | 2773 | 100 | 72.8 | O | 2000–2007 | 2007 | 9362.4 | 0.50 | 0.36–0.65 | – | – |
| Sánchez-Carbonell et al. (2000)63 | Spain | High | DTS | 135 | 88 | 71.0 | O | 1985 | 1995 | 1205.9 | 3.4 | 2.36–4.44 | 28.58 | 14.65–42.65 |
| Seaman et al. (1998)64 | United Kingdom | High | DTS | 316 | 100 | 100 | O | 1983–1994 | 1994 | 1416.9 | 2.33 | 1.6–3.27 | – | – |
| Solomon et al. (2009)65 | India | Middle | DTS, other | 1158 | 100 | 100 | O | 2005–2006 | 2008 | 1998 | 4.25 | 3.35–5.16 | 11.1 | 8.85–13.7 |
| Sørensen et al. (2005)66 | Denmark | High | DTS | 101 | 100 | 67.3 | O | 1980–1984 | 1999 | 1232.3 | 3.49 | 2.44–4.53 | 15.75 | 11.4–21.2 |
| Stenbacka et al. (2007)67 | Sweden | High | Multiple | 817 | 83 | 79.2 | O, S | 1967 | 2003 | 22 468.2 | 2.12 | 1.93–2.31 | 4.38 | 3.99–4.78 |
| Stoov et al. (2008)68 | Australia | High | OR, SB | 220 | 100 | 56.4 | O, S | 1990–1995 | 2006 | 3151 | 0.83 | 0.56–1.21 | – | – |
| Tait et al. (2008)69 | Australia | High | DTS | 894 | ≥ 70b | 59.6 | O | 2001–2001 | 2005 | 4166.9 | 0.54 | 0.28–0.72 | – | – |
| van Haastrecht et al. (1996)70 | Netherlands | High | DTS, other | 509 | 100 | 61.9 | O, S | 1985–1992 | 1993 | 2229 | 3.23 | 2.56–4.07 | 24.8 | 19.41–31.23 |
| Vlahov et al. (2005)71 | USA | High | OR, SB | 3593 | 100 | 77.3 | O, S | 1988 | 2005 | 25 736 | 4.50 | 4.24–4.76 | – | – |
| Vlahov et al. (2008)72 | USA | High | OR, SB | 2089 | 100 | 62.3 | O, S | 1997–1999 | 2002 | 8629.3 | 0.71 | 0.54–0.88 | – | – |
| Zabranksy et al. (2011)73 | Czech Republic | High | OR | 151 | 100 | 43 | O, S | 1996–1998 | 2008 | 1659.7 | 0.48 | 0.15–0.81 | 14.4 | 9.31–19.49 |
| Zaccarelli et al. (1994)74 | Italy | High | DTS | 2029 | 100 | 75.5 | – | 1985–1991 | 1991 | 7872.2 | 2.30 | 1.96–2.63 | 31.92 | 27.44–36.93 |
| Zhang et al. (2005)75 | China | Middle | DTS | 376 | 100 | 82.8 | O | 2002 | 2003 | 382.4 | 7.73 | 4.87–10.6 | 47.62 | 31.63–68.71 |
CI, confidence interval, CMR, crude mortality rate; DTS, drug treatment service; HC, health clinic; NSP, needle and syringe programme; O, opioids; OR, outreach; PR, HIV prevention service; PY, person–years; S, stimulants; SB, snowballing; SIF, supervised injecting facility; SMR, standardized mortality ratio; T&C, HIV testing and counselling; USA, United States of America.
a Not explicitly stated, but implied in the paper.
b The proportion of subjects who injected drugs was not reported but was assumed to be at least 70% because of the predominance of injecting as a route of administration among opioid-dependent people in this country.
c Subjects were followed for 5 years after the date of enrolment.
d Data on history of drug use was available for 62% of the subjects, and of these, 99% had a history of injecting drugs.
Note: Some CMRs and PYs of follow-up were calculated (formulae available from the corresponding author).
Fig. 2.
Crude mortality rates for people who inject drugs, by region
Image produced using Stata (StataCorp. LP, College Station, TX, United States of America).
CI, confidence interval; CMR, crude mortality rate.

SMRs were reported for 31 cohorts; their pooled SMR was 14.68 (Fig. 3). Since the heterogeneities (I2) of the pooled CMR and SMR were both very high (98.6% and 98.3%, respectively), we stratified estimates by subgroups.
Fig. 3.
Standardized mortality ratios for people who inject drugs, by region
Image produced using Stata (StataCorp. LP, College Station, TX, United States of America).
CI, confidence interval; SMR, standardized mortality ratio.

Sex differences in mortality
Thirty-seven studies presented CMRs by sex.14,17–19,21–24,26,28,30–32,34,36–38,43,45–50,52,54,57,58,62,66–72,74 The pooled CMR ratio for males versus females was 1.32 (Fig. 4), which suggests that crude mortality was higher among males. Nineteen studies reported SMRs by sex;14,17,21,24,26,28,30,32,34,38,43,46,52,54,58,66,67,70,74 the pooled CMR ratio suggests that females had significantly greater excess mortality than males in similar age groups in the general population (Fig. 5). Only two of the nineteen studies presented SMRs for males that were greater than those for females.30,74
Fig. 4.
Ratios of crude mortality rates in males versus females who inject drugs
Image produced using Stata (StataCorp. LP, College Station, TX, United States of America).
CI, confidence interval; RR, relative risk.

Fig. 5.
Ratios of standardized mortality ratios for males versus females who inject drugs
Image produced using Stata (StataCorp. LP, College Station, TX, United States of America).
CI, confidence interval; RR, relative risk.

Causes of death
Several studies reported specific causes of death. The pooled CMR for death from drug overdose was 0.62 per 100 PY across 43 studies (Fig. 6). Eleven studies reported CMRs for death from drug overdose by sex: overall the CMR was 1.38 times higher (Fig. 7) among males than among females.14,17,19,21,24,32,38,49,52,57,58
Fig. 6.
Crude mortality rates for death from drug overdose in people who inject drugs
Image produced using Stata (StataCorp. LP, College Station, TX, United States of America).
CI, confidence interval; CMR, crude mortality rate.

Fig. 7.
Ratios of crude mortality rates for death from drug overdose in males versus females who inject drugs
Image produced using Stata (StataCorp. LP, College Station, TX, United States of America).
CI, confidence interval, RR, relative risk.

In 20 studies CMRs were provided separately for people who inject drugs according to their HIV status.15,16,18,28,34,36–40,45,48,49,55,57,60,65,70,72,74 All-cause mortality was three times higher among HIV+ than among HIV− subjects (CMR ratio: 3.15) (Fig. 8). Much of this elevated mortality appeared to result from AIDS deaths among HIV+ users of injecting drugs. The pooled estimate of AIDS-related mortality for the 16 studies for which data were available was 2.55 per 100 PY (Fig. 9).28,33–36,38–41,48,49,60,65,70,72,74 When we examined mortality from causes other than AIDS, we found it to be 1.63 times higher among HIV+ than among HIV− people who inject drugs (Fig. 10).28,34,36,38–40,48,49,60,65,70,72,74
Fig. 8.
Ratios of crude mortality rates in HIV-positive versus HIV-negative people who inject drugs
Image produced using Stata (StataCorp. LP, College Station, TX, United States of America).
CI, confidence interval; HIV, human immunodeficiency virus; RR, relative risk.

Fig. 9.
Crude mortality rates for AIDS-related deaths in people injecting drugs who were HIV-positive at baseline
Image produced using Stata (StataCorp. LP, College Station, TX, United States of America).
AIDS, acquired immunodeficiency syndrome; CI, confidence interval; CMR, crude mortality rate; HIV, human immunodeficiency virus.

Fig. 10.
Ratios of crude mortality rates for non-AIDS-related deaths in HIV-positive versus HIV-negative people who inject drugs
Image produced using Stata (StataCorp. LP, College Station, TX, United States of America).
AIDS, acquired immunodeficiency syndrome; CI, confidence interval; HIV, human immunodeficiency virus; RR, relative risk.

Mortality from drug overdose was presented by HIV status in 9 studies.28,34,36,38,39,49,65,70,74 Pooled estimates showed mortality to be twice as high among HIV+ than among HIV− people who inject drugs (CMR ratio: 1.99) (Fig. 11). Further analyses across 13 studies conducted on HIV+ people who inject drugs showed no significant difference in deaths from drug overdose and from AIDS in this group (CMR ratio: 1.35; P = 0.554) (Fig. 12).28,33–36,38,39,41,49,65,70,71,74
Fig. 11.
Ratios of crude mortality rates for death from drug overdose in HIV-positive versus HIV-negative people who inject drugs
Image produced using Stata (StataCorp. LP, College Station, TX, United States of America).
CI, confidence interval; HIV, human immunodeficiency virus; RR, relative risk.

Fig. 12.
Ratios of crude mortality rates for AIDS-related death versus death from drug overdose in HIV-positive people who inject drugs
Image produced using Stata (StataCorp. LP, College Station, TX, United States of America).
AIDS, acquired immunodeficiency syndrome; CI, confidence interval; HIV, human immunodeficiency virus; RR, relative risk.

Only four studies presented data by sex and HIV status.37,47,49,74 They showed no significant difference in CMRs between HIV+ males and HIV+ females who inject drugs (CMR ratio: 1.13; Fig. 13), but HIV– males had a pooled CMR 1.81 times greater than that of HIV– females who inject drugs (Fig. 14).
Fig. 13.
Ratios of crude mortality rates in HIV-positive males versus HIV-positive females who inject drugs
Image produced using Stata (StataCorp. LP, College Station, TX, United States of America).
CI, confidence interval; HIV, human immunodeficiency virus; RR, relative risk.

Fig. 14.
Ratios of crude mortality rates in HIV-negative males versus HIV-negative females who inject drugs
Image produced using Stata (StataCorp. LP, College Station, TX, United States of America).
CI, confidence interval; HIV, human immunodeficiency virus; RR, relative risk.

Mortality by primary drug injected at baseline
Five studies estimated mortality by primary drug injected (opioids versus stimulants) (Table 2). Pooled estimates of all-cause mortality by primary type of drug injected showed no overall difference across studies (CMR ratio: 1.25; 95% CI: 0.60–2.61; P = 0.553).36,46,57,70,71 The same was true of studies of mortality resulting from drug overdose (CMR ratio: 1.85; 95% CI: 0.75–4.56; P = 0.18). In three of the four studies mortality associated with drug overdose was higher among people injecting opioids than among those injecting stimulants.36,46,71 In the fourth study, people who injected primarily stimulants had higher rates of drug overdose; however, the deaths from overdose in this group were later shown to have been caused by opioid use.57
Table 2. Comparison of risk of dying from all causes and from drug overdose among people injecting opioids and those injecting stimulants .
| Study | Users of opioids |
Users of stimulants |
All-cause CMR ratio |
Overdose CMR ratio |
Opioid use definition | Stimulant use definition | |||||||||||||
|---|---|---|---|---|---|---|---|---|---|---|---|---|---|---|---|---|---|---|---|
| PY | All-cause deaths (No.) | All-cause CMRa | Deaths from OD (No.) | OD CMRa | PY | All-cause deaths (No.) | All-cause CMRa | Deaths from OD (No.) | OD CMRa | Ratiob | 95% CI | Ratiob | 95% CI | ||||||
| Fugelstad et al. (1997)36 | 3022.7 | 133 | 4.40 | 72 | 1.67 | 3938 | 39 | 0.99 | 15 | 0.38 | 4.44 | 3.12–6.33 | 4.39 | 3.46–5.53 | Hospital records – at least once had a diagnosis of heroin dependence –opioid user | Hospital records – if had no heroin dependence diagnosis and at least once had a diagnosis of ATS dependence | |||
| Lejckova et al. (2007)46 | 13 323.9 | 114 | 0.86 | 36 | 0.27 | 9748.4 | 48 | 0.49 | 8 | 0.08 | 1.74 | 1.24–2.44 | 3.29 | 2.35–4.61 | ICD-10 code F11 opioid dependence | ICD-10 code F15 – stimulant dependence | |||
| O’Driscoll et al. (2001)57 | 2984.9 | 40 | 1.34 | 19 | 0.64 | 544.6 | 14 | 2.57 | 7 | 1.29 | 0.52 | 0.29–0.95 | 0.50 | 0.20–1.24 | Primary drug – heroin | Primary drug – cocaine or speed | |||
| van Haastrecht et al. (1996)70 | 268 | 9 | 3.36 | – | – | 326 | 15 | 4.60 | – | – | 0.73 | 0.33–1.64 | – | – | Main drug injected – heroin | Main drug injected – cocaine or ATS | |||
| Vlahov et al. (2005)71 | 2047 | 85 | 4.15 | 16 | 0.78 | 3727 | 175 | 4.70 | 20 | 0.54 | 0.88 | 0.69–1.14 | 1.44 | 1.12–1.86 | Heroin | Any cocaine or crack | |||
| Pooled estimate | – | – | – | – | – | – | – | – | – | – | 1.25c | 0.60–2.61 | 1.85d | 0.75–4.56 | – | – | |||
CI, confidence interval; CMR, crude mortality rate; ICD-10, International Classification of Diseases; OD, overdose; PY, person–years; S, stimulant.
a Deaths per 100 PY of follow-up.
b Represents the CMR ratio for people injecting opioids (numerator) versus people injecting stimulants (denominator).
c Meta-analysis of all-cause CMR ratio: Test of estimate = 1; P = 0.553; heterogeneity (χ2) = 67.99; P < 0.0005; I2 = 94.1%.
d Meta-analysis of overdose CMR ratio: Test of estimate = 1: P = 0.18; heterogeneity (χ2) = 20.10; P < 0.0005; I2 = 85.1%.
Note: Values reported in papers appear in plain text; italicized values were derived from other available data.
Mortality according to treatment
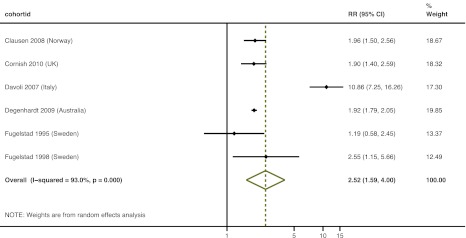
Six studies provided information on mortality during in-treatment and off-treatment periods at follow-up: the meta-analysis suggested that mortality was 2.52 times higher during off-treatment periods than during in-treatment periods (Fig. 15).22,23,25,26,35,37
Fig. 15.
Ratios of crude mortality rates in people who inject drugs during in-treatment period versus off-treatment period
Image produced using Stata (StataCorp. LP, College Station, TX, United States of America).
CI, confidence interval; RR, relative risk.
Heterogeneity in mortality
We performed univariate analyses to determine if the heterogeneity in overall CMRs and SMRs could be explained by participant characteristics and methodological variables. The results showed that high-income countries had lower CMRs than low- and middle-income countries (Fig. 16). Cohorts with greater proportions of males and HIV+ participants at baseline also had higher CMRs. Cohorts whose follow-up periods ended in more recent years had lower SMRs (Table 3). Study data were not sufficient to allow for multivariate analyses.
Fig. 16.
Crude mortality rates for people who inject drugs, by country income group
Image produced using Stata (StataCorp. LP, College Station, TX, United States of America).
CI, confidence interval; CMR, crude mortality rate.

Table 3. Univariate associations between study-level variables and all-cause crude mortality rates (CMRs) and standardized mortality ratios (SMRs).
| Characteristic | CMR |
SMR |
|||||
|---|---|---|---|---|---|---|---|
| n | t | P | n | t | P | ||
| Geographic region | 53 | −1.05 | 0.298 | 23 | 0.74 | 0.466 | |
| Country income | 67 | 3.03 | 0.004 | 33 | 0.65 | 0.519 | |
| Percentage of cohort who inject drugs | 60 | 1.49 | 0.141 | 26 | 2.04 | 0.052 | |
| Percentage of males | 57 | 3.40 | 0.001 | 31 | 0.29 | 0.771 | |
| Percentage of cohort HIV+ at baseline | 30 | 2.42 | 0.022 | 9 | 1.00 | 0.349 | |
| Presence of people using opioids (alone or with other drugs) in cohort | 67 | −0.07 | 0.945 | 33 | −1.28 | 0.209 | |
| Year in which follow-up ceased | 59 | 0.26 | 0.795 | 32 | −2.80 | 0.009 | |
Discussion
Although previous reviews have examined mortality among people who inject drugs, to our knowledge this is the most comprehensive systematic review of the topic and the first to employ novel approaches to search for the available evidence. These approaches ranged from standard searches of the peer-reviewed literature to comprehensive searches of the non-peer reviewed literature and multiple expert consultations, as well as examination of both participant- and study-level factors potentially associated with the risk of death.
The pooled CMR of 2.35 deaths per 100 PY provides evidence of the high mortality associated with injecting drug use. The pooled SMR of 14.68 also shows that mortality is much higher in those who inject drugs than in the general population. Differences by sex were evident: across all studies that reported mortality by sex, males had higher CMRs, yet females who inject drugs had a much higher elevation in mortality relative to their age-matched peers in the general population than did males who inject drugs.
Most of the cohorts identified were from 14 high-income countries; together these 14 counties represent 78% of the total estimated population of people who inject drugs in such countries.76 Studies from only 11 low or middle income countries were identified; these countries account for only 40% of the estimated number of people injecting drugs in low- or middle-income countries.76
Although pooled CMRs were higher among people injecting drugs in low- and middle-income countries rather than high-income countries, we observed no significant difference in pooled SMRs. This suggests that the higher CMRs may reflect higher overall mortality in the general population in low- and middle-income countries than in high-income countries. The lowest and highest mortality rates were documented in cohorts in Australasia and Asia, respectively. Differences across high-income countries probably reflect differences in HIV infection prevalence, coverage of HIV prevention and coverage of opioid agonist maintenance treatment.76,77
Drug overdose and AIDS-related mortality were by far the most common causes of death. The pooled CMR for death from drug overdose was 0.62 per 100 PY, higher among males than females who inject drugs, and higher among HIV+ people who inject drugs than among those who were HIV−. In three of the four studies comparing drug overdose among people injecting opioids compared to those injecting stimulants, CMRs were higher among the former group, as expected.36,46,71 In a fourth study, however, drug overdose was higher among people who injected stimulants,57 although further investigation revealed that the deaths from overdose in this group were more often linked to the injection of opioids than to the injection of stimulants. This finding highlights the fact that people who inject drugs often use more than one drug type, even if they have a particular drug of choice.
The prevalence of HIV infection varied widely. As expected, overall mortality was much higher among HIV+ than among HIV− people who inject drugs (pooled CMR ratio: 3.15), but mortality from causes other than AIDS was also higher among those who were HIV+. Overdose-related mortality was also higher among HIV+ people who inject drugs in many cohorts. These differences in mortality may reflect differences in risky behaviour, physical health and social disadvantage.
The observational evidence examined in this review is consistent with the evidence from randomized controlled trials that opioid agonist maintenance treatment is associated with a reduced risk of death.78 Among cohorts for which in-treatment and off-treatment periods were carefully tracked, mortality rates were around 2.5 times higher in off-treatment periods than in in-treatment periods. Variation in exposure to treatment could also explain differences between cohorts in mortality from drug overdose, although this variation was not explicitly measured across cohorts.
The prevention of HIV transmission among people who inject drugs is clearly a public health priority.79,80 There is growing evidence that opioid agonist maintenance treatment, antiretroviral treatment and needle and syringe programmes reduce HIV transmission.81–83 These interventions have been implemented in many countries, but often on a limited scale only.77 Clearly, however, AIDS is only one of several common causes of death in this group: a comprehensive approach to improving health outcomes among people who inject drugs must also include efforts to reduce other causes of death frequently found among them, particularly drug overdose.84
Limitations of the evidence
Evidence on mortality rates among users of injecting drugs is still predominantly from high-income countries, particularly in western Europe. Interestingly, however, this review has shown that despite marked differences in CMRs across countries, the extent to which this mortality exceeds that of the general population may show less pronounced differences. It would be inappropriate to assume that mortality is equally high among all people who inject drugs. New research in this area is needed, especially in countries where drug injecting is taking place but little research has been conducted about it.
In this review we found no significant differences in the risk of death by type of primary drug injected. This contrasts with the findings of other reviews of people dependent on different drug types, which, despite their own limitations, have suggested differences in mortality among opioid-, amphetamine- and cocaine-dependent persons.3–5 An explanation for this discrepancy might lie in the extent of drug injection among the groups examined, whether people used multiple drugs (polydrug use being the norm), or the possibility, seldom examined, that some people in the cohorts switched from one primary drug to another during the follow-up period. All of these factors would have reduced our capacity to detect any differences in mortality among people injecting different types of drugs.
The ability to detect differences in mortality in cohort studies according to HIV status is subject to limitations. HIV status was typically measured at baseline only, and some subjects who contracted HIV infection during follow-up would remain assigned to the HIV− group for the entire follow-up period. Nonetheless, this would only serve to underestimate the relative differences in mortality between HIV+ and HIV− people who inject drugs. The markedly higher all-cause mortality that we observed among HIV+ people who inject drugs is therefore probably a conservative estimate of the elevation in mortality in that group. Misattribution of cause of death as either AIDS- or non-AIDS-related could have occurred as well.
Treatment for HIV infection has improved greatly and has become more widely available. In some cohorts, mortality was examined for the periods before and after highly active antiretroviral therapy (HAART) was introduced. The findings suggest that mortality among HIV+ people who inject drugs decreased after the widespread introduction of HAART.55 Unfortunately, we were unable to examine the impact of treatment for HIV infection across studies because mortality was rarely reported separately for the periods before and after the introduction of HAART.77 However, the observed association between cohorts with more recent follow-up periods and lower SMRs might have to do with the greater availability in recent years of effective interventions for the prevention and treatment of HIV infection.
Reporting quality was poor. Few studies met criteria in consensus statements for the reporting of observational studies.7 Mortality estimates were reported in various forms, including odds ratios, relative risks, hazard ratios and CMRs. Most studies did not report SMRs and many failed to report standard parameters such as PY, or were seldom easy to calculate, particularly for disaggregated mortality estimates. As a result, only a subset of studies could be included in many of the analyses.
Causes of death were not uniformly or consistently coded. Deaths from drug overdose might have been missed in countries with limited capacity to conduct toxicological tests or where recording a death as being from a drug overdose is surrounded by stigma. As a result, we may have underestimated CMRs and SMRs for death from drug overdose. Misattribution of deaths by HIV status may have occurred, since most cohorts were assessed for HIV status at the beginning of the study only and people infected during follow-up could have been missed. Again, this may have resulted in conservative estimates of mortality among HIV+ people who inject drugs and in lower effect sizes. In future research, assessing individuals’ HIV status at several time points during the follow-up period would allow a more accurate measurement of mortality in relation to HIV status.
Limitations of the review and meta-analysis
Our review has limitations. The lag time between the date when the studies were conducted and when they were published in peer-reviewed journals was generally long. In light of this we used several methods to search for published and unpublished studies. We reviewed primarily English-language papers, although we also reviewed the abstracts of non-English-language peer-reviewed articles when they were available in English. When studies seemed relevant, we had them translated; we engaged experts from a range of different countries and language groups to review these reference lists. Meta-analytical methods were originally developed to aggregate the findings of randomized controlled trials,85 which have the advantage of allowing for control or adjustment of pre-conditions and sample-related factors that could influence the outcomes of interest. Controlling for such factors is not possible in observational studies, like the ones included in our review.
Conclusion
People who inject drugs have a much higher risk of death than those who do not. Major causes of death in this group are often poorly specified, but death from drug overdose is common, as is AIDS-related mortality in settings with a high prevalence of HIV infection. HIV+ people who inject drugs have higher mortality not just from HIV-related causes but also from drug overdose. Mortality varies by participant- and study-level characteristics, which suggests that multiple factors contribute to the higher risk of death observed in people who inject drugs. Many of these factors are probably modifiable, since certain predominant causes of death account for most of the mortality observed in this group.
Competing interests:
None declared.
References
- 1.Darke S, Degenhardt L, Mattick RP, editors. Mortality amongst illicit drug users Cambridge: Cambridge University Press; 2006. [Google Scholar]
- 2.Degenhardt L, Hall W, Warner-Smith M. Using cohort studies to estimate mortality among injecting drug users that is not attributable to AIDS. Sex Transm Infect. 2006;82:iii56–63. doi: 10.1136/sti.2005.019273. [DOI] [PMC free article] [PubMed] [Google Scholar]
- 3.Degenhardt L, Singleton J, Calabria B, McLaren J, Kerr T, Mehta S, et al. Mortality among cocaine users: a systematic review of cohort studies. Drug Alcohol Depend. 2011;113:88–95. doi: 10.1016/j.drugalcdep.2010.07.026. [DOI] [PubMed] [Google Scholar]
- 4.Singleton J, Degenhardt L, Hall W, Zabransky T. Mortality among amphetamine users: a systematic review of cohort studies. Drug Alcohol Depend. 2009;105:1–8. doi: 10.1016/j.drugalcdep.2009.05.028. [DOI] [PubMed] [Google Scholar]
- 5.Degenhardt L, McLaren J, Ali H, Briegleb C; Global Burden of Disease Mental Disorders and Illicit Drug Use Expert Group. Methods used in a systematic review of mortality among dependent users of heroin and other opioids Sydney: National Drug and Alcohol Research Centre, University of New South Wales; 2008 (Illicit drugs discussion paper No. 9).
- 6.Calabria B, Phillips B, Singleton J, Mathers BM, Congreve E, Degenhardt L, et al. Searching the grey literature to access information on drug and alcohol research: A resource to identify drug related databases and websites Sydney: National Drug and Alcohol Research Centre, University of New South Wales; 2008. [Google Scholar]
- 7.Vandenbroucke JP, von Elm E, Altman DG, Gøtzsche PC, Mulrow CD, Pocock SJ, et al. STROBE Initiative. Strengthening the reporting of observational studies in epidemiology (STROBE): explanation and elaboration. Epidemiology. 2007;18:805–35. doi: 10.1097/EDE.0b013e3181577511. [DOI] [PubMed] [Google Scholar]
- 8.Wilcox HC, Conner KR, Caine ED. Association of alcohol and drug use disorders and completed suicide: an empirical review of cohort studies. Drug Alcohol Depend. 2004;76(Suppl):S11–9. doi: 10.1016/j.drugalcdep.2004.08.003. [DOI] [PubMed] [Google Scholar]
- 9.DerSimonian R, Laird N. Meta-analysis in clinical trials. Control Clin Trials. 1986;7:177–88. doi: 10.1016/0197-2456(86)90046-2. [DOI] [PubMed] [Google Scholar]
- 10.Sharp S, Sterne J. Meta-analysis. Stata Tech Bull. 1997;38:9–14. [Google Scholar]
- 11.Higgins JPT, Thompson SG, Deeks JJ, Altman DG. Measuring inconsistency in meta-analyses. BMJ. 2003;327:557–60. doi: 10.1136/bmj.327.7414.557. [DOI] [PMC free article] [PubMed] [Google Scholar]
- 12.Sharp S, Sterne J. Meta-analysis regression. Stata Tech Bull. 1998;42:16–24. [Google Scholar]
- 13.Thompson SG, Sharp SJ. Explaining heterogeneity in meta-analysis: a comparison of methods. Stat Med. 1999;18:2693–708. doi: 10.1002/(SICI)1097-0258(19991030)18:20<2693::AID-SIM235>3.0.CO;2-V. [DOI] [PubMed] [Google Scholar]
- 14.Antolini G, Pirani M, Morandi G, Sorio C. Differenze di genere e mortalità in una coorte di eroinomani nelle province emiliane di Modena e Ferrara [Gender difference and mortality in a cohort of heroin users in the Provinces of Modena and Ferrara, 1975–1999]. Epidemiol Prev. 2006;30:91–9. [PubMed] [Google Scholar]
- 15.Azim T, Chowdhury EI, Reza M, Faruque MO, Ahmed G, Khan R, et al. Prevalence of infections, HIV risk behaviors and factors associated with HIV infection among male injecting drug users attending a needle/syringe exchange program in Dhaka, Bangladesh. Subst Use Misuse. 2008;43:2124–44. doi: 10.1080/10826080802344583. [DOI] [PubMed] [Google Scholar]
- 16.Azim T, Khan SI, Nahar Q, Reza M, Alam N, Saifi R, et al. 20 years of HIV in Bangladesh: experiences and way forward Washington: World Bank; 2009. [Google Scholar]
- 17.Bargagli AM, Sperati A, Davoli M, Forastiere F, Perucci CA. Mortality among problem drug users in Rome: an 18-year follow-up study, 1980–97. Addiction. 2001;96:1455–63. doi: 10.1046/j.1360-0443.2001.961014559.x. [DOI] [PubMed] [Google Scholar]
- 18.Bauer SM, Loipl R, Jagsch R, Gruber D, Risser D, Thau K, et al. Mortality in opioid-maintained patients after release from an addiction clinic. Eur Addict Res. 2008;14:82–91. doi: 10.1159/000113722. [DOI] [PubMed] [Google Scholar]
- 19.Brancato V, Delvecchio G, Simone P. Sopravvivenza e mortalità in una coorte di tossicodipendenti da eroina nel periodo 1985–1994 [Survival and mortality in a cohort of heroin addicts in 1985–1994]. Minerva Med. 1995;86:97–9. [PubMed] [Google Scholar]
- 20.Cardoso MN, Caiaffa WT, Mingoti SA. Projeto AjUDE-Brasil II. AIDS incidence and mortality in injecting drug users: the AjUDE-Brasil II Project. Cad Saude Publica. 2006;22:827–37. doi: 10.1590/S0102-311X2006000400021. [DOI] [PubMed] [Google Scholar]
- 21.Ciccolallo L, Morandi G, Pavarin R, Sorio C, Buiatti E. La mortalità dei tossicodipendenti nella Regione Emilia Romagna e i suoi determinanti. Risultati di uno studio longitudinale [Mortality risk in intravenous drug users in Emilia Romagna region and its socio-demographic determinants. Results of a longitudinal study]. Epidemiol Prev. 2000;24:75–80. [PubMed] [Google Scholar]
- 22.Clausen T, Anchersen K, Waal H. Mortality prior to, during and after opioid maintenance treatment (OMT): a national prospective cross-registry study. Drug Alcohol Depend. 2008;94:151–7. doi: 10.1016/j.drugalcdep.2007.11.003. [DOI] [PubMed] [Google Scholar]
- 23.Cornish R, Macleod J, Strang J, Vickerman P, Hickman M. Risk of death during and after opiate substitution treatment in primary care: prospective observational study in UK General Practice Research Database. BMJ. 2010;341:c5475. doi: 10.1136/bmj.c5475. [DOI] [PMC free article] [PubMed] [Google Scholar]
- 24.Copeland L, Budd J, Robertson JR, Elton RA. Changing patterns in causes of death in a cohort of injecting drug users, 1980–2001. Arch Intern Med. 2004;164:1214–20. doi: 10.1001/archinte.164.11.1214. [DOI] [PubMed] [Google Scholar]
- 25.Davoli M, Bargagli AM, Perucci CA, Schifano P, Belleudi V, Hickman M, et al. VEdeTTE Study Group. Risk of fatal overdose during and after specialist drug treatment: the VEdeTTE study, a national multi-site prospective cohort study. Addiction. 2007;102:1954–9. doi: 10.1111/j.1360-0443.2007.02025.x. [DOI] [PubMed] [Google Scholar]
- 26.Degenhardt L, Randall D, Hall W, Law M, Butler T, Burns L. Mortality among clients of a state-wide opioid pharmacotherapy program over 20 years: risk factors and lives saved. Drug Alcohol Depend. 2009;105:9–15. doi: 10.1016/j.drugalcdep.2009.05.021. [DOI] [PubMed] [Google Scholar]
- 27.DiGiusto E, Shakeshaft A, Ritter A, O’Brien S, Mattick RP, NEPOD Research Group Serious adverse events in the Australian National Evaluation of Pharmacotherapies for Opioid Dependence (NEPOD). Addiction. 2004;99:450–60. doi: 10.1111/j.1360-0443.2004.00654.x. [DOI] [PubMed] [Google Scholar]
- 28.Eskild A, Magnus P, Samuelsen SO, Sohlberg C, Kittelsen P. Differences in mortality rates and causes of death between HIV positive and HIV negative intravenous drug users. Int J Epidemiol. 1993;22:315–20. doi: 10.1093/ije/22.2.315. [DOI] [PubMed] [Google Scholar]
- 29.Esteban J, Gimeno C, Barril J, Aragonés A, Climent JM, de la Cruz Pellín M. Survival study of opioid addicts in relation to its adherence to methadone maintenance treatment. Drug Alcohol Depend. 2003;70:193–200. doi: 10.1016/S0376-8716(03)00002-4. [DOI] [PubMed] [Google Scholar]
- 30.European Monitoring Centre on Drugs and Drug Addiction. Mortality related to drug use in Europe: public health implications Lisbon: EMCDDA; 2011. [Google Scholar]
- 31.Evans JL, Tsui JI, Hahn JA, Davidson PJ, Lum PJ, Page K. Mortality among young injection drug users in San Francisco: a 10-year follow-up of the UFO study. Am J Epidemiol. 2012;175:302–8. doi: 10.1093/aje/kwr318. [DOI] [PMC free article] [PubMed] [Google Scholar]
- 32.Ferri M, Bargagli AM, Faggiano F, Belleudi V, Salamina G, Vigna-Taglianti F, et al. Gruppo di studio VEdeTTE. Mortalità in una coorte di tossicodipendenti da eroina arruolati presso i Ser.T in Italia, 1998–2001 [Mortality of drug users attending public treatment centers in Italy 1998–2001: a cohort study]. Epidemiol Prev. 2007;31:276–82. [PubMed] [Google Scholar]
- 33.Fingerhood M, Rastegar DA, Jasinski D. Five year outcomes of a cohort of HIV-infected injection drug users in a primary care practice. J Addict Dis. 2006;25:33–8. doi: 10.1300/J069v25n02_05. [DOI] [PubMed] [Google Scholar]
- 34.Frischer M, Goldberg D, Rahman M, Berney L. Mortality and survival among a cohort of drug injectors in Glasgow, 1982–1994. Addiction. 1997;92:419–27. doi: 10.1111/j.1360-0443.1997.tb03373.x. [DOI] [PubMed] [Google Scholar]
- 35.Fugelstad A, Rajs J, Böttiger M, Gerhardsson de Verdier M. Mortality among HIV-infected intravenous drug addicts in Stockholm in relation to methadone treatment. Addiction. 1995;90:711–6. doi: 10.1111/j.1360-0443.1995.tb02209.x. [DOI] [PubMed] [Google Scholar]
- 36.Fugelstad A, Annell A, Rajs J, Agren G. Mortality and causes and manner of death among drug addicts in Stockholm during the period 1981–1992. Acta Psychiatr Scand. 1997;96:169–75. doi: 10.1111/j.1600-0447.1997.tb10147.x. [DOI] [PubMed] [Google Scholar]
- 37.Fugelstad A, Agren G, Romelsjö A. Changes in mortality, arrests, and hospitalizations in nonvoluntarily treated heroin addicts in relation to methadone treatment. Subst Use Misuse. 1998;33:2803–17. doi: 10.3109/10826089809059352. [DOI] [PubMed] [Google Scholar]
- 38.Galli M, Musicco M, COMCAT Study Group Mortality of intravenous drug users living in Milan, Italy: role of HIV-1 infection. AIDS. 1994;8:1457–63. doi: 10.1097/00002030-199410000-00013. [DOI] [PubMed] [Google Scholar]
- 39.Goedert JJ, Pizza G, Gritti FM, Costigliola P, Boschini A, Bini A, et al. Mortality among drug users in the AIDS era. Int J Epidemiol. 1995;24:1204–10. doi: 10.1093/ije/24.6.1204. [DOI] [PubMed] [Google Scholar]
- 40.Goedert JJ, Fung MW, Felton S, Battjes RJ, Engels EA. Cause-specific mortality associated with HIV and HTLV-II infections among injecting drug users in the USA. AIDS. 2001;15:1295–302. doi: 10.1097/00002030-200107060-00012. [DOI] [PubMed] [Google Scholar]
- 41.Golz J, Moll A, Nzimegne S, Klausen G, Schleehauf D. Comparison of antiretroviral therapy in IVDU and MSM – a retrospective study 1996-2000. Suchtmedizin in Forschung und Praxis. 2001;3:25–33. [Google Scholar]
- 42.Haarr D, Nessa J. Opioidbehandling av rusmiddelavhengige i en allmennpraksis [Treatment of opiate-dependent patients in a general practice]. Tidsskr Nor Laegeforen. 2007;127:1770–2. [PubMed] [Google Scholar]
- 43.Hickman M, Carnwath Z, Madden P, Farrell M, Rooney C, Ashcroft R, et al. Drug-related mortality and fatal overdose risk: pilot cohort study of heroin users recruited from specialist drug treatment sites in London. J Urban Health. 2003;80:274–87. doi: 10.1093/jurban/jtg030. [DOI] [PMC free article] [PubMed] [Google Scholar]
- 44.Jafari S, Rahimi-Movahgar A, Craib K, Baharlou S, Mathias R. A follow-up study of drug users in Southern Iran. Addict Res Theory. 2010;18:59–70. doi: 10.3109/16066350902825930. [DOI] [Google Scholar]
- 45.Jarrin I, Lumbreras B, Ferreros I, Pérez-Hoyos S, Hurtado I, Hernández-Aguado I. Effect of education on overall and cause-specific mortality in injecting drug users, according to HIV and introduction of HAART. Int J Epidemiol. 2007;36:187–94. doi: 10.1093/ije/dyl231. [DOI] [PubMed] [Google Scholar]
- 46.Lejckova P, Mravcik V. Mortality of hospitalized drug users in the Czech Republic. J Drug Issues. 2007;37:103–18. doi: 10.1177/002204260703700105. [DOI] [Google Scholar]
- 47.Liu EW, Wang SJ, Liu Y, Liu W, Chen ZS, Li XY, et al. Mortality of HIV infected clients treated with methadone maintenance treatment in Yili Kazakh autonomous prefecture. Zhonghua Yu Fang Yi Xue Za Zhi 201145979–84.InChinese [PubMed] [Google Scholar]
- 48.Lumbreras B, Jarrín I, del Amo J, Pérez-Hoyos S, Muga R, García-de la Hera M, et al. Impact of hepatitis C infection on long-term mortality of injecting drug users from 1990 to 2002: differences before and after HAART. AIDS. 2006;20:111–6. doi: 10.1097/01.aids.0000196164.71388.3b. [DOI] [PubMed] [Google Scholar]
- 49.Manfredi R, Sabbatani S, Agostini D. Trend of mortality observed in a cohort of drug addicts of the metropolitan area of Bologna, North-Eastern Italy, during a 25-year-period. Coll Antropol. 2006;30:479–88. [PubMed] [Google Scholar]
- 50.McAnulty JM, Tesselaar H, Fleming DW. Mortality among injection drug users identified as “out of treatment”. Am J Public Health. 1995;85:119–20. doi: 10.2105/AJPH.85.1.119. [DOI] [PMC free article] [PubMed] [Google Scholar]
- 51.Mezzelani P, Quaglio GL, Venturini L, Lugoboni F, Friedman SR, Des Jarlais DC. A multicentre study on the causes of death among Italian injecting drug users. AIDS has overtaken overdose as the principal cause of death. AIDS Care. 1998;10:61–7. doi: 10.1080/713612356. [DOI] [PubMed] [Google Scholar]
- 52.Miller CL, Kerr T, Strathdee SA, Li K, Wood E. Factors associated with premature mortality among young injection drug users in Vancouver. Harm Reduct J. 2007;4:1. doi: 10.1186/1477-7517-4-1. [DOI] [PMC free article] [PubMed] [Google Scholar]
- 53.Moroni M, Galli M. Causes of death in a cohort of intravenous-drug-users (IVDUs) recruited in Milan. AIDS Res Hum Retroviruses. 1991;7:241–2. [Google Scholar]
- 54.Moskalewicz J, Sierosławski J.Umieralność osób uzaleznionych od narkotyków przyjmowanych w iniekcjach [Mortality of narcotic addicts using injections]. Przegl Epidemiol 199650323–32.InPolish [PubMed] [Google Scholar]
- 55.Muga R, Langohr K, Tor J, Sanvisens A, Serra I, Rey-Joly C, et al. Survival of HIV-infected injection drug users (IDUs) in the highly active antiretroviral therapy era, relative to sex- and age-specific survival of HIV-uninfected IDUs. Clin Infect Dis. 2007;45:370–6. doi: 10.1086/519385. [DOI] [PubMed] [Google Scholar]
- 56.Nyhlén A, Fridell M, Bäckström M, Hesse M, Krantz P. Substance abuse and psychiatric co-morbidity as predictors of premature mortality in Swedish drug abusers: a prospective longitudinal study 1970–2006. BMC Psychiatry. 2011;11:122–31. doi: 10.1186/1471-244X-11-122. [DOI] [PMC free article] [PubMed] [Google Scholar]
- 57.O’Driscoll PT, McGough J, Hagan H, Thiede H, Critchlow C, Alexander ER. Predictors of accidental fatal drug overdose among a cohort of injection drug users. Am J Public Health. 2001;91:984–7. doi: 10.2105/AJPH.91.6.984. [DOI] [PMC free article] [PubMed] [Google Scholar]
- 58.Oppenheimer E, Tobutt C, Taylor C, Andrew T. Death and survival in a cohort of heroin addicts from London clinics: a 22-year follow-up study. Addiction. 1994;89:1299–308. doi: 10.1111/j.1360-0443.1994.tb03309.x. [DOI] [PubMed] [Google Scholar]
- 59.Quan VM, Vongchak T, Jittiwutikarn J, Kawichai S, Srirak N, Wiboonnatakul K, et al. Predictors of mortality among injecting and non-injecting HIV-negative drug users in northern Thailand. Addiction. 2007;102:441–6. doi: 10.1111/j.1360-0443.2006.01709.x. [DOI] [PubMed] [Google Scholar]
- 60.Quan VM, Minh NL, Ha TV, Ngoc NP, Vu PT, Celentano DD, et al. Mortality and HIV transmission among male Vietnamese injection drug users. Addiction. 2011;106:583–9. doi: 10.1111/j.1360-0443.2010.03175.x. [DOI] [PMC free article] [PubMed] [Google Scholar]
- 61.Rahimi-Movahgar A, Khastoo G, Razzaghi EM, Saberi-Zafarghandi MB, Noroozi AR, Jar-Siah R. Compulsory methadone maintenance treatment of severe cases of drug addiction in a residential setting in Tehran, Iran: outcome evaluation in two and six-month follow-up. Payesh. 2011;10:503–12. [Google Scholar]
- 62.Reece AS. Favorable mortality profile of naltrexone implants for opiate addiction. J Addict Dis. 2010;29:30–50. doi: 10.1080/10550880903435988. [DOI] [PubMed] [Google Scholar]
- 63.Sánchez-Carbonell X, Seus L. Ten-year survival analysis of a cohort of heroin addicts in Catalonia: the EMETYST project. Addiction. 2000;95:941–8. doi: 10.1046/j.1360-0443.2000.95694110.x. [DOI] [PubMed] [Google Scholar]
- 64.Seaman SR, Brettle RP, Gore SM. Mortality from overdose among injecting drug users recently released from prison: database linkage study. BMJ. 1998;316:426–8. doi: 10.1136/bmj.316.7129.426. [DOI] [PMC free article] [PubMed] [Google Scholar]
- 65.Solomon SS, Celentano DD, Srikrishnan AK, Vasudevan CK, Anand S, Kumar MS, et al. Mortality among injection drug users in Chennai, India (2005–2008). AIDS. 2009;23:997–1004. doi: 10.1097/QAD.0b013e32832a594e. [DOI] [PMC free article] [PubMed] [Google Scholar]
- 66.Sørensen HJ, Jepsen PW, Haastrup S, Juel K. Drug-use pattern, comorbid psychosis and mortality in people with a history of opioid addiction. Acta Psychiatr Scand. 2005;111:244–9. doi: 10.1111/j.1600-0447.2004.00445.x. [DOI] [PubMed] [Google Scholar]
- 67.Stenbacka M, Leifman A, Romelsjo A. Mortality among opiate abusers in Stockholm: a longitudinal study. Heroin Addict Rel Clin Prob. 2007;9:41–9. [Google Scholar]
- 68.Stoové MA, Dietze PM, Aitken CK, Jolley D. Mortality among injecting drug users in Melbourne: a 16-year follow-up of the Victorian Injecting Cohort Study (VICS). Drug Alcohol Depend. 2008;96:281–5. doi: 10.1016/j.drugalcdep.2008.03.006. [DOI] [PubMed] [Google Scholar]
- 69.Tait RJN, Ngo HTT, Hulse GK. Mortality in heroin users 3 years after naltrexone implant or methadone maintenance treatment. J Subst Abuse Treat. 2008;35:116–24. doi: 10.1016/j.jsat.2007.08.014. [DOI] [PubMed] [Google Scholar]
- 70.van Haastrecht HJA, van Ameijden EJC, van den Hoek JAR, Mientjes GHC, Bax JS, Coutinho RA. Predictors of mortality in the Amsterdam cohort of human immunodeficiency virus (HIV)-positive and HIV-negative drug users. Am J Epidemiol. 1996;143:380–91. doi: 10.1093/oxfordjournals.aje.a008752. [DOI] [PubMed] [Google Scholar]
- 71.Vlahov D, Galai N, Safaeian M, Galea S, Kirk GD, Lucas GM, et al. Effectiveness of highly active antiretroviral therapy among injection drug users with late-stage human immunodeficiency virus infection. Am J Epidemiol. 2005;161:999–1012. doi: 10.1093/aje/kwi133. [DOI] [PMC free article] [PubMed] [Google Scholar]
- 72.Vlahov D, Wang C, Ompad D, Fuller CM, Caceres W, Ouellet L, et al. Collaborative Injection Drug User Study Mortality risk among recent-onset injection drug users in five US cities. Subst Use Misuse. 2008;43:413–28. doi: 10.1080/10826080701203013. [DOI] [PubMed] [Google Scholar]
- 73.Zábranský T, Csémy L, Grohmannová K, Janíková B, Brenza J. Mortality of cohort of very young injecting drug users in Prague, 1996–2010. Cent Eur J Public Health. 2011;19:152–7. doi: 10.21101/cejph.a3681. [DOI] [PubMed] [Google Scholar]
- 74.Zaccarelli M, Gattari P, Rezza G, Conti S, Spizzichino L, Vlahov D, et al. Impact of HIV infection on non-AIDS mortality among Italian injecting drug users. AIDS. 1994;8:345–50. doi: 10.1097/00002030-199403000-00008. [DOI] [PubMed] [Google Scholar]
- 75.Zhang L, Ruan YH, Jiang ZQ, Yang ZN, Liu SZ, Zhou F, et al. [A 1-year prospective cohort study on mortality of injecting drug users]. Zhonghua Liu Xing Bing Xue Za Zhi. 2005;26:190–3. [PubMed] [Google Scholar]
- 76.Mathers BM, Degenhardt L, Phillips B, Wiessing L, Hickman M, Strathdee SA. Reference Group to the UN on HIV and Injecting Drug Use. Global epidemiology of injecting drug use and HIV among people who inject drugs: a systematic review. Lancet. 2008;372:1733–45. doi: 10.1016/S0140-6736(08)61311-2. [DOI] [PubMed] [Google Scholar]
- 77.Mathers BM, Degenhardt L, Ali H, Wiessing L, Hickman M, Mattick R, et al. Reference Group to the UN on HIV and Injecting Drug Use. HIV prevention, treatment and care for people who inject drugs: A systematic review of global, regional and country level coverage. Lancet. 2010;375:1014–28. doi: 10.1016/S0140-6736(10)60232-2. [DOI] [PubMed] [Google Scholar]
- 78.Mattick RP, Breen C, Kimber J, Davoli M. Methadone maintenance versus no opioid replacement therapy for opioid dependence. Cochrane Database Syst Rev. 2009;3:CD002209. doi: 10.1002/14651858.CD002209.pub2. [DOI] [PMC free article] [PubMed] [Google Scholar]
- 79.Declaration of Commitment on HIV/AIDS – United Nations special session on HIV/AIDS In: Twenty-sixth special session of the General Assembly of the United Nations. 25-27 June 2001. New York, United States of America; 2001.
- 80.Mathers BM, Degenhardt L, Phillips B, Wiessing L, Hickman M, Strathdee SA, et al. Reference Group to the UN on HIV and Injecting Drug Use. Global epidemiology of injecting drug use and HIV among people who inject drugs: a systematic review. Lancet. 2008;372:1733–45. doi: 10.1016/S0140-6736(08)61311-2. [DOI] [PubMed] [Google Scholar]
- 81.Palmateer N, Kimber J, Hickman M, Hutchinson S, Rhodes T, Goldberg D. Evidence for the effectiveness of sterile injecting equipment provision in preventing hepatitis C and HIV transmission among injecting drug users: a review of reviews. Addiction. 2010;105:844–59. doi: 10.1111/j.1360-0443.2009.02888.x. [DOI] [PubMed] [Google Scholar]
- 82.Tilson H, Aramrattana A, Bozzette S. Preventing HIV infection among injecting drug users in high-risk countries: an assessment of the evidence Washington: Institute of Medicine; 2007. [Google Scholar]
- 83.Degenhardt L, Mathers B, Vickerman P, Rhodes T, Latkin C, Hickman M. Prevention of HIV infection for people who inject drugs: Why individual, structural, and combination approaches are required. Lancet. 2010;376:285–301. doi: 10.1016/S0140-6736(10)60742-8. [DOI] [PubMed] [Google Scholar]
- 84.Baca CT, Grant KJ. Take-home naloxone to reduce heroin death. Addiction. 2005;100:1823–31. doi: 10.1111/j.1360-0443.2005.01259.x. [DOI] [PubMed] [Google Scholar]
- 85.Kulinskaya E, Morgenthaler S, Staudte R. Meta analysis: a guide to calibrating and combining statistical evidence. Wiley-Interscience; 2008. [Google Scholar]