Abstract
Formation of functionally adequate vascular networks by angiogenesis presents a problem in biological patterning. Generated without predetermined spatial patterns, networks must develop hierarchical tree-like structures for efficient convective transport over large distances, combined with dense space-filling meshes for short diffusion distances to every point in the tissue. Moreover, networks must be capable of restructuring in response to changing functional demands without interruption of blood flow. Here, theoretical simulations based on experimental data are used to demonstrate that this patterning problem can be solved through over-abundant stochastic generation of vessels in response to a growth factor generated in hypoxic tissue regions, in parallel with refinement by structural adaptation and pruning. Essential biological mechanisms for generation of adequate and efficient vascular patterns are identified and impairments in vascular properties resulting from defects in these mechanisms are predicted. The results provide a framework for understanding vascular network formation in normal or pathological conditions and for predicting effects of therapies targeting angiogenesis.
Author Summary
The blood vessels provide an efficient system for transport of substances to all parts of the body. They are capable of growing or regressing during development, in response to changing functional needs, and in disease states. This is achieved by structural adaptation, i.e. changes in the diameters and other characteristics of existing vessels, and by angiogenesis, i.e. growth of new blood vessels. Here, we address the question: How do the processes of structural adaptation and angiogenesis lead to the formation of organized vessel networks that can supply the changing needs of the tissue? We carried out theoretical simulations of network growth and adaptation, including vessel blood flows, oxygen transport to tissue, and the generation of a growth factor in low-oxygen regions, which stimulates angiogenesis by sprouting from existing vessels. We showed that the processes of over-abundant random angiogenesis together with structural adaptation including pruning of redundant vessels can generate adequate and efficient vessel networks that are capable of continuously adapting to changing tissue needs. Our work provides insight into the biological mechanisms that are essential for formation and maintenance of functional vessel networks, and may lead to new strategies for controlling blood vessel formation in diseases.
Introduction
Vascular systems develop, adapt and remodel in response to local and systemic needs [1]. Over hours to days, blood vessels form and grow (vasculogenesis and angiogenesis), undergo structural adaptation (remodeling), or regress (pruning) [2]. These processes of vascular network patterning or angioadaptation [3] are essential for many functions of the circulatory system, including growth, responses to sustained exercise, estrus cycle, pregnancy, wound healing and ageing. Furthermore, they are centrally involved in diseases including hypertension, tissue ischemia (coronary heart disease, stroke) and tumor growth, and in natural and therapeutic responses to these diseases.
To function efficiently, vascular networks must satisfy two apparently conflicting requirements. The demand for oxygen and its low solubility in tissue necessitate a dense network, such that its distance from tissue cells does not exceed the maximum oxygen diffusion distance (about 30 µm in the heart). A dense mesh-like structure can satisfy this requirement, but at the expense of high resistance to flow (Figure 1A). Conversely, a hierarchical tree-like structure can deliver flow to terminal branches efficiently but does not provide a spatially uniform vascular supply. Actual microvascular networks combine both types of structures: a hierarchical system is embedded in the supplied region so that exchange vessels are distributed with approximately uniform density. A further requirement is the ability to adapt to varying demands, while maintaining flow. Thus, the development of vascular networks presents a complex problem of biological pattern formation.
Figure 1. Concepts of microvascular pattern formation.
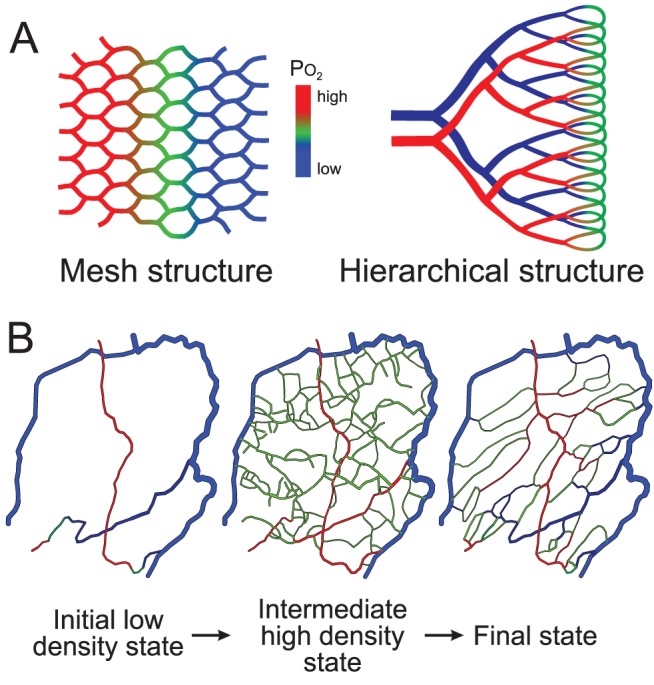
(A) Microvascular networks are often conceptualized as mesh or hierarchical structures. A mesh minimizes diffusion distances between capillaries and tissue but has high flow resistance and results in non-uniform oxygen levels from the arterial to the venous side. In a hierarchical structure, larger supply vessels decrease flow resistance, but regions surrounding those vessels are inadequately supplied due to large diffusion distances. Colors (red - green - blue) indicate flow from arterial to venous vessels, with decline in oxygen levels. (B) Hypothesized steps in generation of functional vascular networks. A dense network of vessels is generated by over-abundant angiogenesis and refined by structural adaptation and pruning. Resulting networks combine features of mesh and hierarchical structures.
How is this patterning problem solved? Much research has focused on molecular and cellular aspects of angiogenesis and anti-angiogenesis and on translating the results to the clinic for the treatment of hypoxic conditions (e.g. vascular occlusion) or unwanted vascularization (e.g. tumor growth). However, the formation of functional vascular networks remains poorly understood. In early development, before circulation starts, vascular patterning is genetically determined [4], but genetic information cannot specify the individual positions and behavior of more than 109 vessels in the human body. We hypothesize that the problem of vascular patterning is ‘solved’ by stochastic sprouting angiogenesis in response to a growth factor generated in hypoxic regions (e.g. vascular endothelial growth factor, VEGF), coupled to structural reactions (growth, regression, elimination) of each vessel to mechanical and biochemical stimuli. According to this hypothesis, angiogenesis results in networks with disordered structures, which organize themselves into functional networks through structural adaptation and pruning [2] (Figure 1B).
To test this hypothesis and analyze the relations between biological mechanisms and system properties, we developed a theoretical model that integrates simulations of network blood flow, convective and diffusive oxygen transport, generation and diffusion of VEGF [5], stochastic sprouting angiogenesis [6], structural adaptation and vessel elimination by pruning [3]. Several theoretical models for angiogenesis have been developed [7]–[18]. Our approach combines elements of those studies with a model for structural adaptation of vessel diameters [19], [20] including information transfer by conducted responses along vessel walls, which is needed for proper flow distribution and avoidance of functional shunts [21].
The model is based on experimental observations of network structure and hemodynamics in rat mesentery, a thin sheet-like tissue [22]. In brief, VEGF is generated in hypoxic regions [23]. Diffusive transport of oxygen and VEGF is simulated [24]. Vessel sprouts are generated with a VEGF-dependent probability. Non-flowing sprouts maintain a fixed diameter [25] until they connect to other segments and commence flow. Diameters of flowing segments vary with time according to generic rules, including responses to mechanical stimuli (intravascular pressure and wall shear stress) and to metabolic status (represented by intravascular oxygen partial pressure, PO 2). Vessels are pruned if their diameter falls below a critical threshold. Under these assumptions, the model predicts the time-dependent development of the network structure, including the positions, lengths and diameters of each segment, and the resulting distributions of blood flow, oxygen and VEGF.
Methods
Observations of mesenteric network
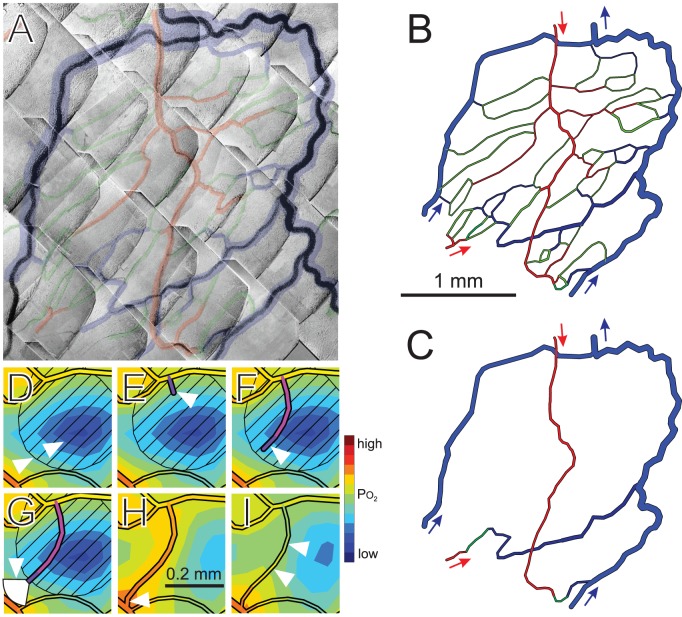
In procedures approved by the University and State authorities for animal welfare, the small bowel of a male wistar rat was exteriorized and a fat-free portion of the mesenteric vascular network was observed by intravital microscopy [22]. Papaverine (10−4 M) was continuously applied to suppress vessel tone. The spatial arrangement and diameters and lengths of segments were measured (Figure 2A), together with hematocrit and blood flow velocity for vessels entering and leaving the network [26], [27].
Figure 2. Steps in simulation approach.
(A) Network of microvessels in rat mesentery, imaged using intravital microscopy. Shaded overlay highlights vessel positions, with arterioles (red), capillaries (green) and venules (blue). This region was selected for analysis because the outer loop of venules provides stable boundary conditions for the tissue domain. (B) Computer generated image of network structure, trimmed to reduce the number of network boundary nodes to five (arrows). (C) Network skeleton, used as initial condition for simulations. In (D–I), a small region within a typical simulation is shown at a sequence of times indicating aspects of the method. White triangles denote features mentioned in this caption. (D) The oxygen field surrounding the vessels is computed using the Green's function method. Blue shades denote low oxygen levels. VEGF is assumed to be generated in hypoxic regions and to diffuse according to local gradients, and the resulting VEGF field is computed. Diagonal hatching indicates VEGF concentration above a given threshold. (E) On vessels lying in regions with VEGF above threshold, sprouts are generated with probability dependent on local VEGF concentration. (F) A fixed rate of sprout elongation is assumed. Direction of growth is randomly varied at each time step. (G) If other vessels lie within a sector of radius 100 µm ahead of the sprout tip, the growth is biased towards them. (H) A sprout reaching another vessel forms a connection, allowing flow. (I) Diameters of flowing vessels adapt to metabolic and hemodynamic stimuli.
Overview of model
The theoretical model combines a network-oriented analysis of blood flow, angiogenesis and structural adaptation with a continuum analysis of oxygen and VEGF delivery, production, diffusion and uptake. The network is represented as a set of straight segments with defined positions, diameters and blood flow rates. The simulation is implemented using the C language on personal computers. Typical run time is about 1 minute per time step. Parameter values are given in Table 1. The precise values are stated for reproducibility, but the number of decimals shown does not imply a corresponding precision in their estimation.
Table 1. Model parameters.
| Blood parameters | ||
| Maximal RBC oxygen concentration | C 0 = 0.5 cm3O2 cm−3 | [24] |
| Effective unbound oxygen solubility | αeff = 3.1×10⁻⁵ cm3O2 cm−3 mmHg−1 | [24] |
| Hill equation parameter | P 50 = 38 mmHg | [24] |
| Hill equation parameter | n = 3 | [24] |
| Tissue oxygen parameters | ||
| Krogh diffusion constant | DO α = 6×10⁻¹⁰ cm3O2 cm−1 s−1 mmHg−1 | [24] |
| Consumption rate | M 0 = 0.5–2.5 cm3O2 (100 cm3)−1 min−1 | See text |
| PO 2 at half-maximal consumption | Pc = 1 mmHg | [24] |
| VEGF parameters | ||
| Diffusivity | DG = 1.13×10⁻⁶ cm2 s−1 | [51] |
| Basal release rate | MG 0 = 1.97×10⁻³ pM s−1 | [51] |
| Tissue degradation rate constant | KG = 2.82×10⁻³ s−1 | See text |
| Structural adaptation parameters | ||
| Reference wall shear stress | τref = 0.103 dyn/cm2 | [20] |
| Reference oxygen level for metabolic signal | PO 2ref = 93.2 mmHg | [20] |
| Conducted response length constant | Lc = 17300 µm | [20] |
| Reference flow rate for metabolic signal | Qref = 0.198 nl/min | [20] |
| Conducted response saturation | J 01 = 1000 µm | See text |
| Pressure sensitivity | kp = 0.68 | [20] |
| Metabolic sensitivity | kp = 0.70 | [20] |
| Conducted response sensitivity | kc = 2.45 | [20] |
| Shrinking tendency | ks = 2.549 | See text |
| Randomization of shrinking tendency | Ran-ks = 0.1 | [47] |
| Structural adaptation time scale | T = 4.5 day | [46] |
| Angiogenesis parameters | ||
| Time step | Δt = 1 day | |
| Diameter of new sprouts | Ds = 10 µm | [25] |
| Threshold VEGF concentration | Cth = 0.8 nM | See text |
| Constant in sprouting probability function | Cth 50 = 0.5 nM | See text |
| Maximum sprout formation probability | kp = 0.002 µm−1 day−1 | [12] |
| Sprout growth rate | Vg = 50 µm day−1 | [39] |
| Attraction constant to nearby vessels | kV = 10 µm−1 | See text |
| Maximum vessel sensing distance | Rmax = 100 µm | [41] |
| Maximum vessel sensing angle | θmax = π/3 | See text |
| Variance of growth direction randomization | σs = 0.1 | See text |
| Vessel migration parameters | ||
| Threshold for migration | λt = 0.05 | See text |
| Maximum migration velocity | vmax = 1 µm day−1 | See text |
Initial network structure
To create an initial condition, the network was reduced to a minimal ‘skeleton,’ retaining five boundary nodes at which blood flows enters or exits the network (Figure 2C). The network lies in a thin (20 µm) sheet of tissue with area 4.23 mm2. Flow or pressure conditions in these segments were specified based on simulations of a larger network containing the region [28], and are typical for vessels of these sizes and types in this tissue. Two arterioles feed the region with a PO 2 of 75 mmHg. One arteriole (upper in Figure 2C) is held at a fixed pressure of 59.09 mmHg with an inflow hematocrit of 0.3742. The flow rate in the other feeding arteriole is 15 nl/min. Two venules flow into the network and form boundaries for the tissue domain. Each venule has a flow rate of 28.1 nl/min, an inflow hematocrit of 0.4 and a PO 2 of 38 mmHg. The diameters of these venules are fixed to provide stable conditions on the boundary of the tissue domain. The venules converge at a single outflow, which is assigned a pressure of 15 mmHg.
Flow rates
The method for simulating blood flow in microvascular networks follows established approaches [28], [29]. The network is represented as a set of resistive elements meeting at nodes. The flow resistance of a segment is
| (1) |
where L and D are length and diameter, ΔP is pressure drop and ηapp is apparent viscosity of blood, dependent on diameter and hematocrit [28], [30]. Non-uniform partition of hematocrit at diverging bifurcations is included [30], [31]. The flows into each node are expressed in terms of nodal pressures and flow resistances. Setting the sum of flows to zero gives a system of linear equations for nodal pressures [32], which is solved iteratively. The wall shear stress is
| (2) |
Because flow resistance depends on hematocrit, a further iterative process is required, in which hematocrits are recalculated, resistances are updated and flows are recomputed. This is repeated until changes in flows and hematocrits do not exceed a small tolerance.
Oxygen field
The physical principles governing convective and diffusive transport in tissue are well established [33]. The steady-state distribution of oxygen in vessels and tissue is computed using a two-dimensional implementation of the computationally efficient Green's function method [24], [34]. The partial pressure of oxygen PO 2(x,y) satisfies
| (3) |
where DO 2 and α are diffusivity and solubility in tissue. The oxygen consumption rate M(PO 2) is governed by Michaelis-Menten kinetics
| (4) |
where M 0 represents demand, assumed uniform, and P 0 represents PO 2 at half-maximal consumption. Convective oxygen flux in blood is
| (5) |
where Q is flow rate, HD is discharge hematocrit,
| (6) |
is oxyhemoglobin saturation, Pb is blood PO 2, C0 is oxygen-binding capacity of red blood cells, P 50 is PO 2 at 50% saturation, n is a constant and αeff is effective solubility of oxygen in blood. The boundary conditions are continuity of PO 2 and oxygen flux at the blood-tissue interface. The oxygen field is expressed as a superposition of fields resulting from an array of sources (representing vessels) and sinks (representing tissue regions), whose strengths are computed so as to match intravascular and extravascular oxygen levels. The sinks are located on a square array of tissue points spaced 50 µm apart throughout the region spanned by the network. Effects of intravascular resistance to radial oxygen diffusion [35] are included. Very short segments compromise the numerical stability of this method for solving convection-diffusion problems. Simulations were designed such that segments have a minimum length 10 µm.
Growth factor field
Among the multiple chemical factors that influence the formation and growth of blood vessels, VEGF plays a key role [36]. Released in hypoxic regions, it stimulates the growth of new vessels, which may increase oxygen supply to those regions. In the present model, this process is simulated based on previously developed models for spatial distribution of VEGF in skeletal muscle tissue [5], [23]. VEGF is released by parenchymal cells at a rate that depends on PO 2, diffuses through tissue with diffusivity DG, and is degraded or taken up uniformly with linear kinetics and rate constant KG. Its concentration CG(x,y) satisfies
| (7) |
The dependence of release rate on PO 2 (in mmHg) is:
 |
(8) |
where MG 0 is the basal rate. These equations were developed by Ji et al. [23]. The value of KG was estimated as follows. A typical length scale for concentration gradients is Ldiff = (DG/KG)1/2. The results of Ji et al. [23] imply that Ldiff≈200 µm, so KG = 2.82×10⁻³ s−1. Resulting values of CG are in the range MG 0/KG to 6MG 0/KG, i.e. 0.7 to 4.2 pM, consistent with the results of Ji et al. CG(x,y) is computed using the Green's function method, neglecting exchange of VEGF between tissue and vessels.
Sprout formation
Angiogenesis is assumed to occur by sprouting from existing vessels [37]. Splitting angiogenesis (intussusception) is not included. Numerous models for sprouting angiogenesis have been proposed. The present approach follows that of [12]. At each time step, a point is selected with uniform probability on each segment, local CG is computed and a sprout is formed with probability
 |
(9) |
where kp is the maximal probability of sprout formation per length per time. This functional dependence is chosen to give threshold concentration Cth for sprout formation and approach to the maximal probability at large concentrations [12]. If a sprout forms within 10 µm of a node on the parent segment, it is moved to that node. If the sprout is at a network boundary node or an existing branch point, it is suppressed. These rules were introduced for technical reasons as already mentioned, and do not substantially affect the patterning process.
In this two-dimensional implementation, the sprout direction is randomly ±90° to the parent segment. Sprouts maintain a diameter of Ds = 10 µm [25] until they become part of a flow pathway, and are subject to structural adaptation. The threshold VEGF concentration Cth is a critical parameter. A low value gives uncontrolled angiogenesis and network instability. A high value gives inadequate vascular density. The chosen value Cth = 0.8 pM gives adequate, stable network structures over a range of oxygen demand, lies between the values observed experimentally at rest and in exercise [38], and is within the range predicted by theoretical models [5], [23]. The chosen value of Cth 50, 0.5 pM, gives rapid approach to the maximal rate of sprout formation as CG increases.
Elongation of sprouts
The simulation of sprout growth follows previous work [12]. Sprouts are assumed to elongate at constant rate Vg until they connect with another vessel. Reported growth rates vary; Vg = 50 µm/day is assumed [39]. The direction of endothelial cell migration shows persistence with time [40]. To represent effects of heterogeneity in extracellular matrix structure, the current direction d is rotated by a random angle from a Gaussian distribution with zero mean and variance σs, giving a direction d ′ for the next time step. This variance gives vessel tortuosity consistent with that seen in mesenteric networks.
The tip cells leading the growth of endothelial sprouts possess filopodia, elongated processes that explore the tissue for distances of up to 100 µm [41], and may allow the sprout to sense other vessels. Such a homing mechanism, which was not included in previous models [12], is needed since otherwise sprouts in three-dimensional tissues would rarely intersect other vessels. In the model, sprouts are attracted by other vessels lying within a sector extending a distance Rmax from the tip and an angle θmax from the previous growth direction. The attraction decreases with distance r from the tip, and with angle θ from the previous growth direction. The vector sum
| (10) |
is constructed, where the sum is over the segments within the sector, the integral is along each segment, and
| (11) |
 |
(12) |
The new sprout direction is
| (13) |
where kV represents sensitivity of growth direction to existing vessels. The functions introduced in equations (11) and (12) are chosen so that the effect of other vessels on sprout growth falls to zero at the edge of the sector explored by filopodia. The specific forms of these functions are not important. The results are, however, sensitive to the assumed values of the sensing radius Rv and the sensitivity kv. The sensing radius is set equal to the maximum observed length of filopodia, 100 µm [41]. A large value of kV is chosen, so that vessels are strongly directed toward vessels within the sensing radius.
At each time step, all sprouts are elongated by VgΔt in increments of 5 µm. If the distance of a tip to any other segment is less than 5 µm, a new segment is created linking the tip to the nearest point on that segment. If necessary, the resulting intercept point is moved to eliminate short segments (<10 µm). If the intercept point is at a network boundary node or if the segment intersects the boundary of the tissue domain, the sprout is suppressed. These rules were introduced for technical reasons, and do not substantially affect the patterning process.
In previous models, sprout growth was biased up the gradient of VEGF concentration [12]. Here, it was found that this interferes with formation of new flow pathways. VEGF concentration is highest near the middle of hypoxic regions, and growing sprouts then remain and meander in such regions, rather than connecting with other vessels. Therefore, this effect was excluded.
Branching angles and tension-induced migration
In the model, new branch points are formed by sprouting from existing segments, and by coalescence of sprouts with existing segments. Of the three branching angles formed by such events, one is necessarily 180° and the other two must average to 90° (Figure 3A). This would still be the case even if the model was modified to include the effect of chemical cues on sprouting direction [42], such that sprouts formed at variable angles to the parent vessel. If no mechanism for change of branch angles is included, the resulting distribution of branching angles has peaks at 90° and 180°. In the observed network (see Results), the angles are smoothly distributed about the mean (120°). This discrepancy in angle distribution implies that branching angles must change and vessels must migrate through tissue after formation of bifurcations (Figure 3B), by a mechanism that has not previously been described.
Figure 3. Bifurcation angles resulting from vessel sprouting and connection.
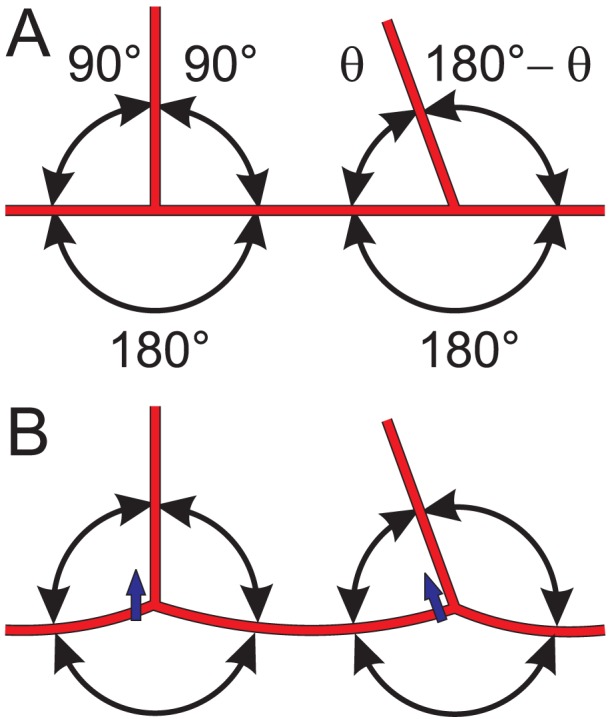
(A) A sprout at 90° to the parent vessel creates initial bifurcation angles of 90°, 90° and 180°. A sprout forming a connection to an existing vessel creates initial bifurcation angles of θ, 180°−θ and 180°, where θ depends on the direction from which the sprout approaches. (B) Migration through the tissue (short blue arrows) driven by tension in each segment and the resulting imbalance of forces acting within the network results in a reduction of the 180° bifurcation angle and increases in the other two angles.
Blood vessels in vivo are normally subject to longitudinal tension [43], [44]. Structural components of the interstitial space, including collagen, are subject to continuous turnover in normal tissues [45]. These observations suggest a potential mechanism for remodeling of branch angles, in which the net forces on each segment resulting from axial tension tend to pull it through the interstitium, and movement is made possible by the continuous dissolution and synthesis of collagen fibers.
This mechanism is implemented in the model as follows. Each node (including non-branching nodes) migrates through the surrounding tissue at a rate dependent on the resultant force due to vessel tensions, which are assumed proportional to diameter. The normalized force is
| (14) |
where the sum is over the segments at the node, Di is diameter and e i is a unit vector parallel to the segment. If |f t| exceeds a threshold λt, the node migrates in the direction of f t with velocity proportional to |f t|−λt, i.e.
| (15) |
where vmax is the maximum speed and  is a unit vector in the direction of f
t. Inclusion of the threshold stabilizes curved vessels which otherwise would eventually straighten. Chosen values of vmax and λt yield curvatures comparable to those observed. In this model for tension-induced migration, total vessel length decreases slowly in the absence of sprouting, until the normalized force at each node approaches the threshold value.
Structural adaptation and pruning
The model for structural adaptation of flowing segments was developed previously [19], [20], and is used here with slight modifications. The diameter D of each segment varies in response to several stimuli:
| (16) |
where Δt is the time step and T is the timescale [46]. The total signal is
| (17) |
The first two terms represent responses to wall shear stress τw (in dyn/cm2) and intravascular pressure P (in mmHg). The function
| (18) |
describes the correlation of τw (in dyn/cm2) with P [20]. A metabolic signal is generated in each vessel dependent on vessel PO 2,
| (19) |
where N sets the oxygen sensitivity. Previously [20] N = 1 was assumed, but in the present simulations this leads to loss of many vessels needed for adequate oxygen supply, because the signal lacks sensitivity to PO 2 at low levels. Here N = 2 is assumed. Downstream transmission of the metabolic signal is modeled by a convective flux generated in each segment in proportion to Jmlseg and accumulated downstream, where lseg is segment length. The local metabolic signal is
| (20) |
Each segment contributes to the conducted response Jc in proportion to Smlseg. (Previously [20], the factor lseg was omitted.) Conducted responses travel upstream, decaying as exp(−s/Lc), where s is distance. At converging bifurcations relative to direction of conduction, incoming signals are summed. At diverging bifurcations, the signal is divided equally among the upstream vessels. The conducted metabolic signal is
| (21) |
where the magnitude of J 01 is set to allow dropout of short shunt pathways while retaining longer, functional pathways. The shrinking tendency ks was adjusted to give a flow rate 36.9 nl/min at oxygen demand 2 cm3O2/100 cm3/min, matching the observed network. A random component, normally distributed with zero mean and standard deviation Ran-ks is included in ks [47]. If a diameter drops below 3 µm, the minimum for passage of red blood cells, the segment is pruned, as are any other segments whose flow ceases as a result.
Results
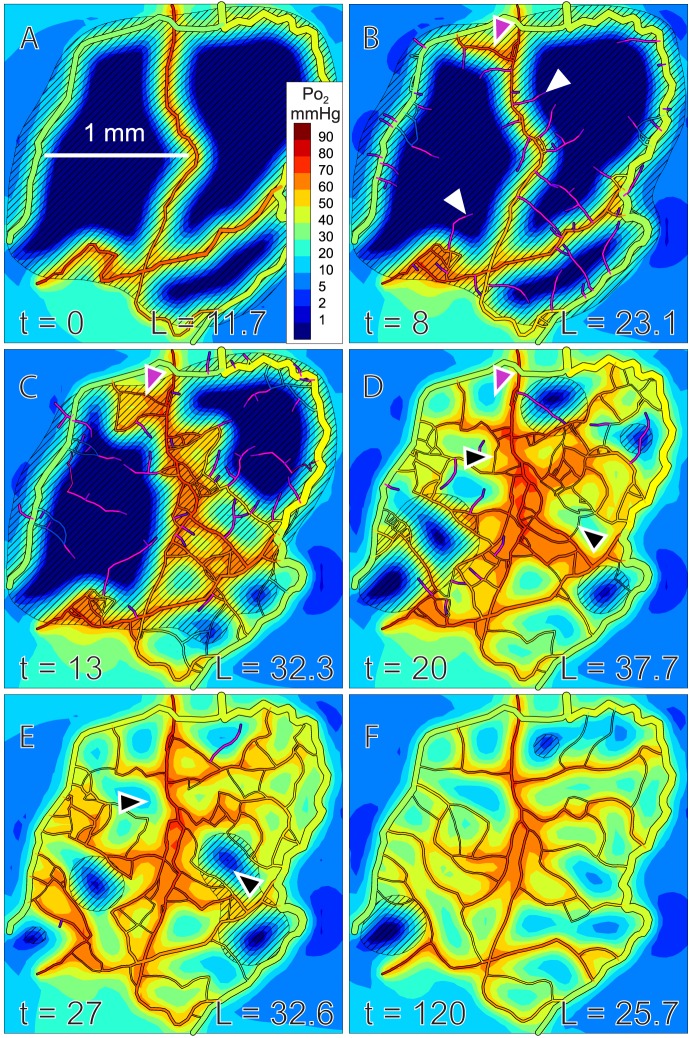
Results of a simulation are shown in Figure 4. Initially, sprouts grow and connect to form dense mesh-like structures, which are refined to produce more hierarchical structures with an orderly progression of vessel diameters. In this process, redundant segments are removed, including those forming very short shunt pathways (Figure 4C–D). While the remaining flow pathways show widely varying lengths, the diameters of the short flow pathways are relatively small, such that they do not draw much flow away from the longer flow pathways. Total vessel length peaks at about 20 days, and declines towards a stable steady state, in a temporal sequence similar to that observed in wound healing [48].
Figure 4. Simulated angiogenesis, showing oxygen and VEGF distributions.
Oxygen levels in vessels and tissue are color coded according to scale at right. Dark blue indicates hypoxic tissue. Diagonal shading indicates VEGF above threshold concentration. Time (t) in days and total vessel length (L) in mm are indicated. Maximal rate of sprout formation is 2 mm−1day−1. Tissue oxygen demand is 2 cm3/100 cm3/min. (A) Initial configuration. (B) Sprouts (white arrows) and a short flow pathway between arterioles and venules (a-v shunt, purple arrow) are generated. (C) More complex flow pathways form, leading to improved oxygenation (lower right region). (D) Improved oxygenation leads to decreased VEGF levels. Structural adaptation causes pruning of the a-v shunt (purple arrow), but some redundant flow pathways remain (black arrows). Total vessel length reaches its maximum. (E) Structural adaptation leads to pruning of redundant flow pathways (black arrows). (F) Final refined network. Virtually no hypoxia remains and VEGF levels are generally below threshold. See online supplement, Video S1, for movie clip.
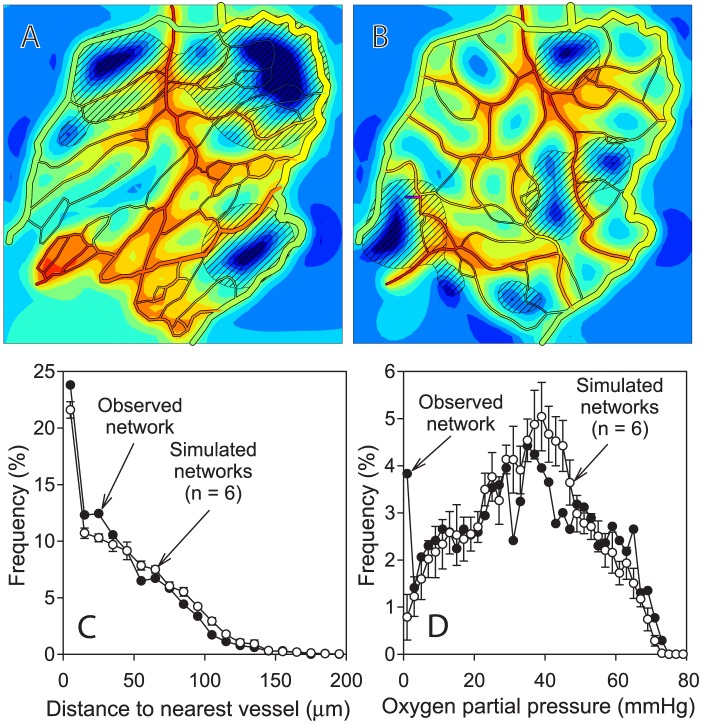
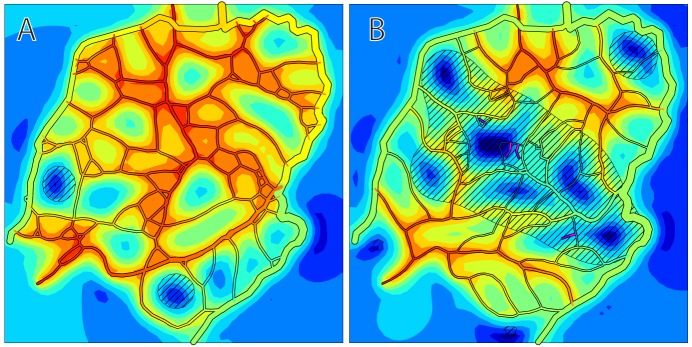
Characteristics of simulated networks are compared in Table 2 and Figure 5 with those of the experimentally observed network from which the initial configuration (Figure 4A) was derived. The simulated networks are qualitatively similar to the observed network and values of key parameters are comparable. The simulated networks have slightly lower total vessel length than the observed network, and the distribution of distance from tissue points to the nearest vessel is slightly right skewed in the simulated networks relative to the observed network. Despite the lower vascular density, the mean tissue PO 2 in the simulated networks agrees closely with that in the observed network. Moreover, the simulated networks have a narrower distribution of PO 2 and less hypoxic tissue (PO 2<1 mmHg). These results imply that the assumed mechanisms of angiogenesis and adaptation can generate network structures that match and indeed slightly exceed the performance of the observed network with regard to oxygen transport.
Table 2. Comparison of simulated networks with experimentally observed network.
| Observed network | Simulated networks: mean ± s.d. (n = 6) | |
| Total vessel length (mm) | 30.2 | 26.1±0.92 |
| Mean distance of tissue points to nearest vessel (µm) | 39.3 | 44.7±1.45 |
| Flow rate (nl/min) | 36.9 | 34.9±2.75 |
| Mean tissue PO 2 (mmHg) | 34.4 | 35.2±1.14 |
| Hypoxic fraction (%) | 3.24 | 0.355±0.308 |
Figure 5. Comparison of simulated and observed network characteristics.
Simulated oxygen and VEGF distributions in experimentally observed network (A), and in simulated angiogenesis at t = 200 days (B). The observed network structure is derived from the image shown in Figure 2A. The network at t = 200 days was derived from the same initial network as shown in Figure 4A but with a different seed for random number generation. Oxygen demand, rate of sprout formation, length scale, color coding of oxygen levels and diagonal shading indicating VEGF above threshold are as in Figure 4. (C) Frequency distribution of distance of tissue points to nearest vessel. (D) Frequency distribution of oxygen levels at tissue points. Results for simulated networks are mean ± standard deviation for n = 6 simulations with different seeds for random number generation.
The effect of tension-induced lateral migration of vessels on the distribution of branching angles is illustrated in Figure 6. If no mechanism for change of branch angles is included, the resulting network structures have many vessels with abrupt changes in direction (Figure 6A) and the distribution of branching angles has peaks at 90° and 180° (Figure 6B). Inclusion of tension-induced migration in the model results in a more uniform distribution (Figure 6C) although the distribution is not as broad as that obtained from the experimentally observed network (Figure 6D).
Figure 6. Effect of tension-induced vessel migration on distribution of branching angles.
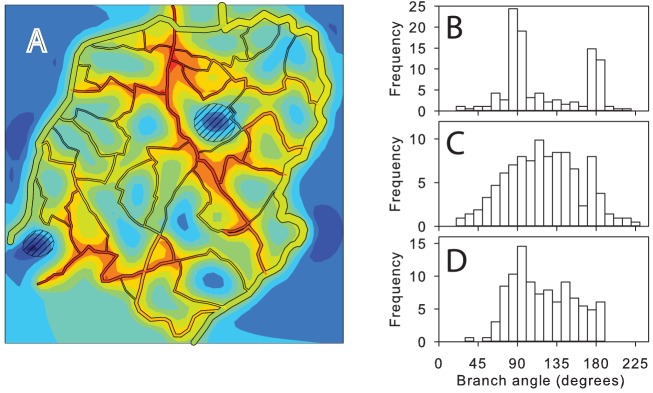
(A) Example of network structure generated when tension-induced migration is suppressed, at t = 200 days. Other conditions are as in Figure 4. (B) Distribution of branching angles for network shown in A. (C) Distribution of branching angles for observed network structure. (D) Distribution of branching angles for network shown in Figure 4 at t = 200 days, including tension-induced migration.
The variation of total vessel length during simulated angiogenesis is shown in Figure 7. When the maximal rate of sprout formation is 2 mm−1day−1, as in Figures 4 and 5, an overshoot in vascular density is predicted. With a lower rate of sprout formation, 1 mm−1day−1, the overshoot is smaller and the network takes longer to stabilize, remaining at a higher vascular density. Over-abundant initial production of vessels is therefore needed for efficient vascular network generation. If the mesh structure generated during the initial phase of angiogenesis is not sufficiently dense, it is inadequate to meet oxygen needs and further sprout formation is stimulated, prolonging the network's instability.
Figure 7. Dynamics of network generation.
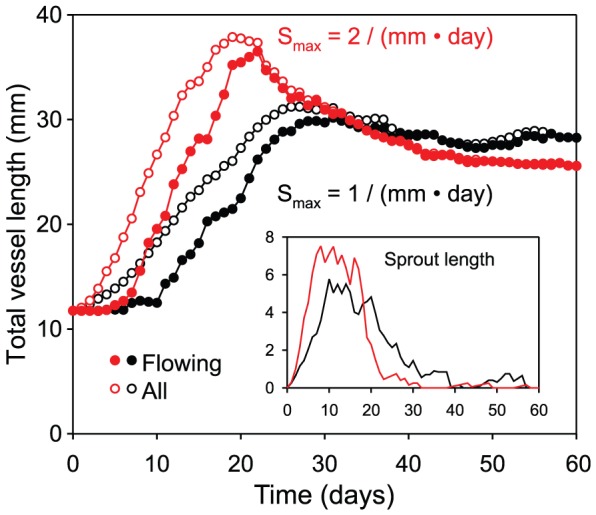
Variation of total vessel length during an individual simulation of angiogenesis. Main plot: vessel length. Inset: length of non-flowing sprouts. Initially, total length increases rapidly due to sprouting. After sprouts form connections, flowing length increases. When sprout formation rate is 2 mm−1day−1 (red curves), summed vessel length shows a strong peak at 20 days and then decreases, stabilizing after 50 days. For reduced sprout formation rate (1 mm−1day−1, black curves), peak vascular length is reduced, stabilization takes longer and total vessel length remains higher.
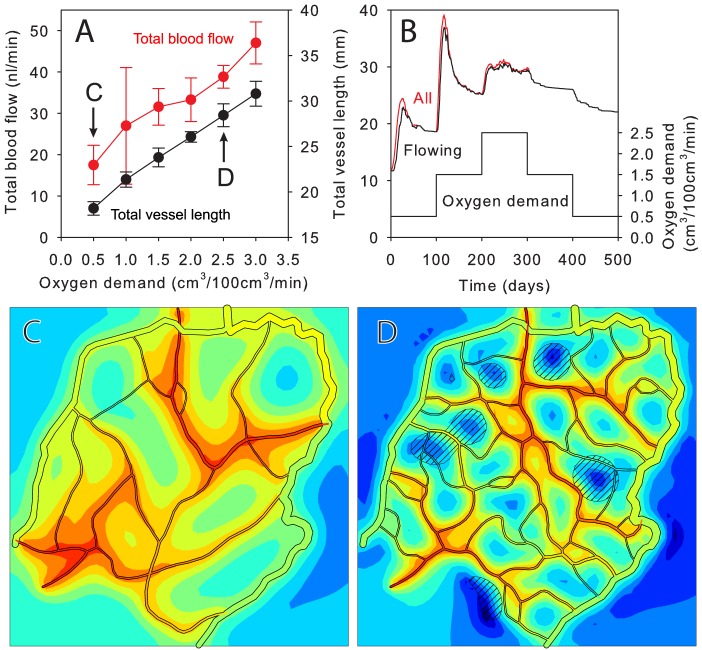
The assumed mechanisms allow adaptation to changing conditions. Effects of varying oxygen demand were explored, assuming a fixed arteriole-venule pressure drop. With increasing demand, total vessel length and flow rate increased (Figure 8A). Resulting network structures are shown in Figures 8C and D. Figure 8B illustrates the dynamic response of the network to changes in oxygen demand over time. A step increase (in cm3/100 cm3/min) from 0.5 to 1.5 stimulates an overshoot in total vessel length followed by stabilization. After a step increase to 2.5, the rate of sprout formation is not sufficient to produce an overshoot and stability is not achieved. This result with a sprout rate of 2 mm−1day−1 is similar to the behavior at an oxygen demand of 2 and a sprout rate of 1 mm−1day−1 shown in Figure 7, suggesting that the rate of sprout formation needed for efficient network generation is sensitive to oxygen demand. With step decreases in demand, the network regresses, but the vessel length remains higher than before at the same demand. This suggests that a period of high demand (e.g. exercise training) can lead to a long-term increase in vascular density.
Figure 8. Variation of network properties with oxygen demand.
(A) Total blood flow and vessel length at t = 200 days, for fixed arteriole-venule pressure drop (mean ± s.d. for 6–12 runs). (B) Time-dependent response of total vessel length to step changes in demand. Lower curve: oxygen demand. Upper curves: total vessel length (flowing, all, mean of 3 runs). (C, D) Network structures for demand 0.5 and 2.5 cm3/100 cm3/min. Length and color scales as in Figure 4.
Further simulations were used to explore the effects of inhibiting specific biological patterning mechanisms (Figure 9). Without structural adaptation and pruning, all new vessels remain at their initial diameter of 10 µm. A stable vessel network is formed, but the total vessel length is higher (31.8 mm) than in the simulated normal case (25.6 mm). Instead of a hierarchical branching pattern, a mesh-like structure develops. If conducted responses are inhibited by reducing the coefficient of the conducted response from 2.45 to 0.5, the network does not achieve a stable, well-oxygenated state. Functional shunts between arterioles and venules are not suppressed [21], and only regions close to the feeding arterioles receive adequate oxygenation.
Figure 9. Effects of inhibiting adaptation or conducted responses.
(A) Angiogenesis without structural adaptation and pruning. Resulting structure is mesh-like, without hierarchical structure. (B) Simulation of angiogenesis with reduced conducted response strength. Short flow pathways from feeding to draining vessels carry most of the flow. Regions remote from feeding vessels receive inadequate perfusion. Length and color scales as in Figure 4.
Discussion
These results show that the combination of stochastic angiogenesis stimulated by a growth factor, structural adaptation and pruning in response to hemodynamic and metabolic stimuli is capable of solving the ‘problem’ of vascular patterning and can generate hierarchical networks with low diffusion distances. To establish and maintain such networks, the following mechanisms are essential:
generation of a diffusible vessel growth factor in hypoxic tissue regions;
formation of vessel sprouts in response to above-threshold levels of growth factor;
maintenance of sprouts without pruning before they connect to other vessels;
ability of sprouts to connect with other vessels forming patent flow pathways;
diameter adaptation of flowing vessels to hemodynamic and metabolic stimuli and upstream conducted responses;
elimination of redundant vessels by pruning.
The initial network, derived by reducing an observed mesenteric network to a minimal ‘skeleton’, allowed testing of the model by comparing predicted structures with the actual network. Initial conditions for angiogenesis in development, wounds, exercise or tumor growth may differ from those assumed here. In most tissues, networks ramify in three dimensions. While simulations of other tissues may reveal the need for additional mechanisms or constraints for formation of realistic network structures, the arguments leading to the above conclusions are not specific to the assumed geometry.
The ability of a vessel to form a sprout or to connect with a sprout is here assumed independent of vessel type (arterial or venous). While arterioles and venules show different expression of genes involved in angiogenesis [49], both types participate in angiogenesis, and arterial-venous plasticity is observed during neovascularization [50].
The mechanisms of angiogenesis are more numerous and complex than those included here. Multiple growth factors participate in the control of sprouting angiogenesis. VEGF exists in several isoforms, and is not the only factor involved. Other factors may play equally important roles. Nonetheless, it can be concluded from our results that angiogenesis in response to a growth factor released in hypoxia can result in vascular patterns that are consistent with in vivo observations. Our approach demonstrates a minimal set of mechanisms that is sufficient to solve the vascular patterning problem, generating structures that combine low diffusion distances to all tissue cells with hierarchical branching, and adapt to changing conditions. The model allows assessment of the roles of individual mechanisms in the patterning process and changes resulting from their modification. It shows that network formation involves closely coupled processes of angiogenesis, structural adaptation and pruning. Resulting insights may stimulate further experimental investigations of angiogenesis and development of novel therapeutic approaches.
Supporting Information
Simulated angiogenesis, showing oxygen and VEGF distributions. Oxygen levels in vessels and tissue are color-coded according to scale at right in mmHg. Dark blue indicates hypoxic tissue. Diagonal shading indicates VEGF above threshold concentration. Time (t) in days is indicated on each frame. See Figure 3 caption for further description of this simulation.
(AVI)
Funding Statement
This work was supported by National Institutes of Health grants HL034555, HL007249 and CA040355 (http://www.nih.gov/). The funders had no role in study design, data collection and analysis, decision to publish, or preparation of the manuscript.
References
- 1. Peirce SM, Skalak TC (2003) Microvascular remodeling: a complex continuum spanning angiogenesis to arteriogenesis. Microcirculation 10: 99–111. [DOI] [PubMed] [Google Scholar]
- 2. Risau W (1997) Mechanisms of angiogenesis. Nature 386: 671–674. [DOI] [PubMed] [Google Scholar]
- 3. Zakrzewicz A, Secomb TW, Pries AR (2002) Angioadaptation: keeping the vascular system in shape. News Physiol Sci 17: 197–201. [DOI] [PubMed] [Google Scholar]
- 4. Isogai S, Lawson ND, Torrealday S, Horiguchi M, Weinstein BM (2003) Angiogenic network formation in the developing vertebrate trunk. Development 130: 5281–5290. [DOI] [PubMed] [Google Scholar]
- 5. Mac Gabhann F, Ji JW, Popel AS (2006) Computational model of vascular endothelial growth factor spatial distribution in muscle and pro-angiogenic cell therapy. PLoS Comput Biol 2: e127. [DOI] [PMC free article] [PubMed] [Google Scholar]
- 6. Carmeliet P, Jain RK (2000) Angiogenesis in cancer and other diseases. Nature 407: 249–257. [DOI] [PubMed] [Google Scholar]
- 7. Liotta LA, Saidel GM, Kleinerman J (1977) Diffusion model of tumor vascularization and growth. Bull Math Biol 39: 117–128. [DOI] [PubMed] [Google Scholar]
- 8. Balding D, McElwain DL (1985) A mathematical model of tumour-induced capillary growth. J Theor Biol 114: 53–73. [DOI] [PubMed] [Google Scholar]
- 9. Anderson AR, Chaplain MA (1998) Continuous and discrete mathematical models of tumor-induced angiogenesis. Bull Math Biol 60: 857–899. [DOI] [PubMed] [Google Scholar]
- 10. Hahnfeldt P, Panigrahy D, Folkman J, Hlatky L (1999) Tumor development under angiogenic signaling: a dynamical theory of tumor growth, treatment response, and postvascular dormancy. Cancer Res 59: 4770–4775. [PubMed] [Google Scholar]
- 11. Levine HA, Pamuk S, Sleeman BD, Nilsen-Hamilton M (2001) Mathematical modeling of capillary formation and development in tumor angiogenesis: penetration into the stroma. Bull Math Biol 63: 801–863. [DOI] [PubMed] [Google Scholar]
- 12. Tong S, Yuan F (2001) Numerical simulations of angiogenesis in the cornea. Microvasc Res 61: 14–27. [DOI] [PubMed] [Google Scholar]
- 13. Sachs RK, Hlatky LR, Hahnfeldt P (2001) Simple ODE models of tumor growth and anti-angiogenic or radiation treatment. Mathematical and Computer Modelling 33: 1297–1305. [Google Scholar]
- 14. McDougall SR, Anderson AR, Chaplain MA (2006) Mathematical modelling of dynamic adaptive tumour-induced angiogenesis: clinical implications and therapeutic targeting strategies. J Theor Biol 241: 564–589. [DOI] [PubMed] [Google Scholar]
- 15. Owen MR, Alarcon T, Maini PK, Byrne HM (2009) Angiogenesis and vascular remodelling in normal and cancerous tissues. J Math Biol 58: 689–721. [DOI] [PubMed] [Google Scholar]
- 16. Machado MJ, Watson MG, Devlin AH, Chaplain MA, McDougall SR, et al. (2011) Dynamics of angiogenesis during wound healing: a coupled in vivo and in silico study. Microcirculation 18: 183–197. [DOI] [PubMed] [Google Scholar]
- 17. Welter M, Rieger H (2010) Physical determinants of vascular network remodeling during tumor growth. European Physical Journal e 33: 149–163. [DOI] [PubMed] [Google Scholar]
- 18. Perfahl H, Byrne HM, Chen T, Estrella V, Alarcon T, et al. (2011) Multiscale modelling of vascular tumour growth in 3D: the roles of domain size and boundary conditions. PLoS One 6: e14790. [DOI] [PMC free article] [PubMed] [Google Scholar]
- 19. Pries AR, Secomb TW, Gaehtgens P (1998) Structural adaptation and stability of microvascular networks: theory and simulations. Am J Physiol 275: H349–H360. [DOI] [PubMed] [Google Scholar]
- 20. Pries AR, Reglin B, Secomb TW (2001) Structural adaptation of microvascular networks: functional roles of adaptive responses. Am J Physiol Heart Circ Physiol 281: H1015–H1025. [DOI] [PubMed] [Google Scholar]
- 21. Pries AR, Hopfner M, le Noble F, Dewhirst MW, Secomb TW (2010) The shunt problem: control of functional shunting in normal and tumour vasculature. Nat Rev Cancer 10: 587–593. [DOI] [PMC free article] [PubMed] [Google Scholar]
- 22. Pries AR, Ley K, Gaehtgens P (1986) Generalization of the Fahraeus principle for microvessel networks. Am J Physiol 251: H1324–H1332. [DOI] [PubMed] [Google Scholar]
- 23. Ji JW, Mac Gabhann F, Popel AS (2007) Skeletal muscle VEGF gradients in peripheral arterial disease: simulations of rest and exercise. Am J Physiol Heart Circ Physiol 293: H3740–H3749. [DOI] [PubMed] [Google Scholar]
- 24. Secomb TW, Hsu R, Park EY, Dewhirst MW (2004) Green's function methods for analysis of oxygen delivery to tissue by microvascular networks. Ann Biomed Eng 32: 1519–1529. [DOI] [PubMed] [Google Scholar]
- 25. Nunes SS, Greer KA, Stiening CM, Chen HY, Kidd KR, et al. (2010) Implanted microvessels progress through distinct neovascularization phenotypes. Microvasc Res 79: 10–20. [DOI] [PMC free article] [PubMed] [Google Scholar]
- 26. Pries AR (1988) A versatile video image analysis system for microcirculatory research. Int J Microcirc Clin Exp 7: 327–345. [PubMed] [Google Scholar]
- 27. Pries AR, Secomb TW, Gaehtgens P (1995) Structure and hemodynamics of microvascular networks: heterogeneity and correlations. Am J Physiol 269: H1713–H1722. [DOI] [PubMed] [Google Scholar]
- 28. Pries AR, Secomb TW, Gessner T, Sperandio MB, Gross JF, et al. (1994) Resistance to blood flow in microvessels in vivo. Circ Res 75: 904–915. [DOI] [PubMed] [Google Scholar]
- 29. Pries AR, Secomb TW, Gaehtgens P, Gross JF (1990) Blood flow in microvascular networks. Experiments and simulation. Circ Res 67: 826–834. [DOI] [PubMed] [Google Scholar]
- 30.Pries AR, Secomb TW (2008) Blood Flow in Microvascular Networks. In: Tuma RF, Duran WN, Ley K, editors. Handbook of Physiology: Microcirculation, Second Edition. San Diego: Academic Press. pp. 3–36.
- 31. Pries AR, Ley K, Claassen M, Gaehtgens P (1989) Red cell distribution at microvascular bifurcations. Microvasc Res 38: 81–101. [DOI] [PubMed] [Google Scholar]
- 32. Lipowsky HH, Zweifach BW (1974) Network analysis of microcirculation of cat mesentery. Microvasc Res 7: 73–83. [DOI] [PubMed] [Google Scholar]
- 33. Popel AS (1989) Theory of oxygen transport to tissue. Crit Rev Biomed Eng 17: 257–321. [PMC free article] [PubMed] [Google Scholar]
- 34. Hsu R, Secomb TW (1989) A Green's function method for analysis of oxygen delivery to tissue by microvascular networks. Math Biosci 96: 61–78. [DOI] [PubMed] [Google Scholar]
- 35. Hellums JD, Nair PK, Huang NS, Ohshima N (1996) Simulation of intraluminal gas transport processes in the microcirculation. Ann Biomed Eng 24: 1–24. [DOI] [PubMed] [Google Scholar]
- 36. Semenza GL (2001) Regulation of hypoxia-induced angiogenesis: a chaperone escorts VEGF to the dance. J Clin Invest 108: 39–40. [DOI] [PMC free article] [PubMed] [Google Scholar]
- 37. Hansen-Smith FM, Joswiak GR, Baustert JL (1994) Regional differences in spontaneously occurring angiogenesis in the adult rat mesentery. Microvasc Res 47: 369–376. [DOI] [PubMed] [Google Scholar]
- 38. Hoffner L, Nielsen JJ, Langberg H, Hellsten Y (2003) Exercise but not prostanoids enhance levels of vascular endothelial growth factor and other proliferative agents in human skeletal muscle interstitium. J Physiol 550: 217–225. [DOI] [PMC free article] [PubMed] [Google Scholar]
- 39. Nehls V, Herrmann R, Huhnken M (1998) Guided migration as a novel mechanism of capillary network remodeling is regulated by basic fibroblast growth factor. Histochem Cell Biol 109: 319–329. [DOI] [PubMed] [Google Scholar]
- 40. Stokes CL, Lauffenburger DA (1991) Analysis of the roles of microvessel endothelial cell random motility and chemotaxis in angiogenesis. J Theor Biol 152: 377–403. [DOI] [PubMed] [Google Scholar]
- 41. Gerhardt H, Golding M, Fruttiger M, Ruhrberg C, Lundkvist A, et al. (2003) VEGF guides angiogenic sprouting utilizing endothelial tip cell filopodia. J Cell Biol 161: 1163–1177. [DOI] [PMC free article] [PubMed] [Google Scholar]
- 42. Chappell JC, Taylor SM, Ferrara N, Bautch VL (2009) Local guidance of emerging vessel sprouts requires soluble Flt-1. Dev Cell 17: 377–386. [DOI] [PMC free article] [PubMed] [Google Scholar]
- 43. Jackson ZS, Gotlieb AI, Langille BL (2002) Wall tissue remodeling regulates longitudinal tension in arteries. Circ Res 90: 918–925. [DOI] [PubMed] [Google Scholar]
- 44. Gaehtgens PAL (1971) Radial and longitudinal distensibility of arterial microvessels in the mesentery and their dependence on extravascular structures. Pflugers Arch 330: 277–289. [DOI] [PubMed] [Google Scholar]
- 45. Bishop JE, Laurent GJ (1995) Collagen turnover and its regulation in the normal and hypertrophying heart. Eur Heart J 16 Suppl C: 38–44. [DOI] [PubMed] [Google Scholar]
- 46. Gruionu G, Hoying JB, Pries AR, Secomb TW (2005) Structural remodeling of mouse gracilis artery after chronic alteration in blood supply. Am J Physiol Heart Circ Physiol 288: H2047–H2054. [DOI] [PubMed] [Google Scholar]
- 47. Pries AR, Cornelissen AJ, Sloot AA, Hinkeldey M, Dreher MR, et al. (2009) Structural adaptation and heterogeneity of normal and tumor microvascular networks. PLoS Comput Biol 5: e1000394-11. [DOI] [PMC free article] [PubMed] [Google Scholar]
- 48. Brown NJ, Smyth EA, Cross SS, Reed MW (2002) Angiogenesis induction and regression in human surgical wounds. Wound Repair Regen 10: 245–251. [DOI] [PubMed] [Google Scholar]
- 49. Shin D, Garcia-Cardena G, Hayashi S, Gerety S, Asahara T, et al. (2001) Expression of ephrinB2 identifies a stable genetic difference between arterial and venous vascular smooth muscle as well as endothelial cells, and marks subsets of microvessels at sites of adult neovascularization. Dev Biol 230: 139–150. [DOI] [PubMed] [Google Scholar]
- 50. Nunes SS, Rekapally H, Chang CC, Hoying JB (2011) Vessel arterial-venous plasticity in adult neovascularization. PLoS One 6: e27332. [DOI] [PMC free article] [PubMed] [Google Scholar]
- 51. Mac Gabhann F, Ji JW, Popel AS (2007) VEGF gradients, receptor activation, and sprout guidance in resting and exercising skeletal muscle. J Appl Physiol 102: 722–734. [DOI] [PubMed] [Google Scholar]
Associated Data
This section collects any data citations, data availability statements, or supplementary materials included in this article.
Supplementary Materials
Simulated angiogenesis, showing oxygen and VEGF distributions. Oxygen levels in vessels and tissue are color-coded according to scale at right in mmHg. Dark blue indicates hypoxic tissue. Diagonal shading indicates VEGF above threshold concentration. Time (t) in days is indicated on each frame. See Figure 3 caption for further description of this simulation.
(AVI)


