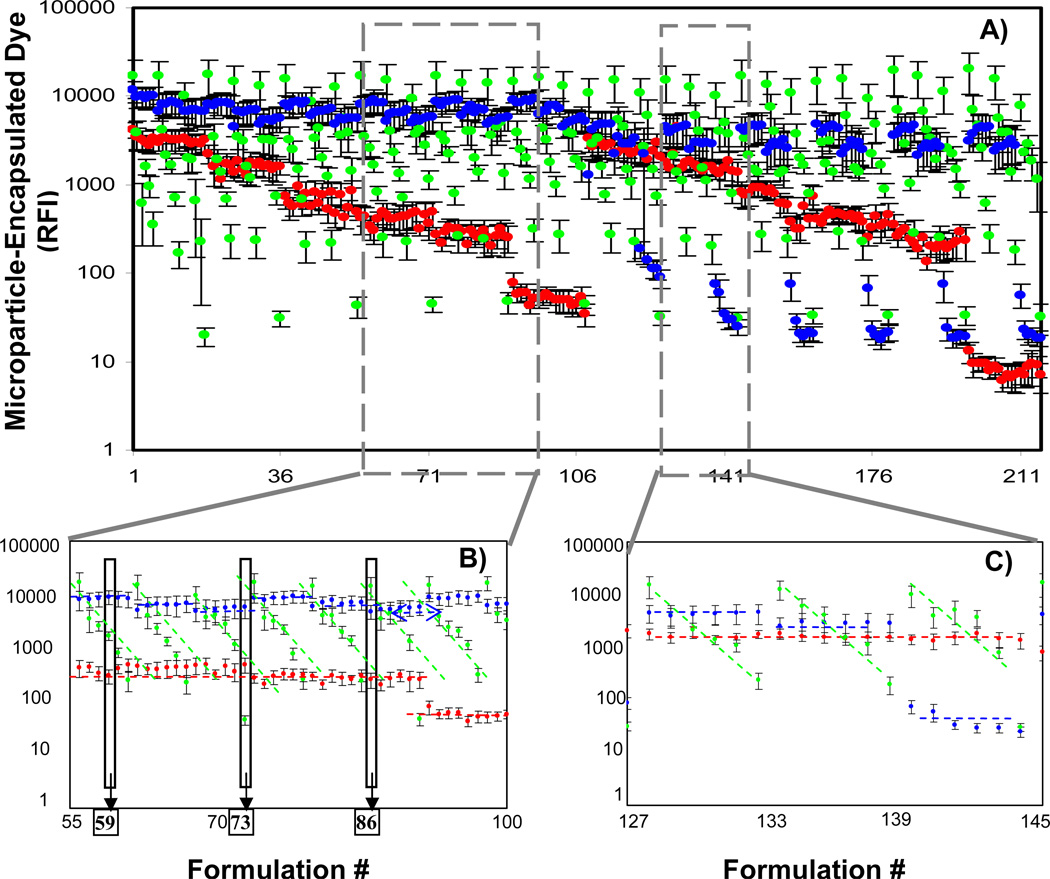
Figure 3.
Particles co-encapsulating three different fluorescent dyes are generated via parallel particle production, and their relative fluorescence values are quantified. Six concentrations of each of the dyes (coumarin, rhodamine and cyanine) were co-encapsulated in PLGA particles providing 216 unique formulations. A.) Average relative fluorescence intensity of encapsulated dyes and standard deviation for each formulation was quantified by fluorescence plate reader and plotted by formulation number. Magnified regions illustrate control over loading of co-encapsulates: B.) Formulations #55 through #100, and C.) Formulations #127 through #145. Overlay lines emphasize the trends of different concentration of the dyes: blue line - coumarin (----); green line - rhodamine (----); red line - cyanine (----). Individual formulations #59, #73 and #86 (boxes in B.), were further analyzed by flow cytometry analysis (see Figure 4).

