Abstract
Background
Regression is an important process in normal development of many organs. In the present study, we investigated whether glomerular regression occurs after normal glomerulogenesis and determined the time course for this process.
Methods
Glomerular number was analyzed in normal mouse kidneys at postnatal day (P) 7, 10, 14, 18, 21, 25 and 28 by the gold-standard fractionator/dissector method, which involves exhausting the kidney tissue. Vascular regression markers, angiopoietin 2 (ANGPT2) and thrombospondin 1 (THBS1), were examined by immunohistochemistry.
Results
The maximum glomerular number was reached at P7 with 14,051 glomeruli per kidney (95% CI: 12,084-16,018). This peak was followed by a progressive reduction with a nadir of 11,060 (10,393-11,727) occurring at P18 (p<0.05 compared with P7). Thereafter, glomerular number remained constant. Complementary immunohistochemical examination of vascular regression markers showed peak expression of glomerular ANGPT2 and THBS1 at P14.
Conclusions
Our study reveals that the tissue- and time-saving Weibel-Gomez method commonly used to assess glomerular number is only valid after P18. The data indicate that regulation of glomerular number by regression occurs in normally maturing mouse kidneys. These findings suggest that the process of glomerular regression could be therapeutically targeted to prevent oligonephronia, which otherwise predisposes to chronic kidney disease.
Introduction
During organ development, complete regression of a particular structure often accompanies the appearance and growth of others 1. In kidney development, the pronephros and mesonephros appear and then regress prior to structural development of the metanephros, which develops into the mature kidney 2. Formation followed by partial regression also occurs during normal development 3. Decreased number of nephrons in development in utero has been linked to a variety of diseases 4-6, a situation that may be compensated by interventions during postnatal maturation 7-10. During our pilot investigation of developing mouse kidneys, we unexpectedly observed that the number of glomeruli decreased shortly after birth in mice. We hypothesized that regulatory regression of excess glomerular vasculature is a mechanism to maintain glomerular number homeostasis. In the present study, we investigated whether regression occurs after normal glomerulogenesis.
Kidney development in postnatal mice parallels late embryonic stage development in humans, when most glomeruli are already established. Thus, the postnatal maturational process up to age of 4 weeks in mice is considered a model for human embryonic kidney development. To reproducibly assess glomerular number in postnatal mice, we used an unbiased stereological counting method of physical fractionator sampling with dissector counting (fractionator/dissector method) 11, 12. Further, we examined the applicability of the Weibel-Gomez method for estimating glomerular number, which has been commonly used in mature kidneys 13.
Results
Identification of glomeruli in postnatal mouse kidneys for counting
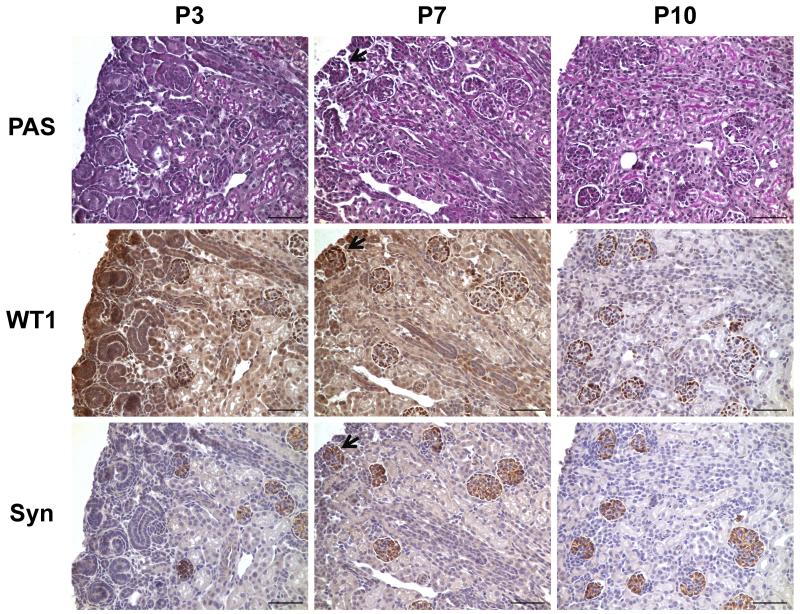
Since only the typical comma- or S-shaped glomeruli are recognizable at early stages of glomerular development, we used podocyte differentiation markers to facilitate identification of glomeruli. In postnatal day (P) kidneys, positive WT1 signals were not located exclusively in glomeruli, and the superficial developing glomeruli were not easily distinguished by synaptopodin and PAS staining (Figure 1). Moreover, outlines of possible glomeruli were insufficiently distinct for determination of glomerular area required by the Weibel-Gomez method. By contrast, synaptopodin staining easily identified glomeruli at P7. Kidneys of mice older than P10 had glomeruli that were easily recognized by PAS staining. Therefore, only kidneys from mice older than P7, having clearly identifiable glomeruli, were studied for glomerular number by Weibel-Gomez and fractionator/dissector methods.
Figure 1. Identification of glomeruli in postnatal mouse kidneys.
Adjacent sections were stained for PAS, WT1, and synaptopodin. At P3, superficial glomeruli could not be identified exclusively by the three stainings; however, they were distinguishable by synaptopodin at P7. All glomeruli could be easily recognized by PAS since P10. Black arrow (bottom middle panel) indicates a glomerulus that can be identified by synaptopodin and WT1 staining, but not by PAS. Scale bar = 50 μm. PAS, periodic acid-Schiff. WT1, Wilms tumor 1. Syn, synaptopodin. P3, postnatal day 3; P7, postnatal day 7; P10, postnatal day 10.
Assessment of glomerular number by Weibel-Gomez method
We first examined variability in the glomerular number between the left and the right kidney within the same mouse by the Weibel-Gomez method 13, 14. Kidneys from 3-5 C57BL6/J mice were examined at each time point from P7 to P28. There were no significant differences between the left and right kidneys at any of the time points, and the number of glomeruli in the left kidney correlated significantly with the right kidney (R2 = 0.320, p<0.001). Thus, we used the glomerular count in the right kidney obtained by the Weibel-Gomez method to compare with the glomerular number attained by the fractionator/dissector method from the left kidney.
Inter-examiner variability was checked by random sampling of one kidney at each time point from P7 to P28. The correlation at the 7 time points was significant for both the mean glomerular area (R2 = 0.949, P<0.001) and the glomerular number (R2 = p<0.05). We evaluated the necessity to examine all glomeruli on a section for acquisition of the mean glomerular area (). For this purpose, the from randomly selected 25% or 50% of total glomeruli was compared with the from all glomeruli on the section. Correlation analyses showed R2 = 0.968 for the fraction of 25% and R2 = 0.942 when 50% of glomeruli were assessed, both p<0.001. Thus, on a center transverse section of a mouse kidney, sampling 40 randomly selected glomeruli or glomeruli from continuous fields that include both superficial and deep glomeruli is sufficient to attain consistent values for glomerular number by the Weibel-Gomez method.
Kidney density, shrinkage coefficient and glomerular size distribution coefficient in postnatal mouse kidneys
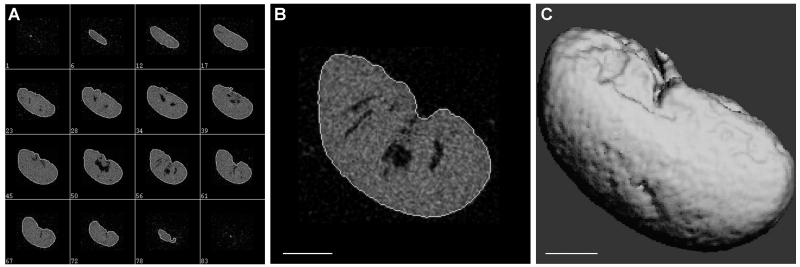
We initially used coefficients of kidney density (1.04 g/cm3) and shrinkage (1.08) established and commonly used for adult rats 14. However, these coefficients yielded much higher number of glomeruli than those measured by the fractionator/dissector method at all time points measured. In order to determine a more appropriate value for coefficients applied in the Weibel-Gomez formula to assess mouse kidneys, kidney volume at harvest and after fixation and processing need to be accurately defined. We used μCT scanning and 3D image reconstruction technology to obtain the volume of the mouse kidney (Figure 2). Our results revealed that the overall shrinkage of a mouse kidney was much higher than values reported in rats. The kidney density and shrinkage fraction in developing mouse kidneys from P7 to P14 are significantly higher than kidneys after P18. After P18, the density and shrinkage coefficient became stable, at 0.968 (0.913-1.023) g/cm3 for kidney density, and 1.395 (1.373-1.416) for shrinkage (Table 1). In order to simplify the equation used for the Weibel-Gomez method, we introduced an adjusting coefficient, f, which is the weight of a freshly harvested kidney divided by the kidney volume after fixation and processing (detailed in Materials and Methods). For normal kidneys after P18, we found an average f of 2.62.
Figure 2. Representative μCT images for a mouse kidney.
(A) Scanning images from adjacent layers showed clear separation of the tissue from the peripheral, and the semi-automatic contouring distinctly outlined the kidney sample. The numbers in the subpanels indicate the serial numbers of sample slices. (B) A representative zoomed in picture for contouring. (C) 3D reconstruction of the kidney image from the scanned layers used for the computation of the total kidney volume. Scale bar = 1 mm.
Table 1. Coefficients developed for glomerular counting by Weibel-Gomez formula in developing mice.
| Time | Kidney density | Shrinkage coefficient | Size distribution coefficient | |||
|---|---|---|---|---|---|---|
|
| ||||||
| ρ (g/cm3) | N | δ | N | k | N | |
| P7 | 1.377 (1.133-1.620) | 4 | 1.712 (1.700-1.723) | 4 | 1.108 (1.081-1.134) | 7 |
| P10 | 1.339 (1.177-1.502) | 4 | 1.554 (1.508-1.600) | 4 | 1.112 (1.094-1.129) | 8 |
| P14 | 1.248 (1.102-1.395) | 4 | 1.524 (1.493-1.554) | 4 | 1.110 (1.100-1.119) | 10 |
| P18 | 0.968 (0.850-1.087) | 4 | 1.420 (1.368-1.473) | 4 | 1.114 (1.102-1.125) | 8 |
| P21 | 1.010 (0.839-1.181) | 4 | 1.362 (1.315-1.410) | 4 | 1.114 (1.104-1.123) | 10 |
| P25 | 1.030 (0.856-1.205) | 4 | 1.362 (1.326-1.398) | 4 | 1.113 (1.099-1.127) | 8 |
| P28 | 0.864 (0.796-0.932) | 4 | 1.433 (1.405-1.462) | 4 | 1.095 (1.084-1.106) | 12 |
| Adult | 0.950 (0.804-1.097) | 4 | 1.399 (1.325-1.472) | 4 | 1.094 (1.071-1.117) | 8 |
Data are presented as mean (95% confidence interval). P: postnatal day.
A remarkable difference in glomerular maturity and size characterizes the superficial and deep glomeruli in postnatal mouse kidneys. However, we found that the glomerular size distribution coefficient k 15, 16, computed from the measured diameter profiles of sectioned glomeruli, was relatively constant in mice of different age, and was comparable to that reported in studies with adult rat kidneys 14 and human kidney samples 16.
Comparison of glomerular numbers estimated by Weibel-Gomez and measured by fractionator/dissector method
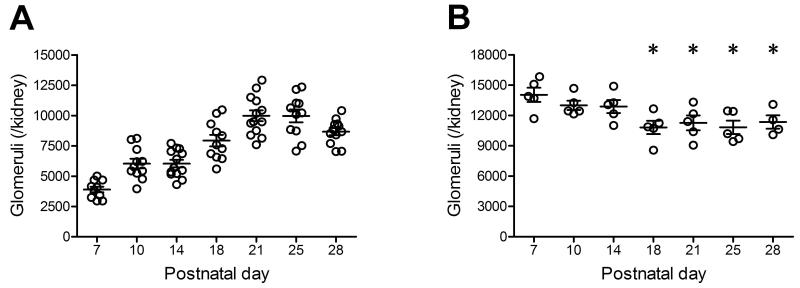
Using the exhaustive fractionator/dissector method, we found that the glomerular number was maximal at P7. This was followed by a reduction in glomeruli until P18. The differences in the number of glomeruli at P18, P21, P25 and P28 compared to P7 were all statistically significant (Table 2, Figure 3).
Table 2. Glomerular number determined by Weibel-Gomez method and exhaustive fractionator/disector method in developing mice.
| Time | Weibel-Gomez method | Fractionator/disector method | ||
|---|---|---|---|---|
|
| ||||
| No. of glomeruli (per kidney) |
N | No. of glomeruli (per kidney) |
N | |
| P7 | 3900 (3367-4432) | 10 | 14051 (12084-16018) | 5 |
| P10 | 6033 (5156-6910) | 11 | 13006 (11733-14279) | 5 |
| P14 | 6035 (5360-6709) | 13 | 12888 (11104-14672) | 5 |
| P18 | 7931 (6862-9000) | 11 | 10825 (8998-12653) * | 5 |
| P21 | 9980 (8994-10966) | 13 | 11275 (9246-13304) * | 5 |
| P25 | 9966 (8797-11138) | 11 | 10840 (8999-12682) * | 5 |
| P28 | 8672 (8023-9322) | 12 | 11359 (9266-13453) * | 4 |
| Adult | 10414 (9474-11355) | 16 | Not done | |
Data are presented as mean (95% confidence interval).
p<0.05 compared with P7. P: postnatal day.
Figure 3. Glomerular number determined by the Weibel-Gomez method (A) and the exhaustive fractionator/dissector method (B) in normal developing mice.
While the Weibel-Gomez method yielded continuous increase in glomerular number in postnatal mice, the fractionator/dissector method revealed significant decreases after day 14. Data are presented as mean±SEM. * p<0.05 compared with postnatal day 7.
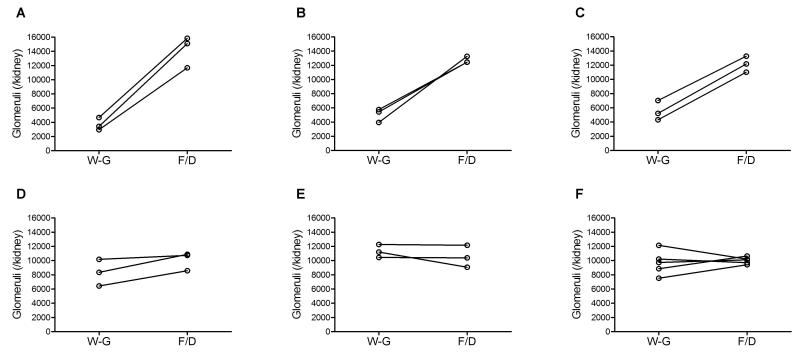
Using the new density and shrinkage coefficients determined in the current study, we found that the glomerular number estimated by Weibel-Gomez method was comparable to the number attained by the fractionator/dissector method after P18. However, the Weibel-Gomez method yielded much lower number than the fractionator/dissector method before P18 (Table 2, Figure 4).
Figure 4. Paired comparison of the glomerular number assessed by the Weibel-Gomez method and the fractionator/dissector method within the same mouse.
In developing mouse kidneys, the glomerular number counted by Weibel-Gomez method was significantly lower than that by the fractionator/dissector method at postnatal days 7, 10, and 14 (all p<0.05), but similar after postnatal day 18. Postnatal days 7 (A), 10 (B), 14 (C), 18 (D), 21 (E), and 25-28 (F). W-G, by the Weibel-Gomez method; F/D, by the fractionator/disector method.
Glomerular regression in postnatal mouse kidneys
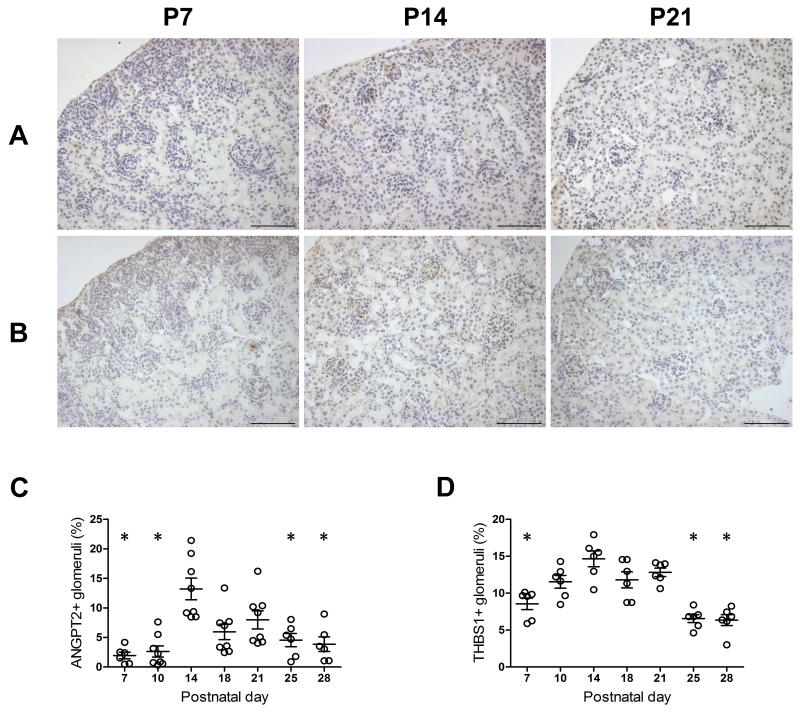
To examine potential mechanisms for the decrease in glomerular number after P7, we assessed factors involved in vascular regression, ANGPT2 17, 18 and THBS1 19, 20. ANGPT2 and THBS1 immunostaining was present in glomeruli, proximal tubules and the interstitium in postnatal mouse kidneys (Figure 5). In glomeruli, ANGPT2- or THBS1-positive cells included podocytes, endothelial cells, mesangial area cells and likely pericytes. Both superficial and deep glomeruli express ANGPT2 and THBS1, with more prominent expression observed in the superficial cortex. Glomerular expression of ANGPT2 peaked at P14, and was significantly higher than at P7, P10, P25 and P28. Mice also had peak expression of THBS1 at P14, which was significantly greater than at P7, P25 and P28 (Figure 5). The surge of ANGPT2 and THBS1 expression suggests a normal regulatory control for glomerular growth and regression of excessive glomerular capillaries during the late maturation period after completion of glomerulogenesis.
Figure 5. Glomerular expression of angiopoietin 2 and thrombospondin 1 in normal developing mouse kidneys.
In glomeruli, angiopoietin 2 (A) and thrombospondin 1 (B) expressed in podocytes, endothelial cells, mesangial cells, and assumptive pericytes. The number of angiopoietin 2- or thrombospondin 1-positive glomeruli peaked at postnatal day 14, which was significantly greater than most of other studied time points (C, D). Data are presented as mean±SEM. * p<0.05 compared with postnatal day 14. Scale bar = 20 μm. P7, postnatal day 7; P14, postnatal day 14; P21, postnatal day 21. ANGPT2, angiopoietin 2. THBS1, thrombospondin 1.
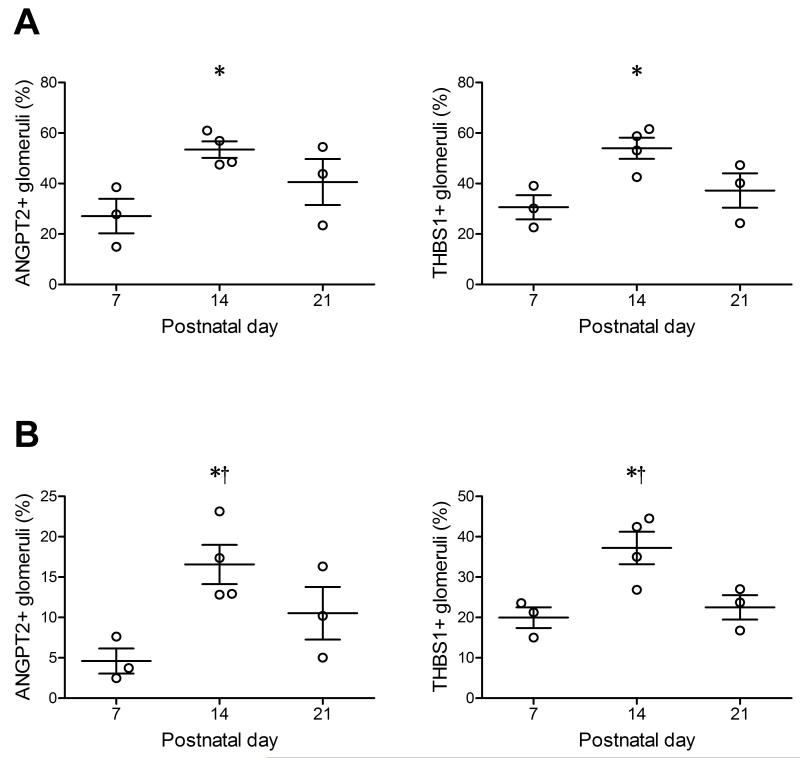
To further validate the findings of dynamic changes in these regression markers across different mouse strains, additional kidney samples from BALB/c and 129SvJ mice were examined by immunohistochemistry at P7, P14 and P21, respectively. Significant up-regulations of ANGPT2 and THBS1 occurred at P14 in both BALB/c and 129SvJ mice (Figure 6), resembling the findings in the C57BL6/J mice.
Figure 6. Glomerular expression of angiopoietin 2 and thrombospondin 1 in normal developing BALB/c (A) and 129/SvJ (B) mice.
Data are presented as mean±SEM. * p<0.05 compared with postnatal day 7. † p<0.05 compared with postnatal day 21. ANGPT2, angiopoietin 2. THBS1, thrombospondin 1.
Discussion
Using the fractionator/dissector counting method, the current study shows maximal glomerular number occurs at P7 and is followed by a reduction of some 20% until P18 in normal developing mice. These changes are complemented by an up-regulated expression of vascular regression markers, ANGPT2 and THBS1, which increase and peak in maturing glomeruli at P14. Our study validates the use of Weibel-Gomez method after P18 to estimate total glomerular number in a normal mouse kidney, with justification of the coefficients, but narrows its application in immature kidneys.
Several methodologies have been used to study glomerular number including fractionator/dissector method, the Weibel-Gomez equation and dissociation method 21. Recent technological advances have yielded congenital abnormal kidneys regarding size and nephron number, which require accurate, reproducible and practical approach to determine the glomerular number at developmental stages. The fractionator/dissector method is an unbiased method for counting the glomerular number in kidney at any stage of development 11, 12. However, this gold-standard methodology requires exhausting the tissue. This method is also time consuming and labor intensive. The dissociation method also involves exhausting the tissue and has the limitation of being highly variable 21. The Weibel-Gomez method was developed in the early 60s, and has been employed to estimate the nephron number in the whole kidney presumably from a representative 2D section of the kidney 13. However, values of coefficients used in the Weibel-Gomez formula have not been validated in mouse kidneys. Further, these coefficients have not been validated in immature kidneys of mice or even rats. We showed that kidney density and shrinkage fraction, variables that determine coefficients in the Weibel-Gomez formula, become constant only after P18. Despite the high reproducibility of Weibel-Gomez method between examiners as well as between two kidneys within the same animal, our results indicate that the Weibel-Gomez method underestimates glomerular number in the immature kidney. We find this method to be unsuitable to assess the glomerular population in normal mice before P18. This undercounting is primarily due to the significantly smaller size of the immature superficial glomeruli that leads to a selection bias. The findings suggest caution is needed in using certain morphometric methods which are based on measurements obtained from a single section for profiling immature tissue, e.g. calculating density of a structure for comparison of normal versus diseased kidneys. These limitations impact studies aiming to extrapolate from observed developmental abnormalities to predict future disease.
Glomerulogenesis has been reported to end by postnatal day 3 in mice 22, while a recent study on developing rat kidneys showed continued increase in glomerular number until P8 12. Although it is not known how ureteral obstruction affects glomerular development, rats with unilateral ureteral obstruction at P1 or P14 released 5 days later, showed similar degrees of reduction in nephron number in adulthood 23. Other studies in neonatal rats with uninephrectomy showed different capability of glomerular growth in the remaining kidney depending on the time of surgery 7, 24. In this study, we aimed to define the time for possible compensation and/or intervention to achieve a normal complement of glomeruli. The results obtained from the fractionator/dissector method are not affected by the distribution of glomeruli in the kidney, shape, volume, or deformation resulting from tissue processing. The glomerular number assessed by this gold standard method indicates the peak for glomerular number occurs at P7. This observation is consistent with previous findings in rats 7, 12, a species with similar developmental timing as mice. Future study will be needed to delineate the biological importance of this dynamic change in glomerular number during maturation under pathophysiological conditions.
Reduction of glomerular number is complemented by increased expression of glomerular angiopoietin 2 and thrombospondin 1, two well-known natural inhibitors of angiogenesis. ANGPT2 antagonizes vasculogenesis and angiogenesis effects of vascular endothelial growth factor and angiopoietin 1, promoting vessel regression or degeneration 17, 18. In developing glomeruli, up-regulated ANGPT2 has been found on podocytes, endothelial cells and mesangial cells 25, 26. The mRNA expression of ANGPT2 in developing mouse kidney peaked at postnatal week 2 27. In adult animal models with ANGPT2 overexpression in podocytes, glomerulonephritis as well as diabetic nephropathy, increased ANGPT2 is associated with proteinuria, loss of glomerular capillaries, and glomerulosclerosis 17, 28. THBS1 is another endogenous potent inhibitor of angiogenesis as well as a pro-apoptotic factor 19. THBS1 mimetic peptides have been shown to regress established malignancy by inducing apoptosis in immature endothelial cells 20. Glomerular and renal tubulointerstitial expression of THBS1 has also been reported in developing kidneys and diseased kidneys 29, 30. In retina of P28 mice, newly formed vessels regressed in the wild-type, while vascular density was increased in mice with THBS1 deficiency 31. In line with these observations, our findings that ANGPT2 and THBS1 are significantly up-regulated at postnatal day 14 and preferentially in superficial immature glomeruli suggest a maturational control for excessive glomerular vasculature and a physiological response to functional changes of these glomeruli at that developmental stage. In addition, the increase in ANGPT2 and THBS1 at postnatal day 14 was also detected in other normal mouse strains, namely, BALB/c and 129/SvJ mice.
In summary, our study shows the peak in glomerular number occurs at P7 in mice, which is followed by about 20% reduction in the complete maturational number of nephrons. These changes are accompanied by a peak expression of vascular regression markers, ANGPT2 and THBS1, in glomeruli at P14. These results suggest the time before P14 is a window for adjustment of nephron number in normal glomerular development. We also demonstrate that the coefficients in the widely used Weibel-Gomez formula for counting glomerular number should be adjusted for developmental stage.
Materials and Methods
Animals
Male and female C57BL/6 mice (Jackson Laboratory, Bar Harbor, Maine, USA) were studied, unless specified. Developing mouse kidneys were collected at postnatal day (P) 7, 10, 14, 18, 21, 25 and 28. Kidneys from mice at age 12 to 18 weeks served as mature controls. Inbred BALB/c (originally from Harlan Laboratories, Prattville, Alabama, USA) and 129/SvJ mice (originally from Jackson Laboratory) at P7, P14 and P21 were also used to study expression of vascular regression markers in the kidney. All animals were housed in controlled conditions in animal housing facilities certified by Association for Assessment and Accreditation of Laboratory Animal Care (AAALAC), and fed standard chow and water ad lib, with pups nursed by their mothers until weaning age. Animal protocols were approved by the Vanderbilt University Institutional Animal Care and Use Committee (IACUC).
Tissue preparation
The left and right kidneys were weighed. A central transverse section of the kidney was used for evaluation of glomerular number by the Weibel-Gomez method, while the whole kidney was used in the fractionator/dissector method. Kidney samples were fixed overnight in 4% paraformaldehyde in phosphate buffered saline (PBS) and kept in 70% ethanol until further processing (Excelsior ES Tissue Processor, Thermo, Waltham, MA) where samples were dehydrated through 6 changes of graded ethanol, cleared in xylene, infiltrated and embedded in paraffin.
Assessment of kidney density and tissue shrinkage by micro-computed tomography scan (μCT)
To estimate kidney density and shrinkage during tissue preparation, μCT scan was used to determine the volume of freshly harvested kidney (Vo) and volume after fixation and processing (Vp). The tomographic images were acquired in a μCT40 (Scanco Medical AG, Switzerland) with an isotropic voxel size of 36 μm, at 45 kV, 177 μA, 250 projections per 180° turn, and 150 ms integration time. Using the manufacturer’s software, the outer edge of the kidney in each slice image was contoured using a semi-automated threshold detection process. The total volume of the kidney was calculated creating a Z-stack of 2D contours and directly converting the total number of voxels in the 3D reconstruction to total volume. The kidney density (ρ) was calculated as dividing the weight by volume of the fresh tissue. The shrinkage coefficient (δ) was calculated as the cube root of the fraction of the volume, i.e., .
Counting glomeruli by Weibel-Gomez method
The center kidney piece sectioned at 3 μm was stained with periodic acid-Schiff (PAS). Calculation of total number of glomeruli (Nglom) used the following equation developed by Weibel and Gomez 13, 14:
| (equation 1) |
where N is the number of glomeruli that can be counted on the tissue section, Wkidney is the weight of the freshly harvested kidney, ΣAglom is the total area of all glomeruli and Akidney is the area of the kidney measured from the section, k is a size distribution coefficient, β is a shape constant which equals to for sphere 15, δ is the tissue shrinkage coefficient, and ρ is the density of the fresh kidney. The above equation can also be expressed as:
| (equation 2) |
where is the average glomerular area.
Since equals to Vp, the byproduct of δ3 and ρ can be substituted by a simplified new coefficient f, which requires only one-time μCT imaging for Vp. Thus, the Weibel-Gomez formula can also be expressed as:
| (equation 3) |
where f is an adjusting coefficient that can be determined as , and customized for each individual laboratory.
ImageJ was used to measure the areas on PAS-stained sections. Glomerular area was measured by tracing the inner boundary of Bowman’s space, and the kidney area by tracing the outline of the section of kidney tissue including the renal papilla. The diameter (⊘) of each glomerulus measured was calculated from the glomerular area on the section (), and the average ⊘ () and average ⊘3 () were computed. The size distribution coefficient k for each kidney was then calculated as: 15, 16. The number of glomeruli was examined by two trained investigators.
Counting glomeruli by the fractionator/dissector method
Each kidney was exhaustively cut into 5-μm-thick sections. Every 20th section and its adjacent section were sampled as a pair, with the first pair being chosen at random, providing a sampling fraction of 1/20. A total of 17-23 section pairs were acquired for each kidney and stained with PAS. A light microscope (Nikon ECLIPSE E400) equipped with a digital camera (Zeiss AxioCam, Oberkochen, Germany) was used to capture the images, on which a grid serving as a physical dissector was mounted to facilitate survey of all fields. Within the sample pair, a glomerulus was counted if it appeared in a sample field but was not present in the adjacent section (rule of appear-disappearance). Glomeruli present in the adjacent section but not present in the first section were then also counted. Thus, the total number of glomeruli in a kidney is the sum of counted glomerular number from each sample pair multiplied by 20.11, 15
Immunohistochemistry
3-μm sections were stained with Vectastain ABC kits (Vector Laboratories, Burlingame, CA) for rabbit for WT1, synaptopodin, angiopoietin 2 (ANGPT2) and thrombospondin 1 (THBS1). Briefly, sections were heated in 0.01 M sodium citrate buffer (pH 6.0) and endogenous peroxidase quenched with fresh 0.3% hydrogen peroxidase/methanol for 5 min. After blocking, sections were incubated with rabbit anti-WT1 (Santa Cruz, Santa Cruz, CA), mouse anti-synaptopodin (Progen, Heidelberg, Germany), mouse anti-ANGPT2 (Santa Cruz), or mouse anti-THBS1 (Santa Cruz) in a humidified chamber at 4 °C overnight, followed by incubation with a biotin-conjugated secondary antibody, and avidin-biotin-peroxidase complex. Positive signals were developed in brown by diaminobenzidine (DAB) with hematoxylin as a counterstain. Glomeruli positive for ANGPT2 or THBS1 were counted under 40× objective lens and the percentage calculated.
Statistical analysis
Results are presented as mean (95% CI of the mean). One-way ANOVA and non-parametric Kruskal-Wallis test followed by posthoc Tukey’s and Dunn’s multiple comparison tests were used to test the differences among the different time points. Correlation analysis was performed by Pearson and Spearman tests. Wilcoxon rank test and paired-t tests were used to compare the data obtained by the two different methods. p value <0.05 was considered to be significant.
Acknowledgments
Statement of financial support: This study was supported by the American Heart Association (grant 09BGIA2261364) and National Institute of Diabetes & Digestive & Kidney Diseases, National Institutes of Health (grants DK037868 and DK044757).
References
- 1.Zhang H, Hu X, Tse J, Tilahun F, Qiu M, Chen L. Spontaneous lymphatic vessel formation and regression in the murine cornea. Invest Ophthalmol Vis Sci. 2011;52:334–8. doi: 10.1167/iovs.10-5404. [DOI] [PMC free article] [PubMed] [Google Scholar]
- 2.Davidson AJ. Mouse kidney development. 2008 http://www.ncbi.nlm.nih.gov/pubmed/20614633. [PubMed]
- 3.Saint-Geniez M, D’Amore PA. Development and pathology of the hyaloid, choroidal and retinal vasculature. Int J Dev Biol. 2004;48:1045–58. doi: 10.1387/ijdb.041895ms. [DOI] [PubMed] [Google Scholar]
- 4.Keller G, Zimmer G, Mall G, Ritz E, Amann K. Nephron number in patients with primary hypertension. N Engl J Med. 2003;348:101–8. doi: 10.1056/NEJMoa020549. [DOI] [PubMed] [Google Scholar]
- 5.Zandi-Nejad K, Luyckx VA, Brenner BM. Adult hypertension and kidney disease: the role of fetal programming. Hypertension. 2006;47:502–8. doi: 10.1161/01.HYP.0000198544.09909.1a. [DOI] [PubMed] [Google Scholar]
- 6.Bertram JF, Douglas-Denton RN, Diouf B, Hughson MD, Hoy WE. Human nephron number: implications for health and disease. Pediatr Nephrol. 2011;26:1529–33. doi: 10.1007/s00467-011-1843-8. [DOI] [PubMed] [Google Scholar]
- 7.Larsson L, Aperia A, Wilton P. Effect of normal development on compensatory renal growth. Kidney Int. 1980;18:29–35. doi: 10.1038/ki.1980.107. [DOI] [PubMed] [Google Scholar]
- 8.Tomat AL, Inserra F, Veiras L, et al. Moderate zinc restriction during fetal and postnatal growth of rats: effects on adult arterial blood pressure and kidney. Am J Physiol Regul Integr Comp Physiol. 2008;295:R543–9. doi: 10.1152/ajpregu.00050.2008. [DOI] [PubMed] [Google Scholar]
- 9.Wlodek ME, Mibus A, Tan A, Siebel AL, Owens JA, Moritz KM. Normal lactational environment restores nephron endowment and prevents hypertension after placental restriction in the rat. J Am Soc Nephrol. 2007;18:1688–96. doi: 10.1681/ASN.2007010015. [DOI] [PubMed] [Google Scholar]
- 10.Schreuder MF, Nyengaard JR, Remmers F, van Wijk JA, Delemarre-van de Waal HA. Postnatal food restriction in the rat as a model for a low nephron endowment. Am J Physiol Renal Physiol. 2006;291:F1104–7. doi: 10.1152/ajprenal.00158.2006. [DOI] [PubMed] [Google Scholar]
- 11.Nyengaard JR. Stereologic methods and their application in kidney research. J Am Soc Nephrol. 1999;10:1100–23. doi: 10.1681/ASN.V1051100. [DOI] [PubMed] [Google Scholar]
- 12.Cullen-McEwen LA, Armitage JA, Nyengaard JR, Moritz KM, Bertram JF. A design-based method for estimating glomerular number in the developing kidney. Am J Physiol Renal Physiol. 2011;300:F1448–53. doi: 10.1152/ajprenal.00055.2011. [DOI] [PubMed] [Google Scholar]
- 13.Weibel ER, Gomez DM. A principle for counting tissue structures on random sections. J Appl Physiol. 1962;17:343–8. doi: 10.1152/jappl.1962.17.2.343. [DOI] [PubMed] [Google Scholar]
- 14.Adamczak M, Gross ML, Amann K, Ritz E. Reversal of glomerular lesions involves coordinated restructuring of glomerular microvasculature. J Am Soc Nephrol. 2004;15:3063–72. doi: 10.1097/01.ASN.0000146121.72699.86. [DOI] [PubMed] [Google Scholar]
- 15.Weibel ER. Numerical density: shape and size of particles. In: Weibel ER, editor. Stereological Methods (Vol 2) Theoretical Foundations. Academic Press; London: 1980. pp. 140–74. [Google Scholar]
- 16.Samuel T, Hoy WE, Douglas-Denton R, Hughson MD, Bertram JF. Applicability of the glomerular size distribution coefficient in assessing human glomerular volume: the Weibel and Gomez method revisited. J Anat. 2007;210:578–82. doi: 10.1111/j.1469-7580.2007.00715.x. [DOI] [PMC free article] [PubMed] [Google Scholar]
- 17.Woolf AS. Angiopoietins: vascular growth factors looking for roles in glomeruli. Curr Opin Nephrol Hypertens. 2011;19:20–5. doi: 10.1097/MNH.0b013e328333025e. [DOI] [PubMed] [Google Scholar]
- 18.Augustin HG, Koh GY, Thurston G, Alitalo K. Control of vascular morphogenesis and homeostasis through the angiopoietin-Tie system. Nat Rev Mol Cell Biol. 2009;10:165–77. doi: 10.1038/nrm2639. [DOI] [PubMed] [Google Scholar]
- 19.Mirochnik Y, Kwiatek A, Volpert OV. Thrombospondin and apoptosis: molecular mechanisms and use for design of complementation treatments. Curr Drug Targets. 2008;9:851–62. doi: 10.2174/138945008785909347. [DOI] [PMC free article] [PubMed] [Google Scholar]
- 20.Campbell N, Greenaway J, Henkin J, Petrik J. ABT-898 induces tumor regression and prolongs survival in a mouse model of epithelial ovarian cancer. Mol Cancer Ther. 2011;10:1876–85. doi: 10.1158/1535-7163.MCT-11-0402. [DOI] [PubMed] [Google Scholar]
- 21.Solomon S. Developmental changes in nephron number, proximal tubular length and superficial nephron glomerular filtration rate of rats. J Physiol. 1977;272:573–89. doi: 10.1113/jphysiol.1977.sp012061. [DOI] [PMC free article] [PubMed] [Google Scholar]
- 22.Hartman HA, Lai HL, Patterson LT. Cessation of renal morphogenesis in mice. Dev Biol. 2007;310:379–87. doi: 10.1016/j.ydbio.2007.08.021. [DOI] [PMC free article] [PubMed] [Google Scholar]
- 23.Chevalier RL, Thornhill BA, Chang AY, Cachat F, Lackey A. Recovery from release of ureteral obstruction in the rat: relationship to nephrogenesis. Kidney Int. 2002;61:2033–43. doi: 10.1046/j.1523-1755.2002.00359.x. [DOI] [PubMed] [Google Scholar]
- 24.Nyengaard JR. Number and dimensions of rat glomerular capillaries in normal development and after nephrectomy. Kidney Int. 1993;43:1049–57. doi: 10.1038/ki.1993.147. [DOI] [PubMed] [Google Scholar]
- 25.De Spiegelaere W, Cornillie P, Simoens P, Van den Broeck W. Immunohistochemical detection of the angiopoietins during porcine metanephric kidney development. Acta Histochem. 2011;113:585–90. doi: 10.1016/j.acthis.2010.05.001. [DOI] [PubMed] [Google Scholar]
- 26.Yuan HT, Suri C, Landon DN, Yancopoulos GD, Woolf AS. Angiopoietin-2 is a site-specific factor in differentiation of mouse renal vasculature. J Am Soc Nephrol. 2000;11:1055–66. doi: 10.1681/ASN.V1161055. [DOI] [PubMed] [Google Scholar]
- 27.Yuan HT, Suri C, Yancopoulos GD, Woolf AS. Expression of angiopoietin-1, angiopoietin-2, and the Tie-2 receptor tyrosine kinase during mouse kidney maturation. J Am Soc Nephrol. 1999;10:1722–36. doi: 10.1681/ASN.V1081722. [DOI] [PubMed] [Google Scholar]
- 28.Davis B, Dei Cas A, Long DA, et al. Podocyte-specific expression of angiopoietin-2 causes proteinuria and apoptosis of glomerular endothelia. J Am Soc Nephrol. 2007;18:2320–9. doi: 10.1681/ASN.2006101093. [DOI] [PubMed] [Google Scholar]
- 29.Iruela-Arispe ML, Liska DJ, Sage EH, Bornstein P. Differential expression of thrombospondin 1, 2, and 3 during murine development. Dev Dyn. 1993;197:40–56. doi: 10.1002/aja.1001970105. [DOI] [PubMed] [Google Scholar]
- 30.Hugo C, Daniel C. Thrombospondin in renal disease. Nephron Exp Nephrol. 2009;111:e61–6. doi: 10.1159/000198235. [DOI] [PubMed] [Google Scholar]
- 31.Wang S, Wu Z, Sorenson CM, Lawler J, Sheibani N. Thrombospondin-1-deficient mice exhibit increased vascular density during retinal vascular development and are less sensitive to hyperoxia-mediated vessel obliteration. Dev Dyn. 2003;228:630–42. doi: 10.1002/dvdy.10412. [DOI] [PubMed] [Google Scholar]


