

Background: Glutaredoxin-2 (Grx2) modulates reversible glutathionylation of mitochondrial proteins.
Results: Grx2 glutathionylates and inhibits UCP3-mediated proton leak.
Conclusion: Grx2 modulates UCP3 activity.
Significance: Grx2 is required to control proton leak through UCP3 and mitochondrial metabolism.
Keywords: Glutathionylation, Mitochondria, Reactive Oxygen Species (ROS), Redox Regulation, Uncoupling Proteins, Aerobic Respiration, Glutaredoxin-2
Abstract
Glutathionylation has emerged as a key modification required for controlling protein function in response to changes in cell redox status. Recently, we showed that the glutathionylation state of uncoupling protein-3 (UCP3) modulates the leak of protons back into the mitochondrial matrix, thus controlling reactive oxygen species production. However, whether or not UCP3 glutathionylation is mediated enzymatically has remained unknown because previous work relied on the use of pharmacological agents, such as diamide, to alter the UCP3 glutathionylation state. Here, we demonstrate that glutaredoxin-2 (Grx2), a matrix oxidoreductase, is required to glutathionylate and inhibit UCP3. Analysis of bioenergetics in skeletal muscle mitochondria revealed that knock-out of Grx2 (Grx2−/−) increased proton leak in a UCP3-dependent manner. These effects were reversed using diamide, a glutathionylation catalyst. Importantly, the increased leak did not compromise coupled respiration. Knockdown of Grx2 augmented proton leak-dependent respiration in primary myotubes from wild type mice, an effect that was absent in UCP3−/− cells. These results confirm that Grx2 deactivates UCP3 by glutathionylation. To our knowledge, this is the first enzyme identified to regulate UCP3 by glutathionylation and is the first study on the role of Grx2 in the regulation of energy metabolism.
Introduction
Oxidative phosphorylation relies on the potential of various redox pairs and the establishment of a protonmotive force across the mitochondrial inner membrane (1). Aerobic ATP production is not perfectly coupled to respiration because protons are able to bypass ATP synthase and “leak” back into the matrix. Proton leaks are biologically important, playing different roles in different tissues (e.g. proton leak through uncoupling protein-1 (UCP1) is required for brown adipose thermogenesis) (2). Uncoupling proteins homologous to UCP1 (i.e. UCP2–5) have been identified in various other tissues and cell types (3, 4). However, these uncoupling proteins do not play a thermogenic role. Rather, their physiological functions may be derived from their capacity to control mitochondrial reactive oxygen species (ROS)2 production (5). For instance, UCP2, which is more ubiquitously expressed, controls glucagon and insulin release and satiety signaling by regulating cell ROS levels (6–8). Uncoupling protein-3 (UCP3), which is highly selectively expressed in skeletal muscle, promotes glucose and fat catabolism, protects from obesity and insulin resistance, and curtails oxidative stress (9–12). Thus, proton leaks through uncoupling proteins play a diverse array of physiological roles. These putative functions are associated with the regulation of ROS production by the electron transport chain.
The rate of ROS production is highly dependent on the polarity of the mitochondrial inner membrane. Thus, even a small decrease in protonmotive force can have a profound impact on ROS production (13). To this end, leak through UCP3 in skeletal muscle mitochondria could significantly decrease mitochondrial ROS emission (14). However, several mechanisms have been described for how UCP3 limits mitochondrial ROS. The prevailing hypothesis is that UCP3 controls ROS by inducing the mild leak of protons back into the mitochondrial matrix (15, 16). However, other studies have shown that UCP3 functions as a lipid hydroperoxide transporter or calcium uniporter (17, 18). Each of these mechanisms could aid in safeguarding the cell from oxidative stress, which is one irrefutable function of UCP3 (17, 19). Thus, the mechanism through which UCP3 regulates cell ROS remains enthusiastically debated. In an effort to provide further clarity on this issue, our group recently explored potential redox regulatory mechanisms involved in controlling UCP3 and UCP2 function (15). By manipulating the redox environment, we showed that covalent attachment of glutathione to UCP3 and UCP2 inhibits proton leak and that the inhibition is reversed by small increases in mitochondrial ROS (21, 22). Indeed, the short incubation of mitochondrial extracts or intact cells with the glutathionylation catalyst diamide (22–24) decreases proton leak in a UCP3- and UCP2-dependent fashion (21, 22, 25, 26). Conversely, incubation in subtoxic concentrations of ROS-producing molecules reverses this inhibition (22, 25). These changes in UCP3 glutathionylation status are rapid, indicating that this regulation is required to acutely control ROS production by mitochondria. Moreover, the ROS-mediated deglutathionylation of UCP3 does not even occur when ROS are in millimolar concentrations in vitro. However, ROS are able to deglutathionylate UCP3 in the presence of a cell environment (22). ROS-induced deglutathionylation has been shown to occur for both actin and succinate dehydrogenase (27, 28). It would appear that UCP3 is regulated in a similar fashion.
Glutathionylation is a redox-sensitive protein modification involving the formation of a disulfide bridge between glutathione and an available protein thiol (29). It is well established that glutathionylation reactions can proceed nonenzymatically, and a number of different mechanisms for protein glutathionylation (or deglutathionylation) have been proposed (30). Enzymatically catalyzed glutathionylation reactions were first described by Mannervik and Axelsson (31) who showed that a cytoplasmic thiol transferase was required to reactivate rat liver pyruvate kinase that had earlier been inactivated with glutathione disulfide. This cytoplasmic thiol transferase was later identified as glutaredoxin, an oxidoreductase that is now well documented to mediate glutathionylation reactions (32). Recent work has established that mitochondria contain glutaredoxin-2 (Grx2), a mitochondrial matrix homolog of cytosolic Grx1 that catalyzes (de)glutathionylation reactions (33). Few targets for Grx2 have been identified; however, Grx2 has been found to have both glutathionylase and deglutathionylase activities. In this study, we set out to determine whether Grx2 is required to control UCP3 function. We used the newly generated germ line Grx2 knock-out (Grx2−/−) mouse to determine whether Grx2 can modulate leak through UCP3 (34). We found that UCP3 was less glutathionylated and more active in skeletal muscle mitochondria from Grx2−/− mice. Knockdown of Grx2 in primary myotubes increased leak, an effect that was absent in myotubes from UCP3−/− mice. These experiments were performed in parallel with liver mitochondrial preparations, which lack uncoupling proteins. Collectively, our findings indicate that the matrix oxidoreductase Grx2 is required to deactivate proton leak through UCP3. These findings have important implications for an improved understanding of the regulation of proton leak reactions and the control of mitochondrial ROS emission.
MATERIALS AND METHODS
Animals
Studies involved C57BL6 wild type (WT) and Grx2 whole body knock-out (Grx2−/−) mice (on C57BL6 genetic background) and C57Bl6J WT and UCP3 whole body knock-out (UCP3−/−; on C57BLJ6 background) mice. They were fed a standard diet (44.2% carbohydrate, 6.2% fat, 18.6% crude protein; diet T.2018; Harlan, Indianapolis, IN) ad libitum. All experiments were performed according to the principles and guidelines of the Canadian Council of Animal Care, and the study was approved by the Animal Care Committee of the University of Ottawa. Mice were genotyped for the presence or absence of Grx2 and UCP3 prior to experimentation and myoblast purification. All experiments were performed on male mice between 9 and 12 weeks of age.
Indirect Calorimetry
Mice were housed individually in a customized Oxymax open circuit indirect calorimeter chambers (Columbus Instruments) and given free access to food and water. Mice were supplied with air at 0.5 liters/min, maintained at room temperature (22–23 °C), and subjected to a standard light-dark cycle (light 6:00–18:00 and dark 18:00–6:00). Mouse activity was measured by counting the number of laser beam breaks (x and y axis). All measurements were conducted over a 24-h period. Concentrations of O2 and CO2 were measured in each chamber for 60 s every 4 min with a sample line-purge time of 2 min. The respiratory exchange ratio was calculated as VCO2/VO2. Mouse activity was calculated as total number of laser beam breaks (x axis plus y axis) during both light and dark cycles.
Organ Weights and Circulating Metabolites
WT and Grx2−/− mice underwent an overnight fast and were weighed and then sacrificed the following morning. Following serum collection, the weights of gonadal white adipose tissue, interscapular brown adipose tissue (BAT), gastrocnemius muscle, heart, kidneys, and liver were determined. Serum was flash-frozen for later analysis of circulating glucose (Sigma glucose oxidase kit), free fatty acids (Biovision), and triglycerides (Biovision). All assays were conducted according to the manufacturers' instructions. Serum was also used for HPLC analysis of GSH and GSSG content. Prior to HPLC, serum was diluted 10-fold.
Mitochondrial Isolation
Skeletal muscle and liver mitochondria were isolated as described previously (11, 35). All buffers were supplemented with 10 mm pyruvate and 2 mm malate or 10 mm succinate and filtered prior to use. All steps were performed on ice or at 4 °C. For muscle mitochondria, forelimb, hindlimb, and pectoral muscle were extracted and placed immediately in basic medium (BM: 140 mm KCl, 20 mm HEPES, 5 mm MgCl2, and 1 mm EGTA, pH 7.0). Muscle was then cleaned of connective tissue and fat, weighed, and then placed in fresh BM. The muscle was minced on a Teflon board and placed in homogenization medium (BM + 1 mm ATP, 1 unit of subtilisin A, 1% w/v defatted BSA). Tissue was homogenized using a glass/Teflon Potter-Elvehjem tissue grinder and then centrifuged at 800 × g for 9 min to remove any undisrupted tissue. The supernatant was collected and centrifuged at 12,000 × g for 9 min. The pellet was resuspended in ∼1 ml of BM and incubated on ice for 5 min for myofibrillar repolymerization. Following the removal of the myofibers by centrifugation at 800 × g for 9 min, the supernatant was centrifuged again at 12,000 × g to generate a mitochondrial pellet.
Livers were washed in liver medium (LM: 70 mm sucrose, 220 mm mannitol, 1 mm EGTA, 2 mm HEPES, 1% w/v defatted BSA, pH 7.2) and then cut into small pieces. Following three more washes in LM, the pieces were minced on a Teflon plate, placed in fresh LM, and homogenized as described above. The homogenate was then centrifuged at 800 × g for 9 min to remove undisrupted tissue. The supernatant was then collected and centrifuged at 12,000 × g for 9 min, and the resulting pellet was resuspended in ∼2 ml of LM. Prior to resuspension, the inside of the centrifugation tube was wiped to remove any fat. The volume was then brought to 30 ml with LM, and the resuspended mitochondria were incubated on ice for 10 min. The suspension was then centrifuged again at 12,000 × g for 9 min, and the resulting pellet was resuspended in BSA-free LM. For all experiments, mitochondria were kept on ice no longer than 2 h. If mitochondria were not being used for activity assays or bioenergetic determinations, they were treated immediately with N-ethylmaleimide (NEM, an alkylating agent that prevents spontaneous modification of reactive cysteine residues, final concentration of 25 mm). Mitochondrial protein content was determined using the Bradford assay.
Mitochondrial Bioenergetics
Isolated mitochondria were studied in the Seahorse XF24 Extracellular Flux Analyzer (Seahorse Biosciences; North Billerica, MA) using a method adapted from Ref. 35. Mitochondria were diluted to 0.2 mg/ml in BSA-free BM or LM, and 50 μl of suspension (10 μg of mitochondria) was then loaded into Seahorse tissue culture (TC) plate wells. TC plates were centrifuged at 2000 × g for 20 min at 4 °C to attach mitochondria to the plastic. Mitochondria adhere well to the surface due to the chemical properties of the plastic (35), and mitochondria are not displaced during the experiment (35). Following the centrifugation, 350 μl of reaction buffer (LM containing 10 mm KH2PO4, 5 mm MgCl2, 0.2% w/v defatted BSA) was added to each well giving a final volume of 400 μl. Following a 10-min incubation at 37 °C, plates were loaded into the XF24 Analyzer for bioenergetic analyses. Assay conditions were optimized as recommended previously (35).
For bioenergetic determinations, the oxygen consumption rate (OCR) was first determined under state 2 conditions (presence of substrate only, 10 mm pyruvate, and 2 mm malate or 10 mm succinate). ADP (0.1 mm), oligomycin (2.5 μg/ml; ATP synthase inhibitor), FCCP (8 μm; chemical uncoupler), and antimycin A (4 μm; complex III inhibitor) were then sequentially injected to test state 3, state 4 (proton leak-dependent respiration), maximal respiration, and respiration independent of the respiratory chain, respectively. When succinate was used as a substrate, rotenone (1 μm) was included in the reaction medium to prevent reverse electron transfer and ROS genesis by complex I. To test the contribution of ANT to proton leak-dependent respiration, following measurement of state 3 respiration, mitochondria were sequentially treated with oligomycin, carboxyatractyloside (5 μm; inhibits leak through ANT (36)), and antimycin A. To determine the response of proton leak-dependent respiration to H2O2 (deglutathionylates UCP3 (22)) and diamide (glutathionylation catalyst (21)), state 3 respiration was tested followed by the addition of oligomycin, H2O2 (10 μm), diamide (10 μm), and antimycin A. For all measurements of OCR, the measurement interval was 3 min, which included a 1-min mix, and a 2-min measure. All respiration values were corrected by subtracting OCR values independent of aerobic respiration (antimycin A OCR). Note that OCR values were also corrected for background OCR using Seahorse XF24 software.
Validation of Seahorse XF24 Protocol
To validate our protocol, we compared OCR data for liver and skeletal muscle mitochondria derived from a Clark-type oxygen electrode and the above-described Seahorse method. The Clark-type oxygen electrode was a Hansatech Oxytherm unit (Hansatech; Norfolk, UK). Reaction buffer (same used in Seahorse) was warmed for 5 min in the electrode chamber followed by the addition of mitochondria (0.5 mg/ml final protein concentration). To test mitochondrial respiratory control ratio (RCR), following the establishment of state 2 respiration, mitochondria were titrated with ADP (up to 0.5 mm final concentration). For mitochondrial integrity tests, after the establishment of state 3 respiration, cytochrome c was added incrementally up to a final concentration of 10 μm. Essentially, if cytochrome c elevates respiration, this indicates that mitochondrial outer membrane integrity has been compromised during mitochondrial preparation. For all experiments, antimycin A was added as a control. Seahorse assays were conducted in the same manner. State 2 was measured; ADP was injected up to a final concentration of 0.5 mm to obtain state 3, and antimycin A (4 μm) was injected to determine nonmitochondrial respiration. To determine whether the attachment of mitochondria to TC plates compromised mitochondrial integrity, we first measured state 2, injected ADP (0.1 mm), then titrated in cytochrome c (10 μm final), and finally added antimycin A (4 μm) (supplemental Fig. S2).
Complex I Activity
Complex I activity was measured using digitonized mitochondria (37). Muscle and liver mitochondria were treated with 1% (v/v) digitonin, vortexed, and then incubated on ice for 10 min. Mitochondria were then diluted to 0.5 mg/ml in reaction buffer (70 mm sucrose, 220 mm mannitol, 1 mm EGTA, 2 mm HEPES, 10 mm KH2PO4, 5 mm MgCl2, 0.2% w/v defatted BSA, pH 7.2) containing 2 mm KCN, 1 μm antimycin A, with or without 2 mm DTT. Reactions were initiated by the addition of NADH (0.2 mm). Reactions devoid of mitochondria served as the negative control. The rate of NADH consumption was calculated from the first 30 s of the reaction (represents the time frame of fastest NADH consumption).
Mitochondrial ROS Emission
Mitochondrial ROS production kinetics were measured using dihydrodichlorofluorescein diacetate, the BioTek SynergyMX2 microplate reader (Winooski, VT), and Gen5 software as described previously (21). Mitochondria were diluted to 0.5 mg/ml in reaction buffer (70 mm sucrose, 220 mm mannitol, 1 mm EGTA, 2 mm HEPES, 10 mm KH2PO4, 5 mm MgCl2, 0.2% w/v defatted BSA, pH 7.2) containing dihydrodichlorofluorescein diacetate (20 μm) and with or without 2 mm DTT. Reactions were initiated by the addition of pyruvate (10 mm) and malate (2 mm). Following the initial measurement of ROS production over 6 min, oligomycin was added (2 μg/ml) to induce state 4 respiration. ROS production was then measured for 10 min. Reactions devoid of mitochondria served as the control. Values were corrected for background fluorescence.
Concentration of GSH and GSSG
Mitochondrial GSH and GSSG levels were determined by HPLC as described previously (21). Mitochondria were diluted to 0.5 mg/ml in 0.5% (v/v) perchloric acid solution (prepared in mobile phase) and incubated on ice for 10 min. For measurement of circulating GSH and GSSG, serum was diluted 10-fold in perchloric acid solution. Following removal of precipitate, the supernatant was collected and injected into an Agilent HPLC system equipped with a Pursuit C18 column (150 × 4.6 mm, 5 μm; Agilent Technologies) operating at a flow rate of 1 ml/min. Reduced (GSH) and oxidized (GSSG) glutathione were detected using an Agilent UV-visible variable wavelength detector set to 215 nm. Retention times were confirmed by injecting standard solutions. Absolute amounts of GSH and GSSG were determined by calculating the area under the GSH and GSSG peaks in the chromatogram for each sample. These integration values were then extrapolated from standard curves developed from injecting varying amounts of standard GSH and GSSG solutions. Integration of chromatograms and solute concentration estimates were carried out using Agilent Chemstation software. The 2GSH/GSSG and redox potential of this pair were calculated using the Nernst Equation 1 as described below (38, 39). Reduced glutathione (GSH) was squared in Equation 1 because both concentration of GSH and oxidized glutathione (GSSG) and the GSH/GSSG influence the redox potential of this pair. Mitochondrial matrix volume was assumed to be 0.75 μl (because volume varies between 0.5 and 1 μl per mg of mitochondrial protein) (40).
 |
Protein-Glutathione (PSSG) Adducts
Amount of PSSG was determined as described previously (21, 22). Mitochondria were diluted to 2 mg/ml and electrophoresed under nonreducing (no β-mercaptoethanol) on a 10% isocratic SDS gel. Upon completion, the gel slab was equilibrated in transfer buffer for 15 min, and proteins were then electroblotted onto nitrocellulose membranes (1 h, 100 V). After a 1-h incubation in blocking solution, membranes were washed twice with TBS-T (5 min per wash) and then probed overnight at 4 °C with anti-PSSG (1:500, Virogen). Blots were then washed twice with TBS-T and incubated for 1 h in anti-mouse HRP conjugate secondary antibody (1:2000, Santa Cruz Biotechnology). To ensure that the observed immunoreactivity pattern in the blots was not due to nonspecific binding of PSSG antiserum, samples were also electrophoresed under reducing conditions (2% v/v β-mercaptoethanol included in Laemmli buffer). A powerful reductant like β-mercaptoethanol will remove GSH from all glutathionylation sites. Ponceau S staining of membranes served as a loading control. The total amount of glutathionylated proteins was then quantified using ImageJ software.
BioGEE Pulldowns
Mitochondria from the liver and muscle of WT and Grx2−/− mice were diluted to 4 mg/ml in isolation medium containing 1 mm BioGEE and incubated for 1 h by gentle inversion at room temperature. Mitochondria were then diluted to 2 mg/ml in RIPA buffer containing 25 mm NEM and then incubated overnight at 4 °C in streptavidin beads to immunoprecipitate BioGEEylated proteins. Following centrifugation, the supernatant was placed in an ice-cold minitube, and beads were washed once in PBS and then incubated for 10 min at room temperature in PBS containing 4 m urea to separate pulled down proteins from beads. Protein content of each fraction was determined by a BCA assay. Presence of UCP3 was detected by immunoblot.
Immunofluorescent Staining
Gastrocnemius muscles from WT and Grx2−/− mice were excised and placed immediately in 10% formalin/acetate solution. Muscle was then sectioned (10 μm) by cryostat and mounted onto slides. The degree of UCP3 glutathionylation was visualized by dual staining muscle sections with UCP3 antibodies and antibodies directed against BioGEE. Following several washes, muscle sections were incubated in BioGEE (0.1 mm) for 1 h. Sections were then washed three times and incubated for 1 h at room temperature in Dylight 594 streptavidin antibody (1:100; Dylight 594 fluoresces red). Sections were then washed 3–5 times and incubated for 20 min in 5% (v/v) goat serum (diluted in PBS). Sections were then incubated overnight at 4 °C in anti-UCP3 antibody (1:100 in 0.3% (v/v) Triton X-100 and 5% (v/v) goat serum in PBS). Following three more washes, muscle was then incubated in goat anti-rabbit secondary antibody conjugated to Dylight 488 (1:150 in PBS; fluoresces green) for 1 h at room temperature. After 3–5 washes, slides were mounted in Vectashield fluorescent mounting medium, and coverslips were sealed on with nail polish. Control experiments were conducted with NEM or dithiothreitol (DTT). Briefly, prior to exposure to BioGEE, sections were incubated for 10 min in either 25 mm NEM or 10 mm DTT. NEM is an alkylating agent that blocks BioGEE binding providing a 0% base line reading for glutathionylation. Likewise, DTT treatment is a reductant that reverses glutathionylation, thus providing a maximum for BioGEE binding. Fluorescence was monitored using a Zeiss AxioObserver.Z1 deconvolution microscope and Axiovision 4.8 software. Images were acquired using a ×40 Plan-Apochromat objective and AxioCam MRm CCD. To eliminate image haze, between 20 and 30 slice images were taken along the z axis. Images were then deconvolved using Axiovision SF64 software and enhanced using ImageJ. Scale bar corresponds to 10 μm.
4-HNE-His Adducts
4-Hydroxy-2-nonenal-histidine (HNE-His) covalent adducts were measured using the OxiSelect ELISA kit provided by CellBio Labs (CellBio Labs, San Diego). Assays were conducted according to the manufacturer's instructions.
Metabolite Analysis
TCA cycle intermediate and ATP levels were assessed by HPLC as described previously (11). Mitochondria were diluted to 0.5 mg/ml in 0.5% v/v perchloric acid solution, incubated on ice for 10 min, and the precipitate removed by centrifugation. The resulting supernatant was injected into an Agilent HPLC system equipped with a C18 reverse phase hydrophilic HPLC column (Synergi Hydro-RP, 4 μm, 250 × 4.6 mm; Phenomenex) operating at a flow rate of 0.7 ml/min. The mobile phase consisted of 20 mm KH2PO4 dissolved in double distilled H2O, pH 2.9. TCA cycle intermediates and ATP were detected using an Agilent variable wavelength detector set to 210 and 254 nm for organic acids and nucleotides, respectively. Retention times were confirmed by injecting standard solutions. Levels of metabolites were quantified using Agilent Chemstation software.
Primary Cell Culture and Grx2 Knockdown
Primary myoblasts were isolated and cultured as described previously (22). For experiments, primary myoblasts were seeded at 50,000 cells/ml in Seahorse TC plates or 60-mm2 dishes coated with Matrigel. Upon reaching ∼90% confluency, the growth medium (DMEM containing 5 mm glucose, 4 mm glutamine, 1 mm pyruvate, 10% v/v FBS, 2.5 ng/ml basic FGF, and 1% v/v antibiotics/antimycotics) was replaced with differentiating medium (DM; DMEM containing 5 mm glucose, 4 mm glutamine, 1 mm pyruvate, 2% v/v FBS, and 1% v/v antibiotics/antimycotics), and cells were differentiated for up to 4 days. DM was replaced every 2 days.
For Grx2 knockdown studies, confluent primary myoblasts were treated with fresh DM for 4 h followed by a 48-h incubation in fresh DM containing 2.0 μg/ml Polybrene (Santa Cruz Biotechnology) and scrambled shRNA (control; shCtl) or Grx2 shRNA (Grx2 knockdown; shGrx2) lentiviral particles (∼5000 infectious viral particle units/ml (Santa Cruz Biotechnology)). Medium was then replaced with fresh DM and incubated for 24 h in puromycin to select for myotubes containing lentivirus.
Assessment of Mitochondrial Bioenergetics in Intact Cells
Bioenergetic characteristics of primary myotubes from WT or UCP3 knock-out (UCP3−/−) mice transduced with shCtl or shGrx2 lentiviral particles were tested using the Seahorse XF24 Analyzer. Differentiated cells were washed twice in PBS (to remove puromycin), incubated for 45 min in glucose and HCO3-free Seahorse medium (4 mm glutamine, 1 mm pyruvate, 4.5 g of powdered DMEM in 500 ml, pH 7.2) at 37 °C and ambient CO2, and then tested for bioenergetics. Following the measurement of resting respiration, cells were treated sequentially with oligomycin (0.2 μg/ml), diamide (100 μm), FCCP (2 μm), and antimycin A (2 μm) to test the effect of diamide on state 4 (proton leak-dependent, nonphosphorylating), maximal, and extramitochondrial respiration, respectively. Each measurement interval consisted of 2 min mixing, 2 min incubation, and 2 min measurement steps. OCR values were calculated by averaging the measurements from each interval followed by subtraction of the extramitochondrial respiration value and correction to protein content/well.
RESULTS
Physiological and Metabolic Characterizations of the Grx2−/− Mouse
To explore the role of Grx2 in the modulation of proton leak through UCP3, we used a whole body Grx2 knock-out (Grx2−/−) mouse on a C57Bl6 genetic background. To our knowledge, this mouse model has only been used in one previous study where ROS homeostasis was tested in cultured primary lens epithelial cells from Grx2−/− mice (34). Thus, prior to performing in-depth bioenergetics analyses, we determined whether Grx2−/− had effects at the whole body level. All determinations in this study were performed on male mice between 9 and 12 weeks of age. In comparison with WT mice, Grx2−/− had a small but significant decrease in total body weight (Fig. 1a); however, there were no differences in linear growth. Analysis of tissue and organ weights revealed lower gonadal white adipose tissue weight, a proxy measure of adiposity (Fig. 1b). Notable also was the lower amount of fat associated with skeletal muscle in Grx2−/− mice (data not shown). No significant differences in liver, gastrocnemius muscle, or brown adipose tissue weights were observed (Fig. 1b). In addition, no significant differences in total lean muscle mass (hind limb, forelimb, and pectoral) were recorded (data not shown). A small but significant increase and decrease in heart and kidney weights, respectively, was observed in Grx2−/− mice (Fig. 1b). Hematoxylin and eosin (H&E) staining of tissue sections from gastrocnemius muscle and liver revealed no gross histological changes or noticeable pathologies (Fig. 1c). Furthermore, liver sizes and color were similar between WT and Grx2−/−.
FIGURE 1.

Impact of Grx2−/− on whole body energetics and mouse physiology. a, mouse weight. Student's t test, n = 4, mean ± S.E. b, effect of Grx2−/− on tissue and organ weights. Student's t test, n = 4, mean ± S.E. BAT, interscapular brown adipose tissue; GWAT, gonadal white adipose tissue. c, hematoxylin and eosin staining of gastrocnemius (×40 objective) and liver (×20 objective) cross-sections. d, measurement of whole body energetics by indirect calorimetry. n = 6. e, impact of Grx2−/− on respiratory exchange ratio (RER) and mouse activity in WT and Grx2−/− mice during light and dark phases. Student's t test, n = 6, mean ± S.E. f, daily food intake. Measurements were taken every 3–4 days and corrected for spillage. n = 5, mean ± S.E.
We next measured whole body O2 consumption rates and spontaneous physical activity. Grx2−/− did not alter whole body O2 consumption rates indicating that Grx2−/− does not alter energy requirements, at least at the whole body level (Fig. 1d). However, the preferred source of energy oxidized did differ between WT and Grx2−/− mice. Respiratory exchange ratio data showed that Grx2−/− mice relied more on carbohydrates than fats as an energy source in both light and dark phases (Fig. 1, d and e). Grx2−/− mice were also less active than WT mice during both light and dark cycles (Fig. 1e). However, Grx2−/− mice maintained normal fasting levels of circulating glucose, triacylglycerol, and free fatty acids (supplemental Table S1). Furthermore, there were no differences in daily food intake (Fig. 1f).
Grx2−/− Alters Mitochondrial Glutathione Homeostasis but Does Not Induce Oxidative Damage
We next tested the impact of Grx2−/− on mitochondrial glutathione homeostasis and the glutathionylated proteome. Absolute levels of reduced glutathione (GSH) did not change in liver or muscle mitochondria from Grx2−/− mice, but there was a significant increase in mitochondrial glutathione disulfide (GSSG) in both tissues (Fig. 2a). The increase in GSSG caused significant decreases in 2GSH/GSSG in both liver and muscle mitochondria (Fig. 2a). However, Grx2−/− had a more profound impact on 2GSH/GSSG in liver than muscle mitochondria (Fig. 2a). We also calculated the relative redox potential of the 2GSH/GSSG ratio in mitochondria (Fig. 2a). Grx2−/− significantly increased the potential in liver but not in muscle mitochondria (although a trend for an increase in muscle was observed). This difference reflects the more drastic change in 2GSH/GSSG in liver mitochondria from Grx2−/− mice. The potential of 2GSH/GSSG in mitochondria has previously been reported to range from −280 to −340 mV (42). The reported Eh varies according to the method used (HPLC or ratiometric fluorescent probes). For instance, using our method it should be anticipated that the absolute amounts of GSH may be underestimated (and GSSG possibly overestimated) during sample preparation due to oxidation. Regardless, our calculated Eh is similar to values reported in previous publications. Thus, despite the knock-out of Grx2 and the subsequent increase in GSSG, Grx2−/− mitochondria are still able to retain a reductive environment.
FIGURE 2.

Grx2−/− alters 2GSH/GSSG redox potential and the glutathionylated proteome but does not induce oxidative damage. a, measurement of the absolute levels of GSH and GSSG in liver and muscle mitochondria from WT and Grx2−/− mice. 2GSH/GSSG was calculated from the absolute GSH and GSSG levels. Eh was calculated using the Nernst equation as described under “Materials and Methods.” ** indicates p ≤ 0.01. Student's t test, n = 4, mean ± S.E. b, serum levels of GSH and GSSG in WT and Grx2−/− mice. n = 4, mean ± S.E., Student's t test. c, measurement of HNE-His adducts in liver and muscle mitochondria from WT and Grx2−/− mice. n = 4, mean ± S.E., Student's t test. d, assessment of the glutathionylated proteome in liver and muscle mitochondria. Gels were run under nonreducing conditions to preserve PSSG adducts. Samples prepared in 2% (v/v) β-mercaptoethanol served as the control. Blots were quantified using ImageJ software. Student's t test, n = 5, mean ± S.E. e, immunodetection of glutaredoxin-2, Grx2; thioredoxin-2, Trx2; and uncoupling protein-3, UCP3. SDH, succinate dehydrogenase.
Measurements of absolute circulating levels of GSH and GSSG showed that both reduced and oxidized forms of glutathione were significantly lower in Grx2−/− than WT mice (Fig. 2b). The changes in circulating and tissue glutathione levels prompted us to measure His-HNE protein adducts. HNE is an electrophilic end product of ROS-mediated lipid membrane damage, which can covalently modify proteins and enzymes impairing their functions. No differences in His-HNE were observed in liver and muscle mitochondria from WT and Grx2−/− mice (Fig. 2c). Thus, Grx2−/− does alter glutathione homeostasis but does not induce oxidative damage.
GSSG has been suggested to nonenzymatically glutathionylate proteins via simple disulfide exchange reaction with free protein thiols. Given our observation that GSSG levels increase in Grx2−/− mitochondria, we measured total protein glutathione disulfide mixture levels. No significant changes in total protein glutathionylation were observed in either liver or muscle (Fig. 2d). However, the glutathionylated proteome itself was different between muscle and liver mitochondria (Fig. 2d). Indeed, more of the liver mitochondrial proteome is glutathionylated than muscle, suggesting that this type of redox modification is more prevalent in liver.
Accordingly, we then determined whether there were any changes in enzymes involved in redox homeostasis and antioxidative defense. No increase in Trx2 protein levels was detected in liver or muscle mitochondria from Grx2−/− (Fig. 2e). Thioredoxin-2 (Trx2) has been implicated in catalyzing deglutathionylation reactions but with less efficiency than Grx2 (43). As expected, UCP3 protein was only detected in muscle mitochondria (Fig. 2e). An increase in UCP3 protein (∼60%) was observed in muscle mitochondria from Grx2−/− mice. In liver mitochondria, no changes in manganese superoxide dismutase, glutathione peroxidase 4 (GPx4), or ANT were observed (supplemental Fig. S1A). In muscle, Grx2−/− induced an increase in GPx4 and ANT protein levels with no changes in manganese superoxide dismutase (supplemental Fig. S1A). In fact, the increase in GPx4 in muscle mitochondria from Grx2−/− mice was substantial. GPx4 is responsible for catalyzing the glutathione-mediated reduction of lipid hydroperoxides (44). Given our results, Grx2−/− does alter glutathione homeostasis but not enough to induce oxidative damage in mitochondria from liver or muscle. This would indicate that Grx2 catalyzes site-specific glutathionylation reactions and that an increase in GSSG is not enough to prompt protein glutathionylation.
Grx2−/− Alters Mitochondrial ROS Emission and Metabolism
The effects of Grx2−/− on mitochondrial ROS emission, complex I activity, and metabolite levels were then examined. For ROS emission and complex I activity assays, reactions were performed in the presence or absence of DTT, a powerful reductant that reverses protein glutathionylation. Liver mitochondria from Grx2−/− mice generated more ROS in comparison with WT before and after the addition of oligomycin, an ATP synthase inhibitor; when ATP synthase is inhibited, mitochondrial membrane potential increases, which in turn increases ROS production by the electron transport chain (Table 1). Adding DTT to the reaction mixtures lowered ROS production (Table 1). Interestingly, no differences in mitochondrial ROS emission were observed with muscle mitochondria Grx2−/− and WT mice before and after oligomycin treatment (Table 1). Thus, the loss of Grx2 in liver enhances mitochondrial ROS production, which can be reversed with DTT.
TABLE 1.
Loss of Grx2 expression increases the rate of ROS production from liver but not skeletal muscle mitochondria
Rates of ROS production from mitochondria isolated from wild-type and Grx2 knock-out (Grx2−/−) mice treated with or without DTT were calculated before and after the addition of oligomycin (Oligo). ROS production was measured using dihydrodichlorofluorescein diacetate. Arbitrary units/min/mg protein. Student's t test, n = 4, mean ± S.E. NA corresponds to no rate recorded.
| −DTT |
+DTT |
|||
|---|---|---|---|---|
| WT | Grx2−/− | WT | Grx2−/− | |
| Liver (−Oligo) | 9.06 ± 5.86 | 42.63 ± 4.63a | NA | 26.67 ± 7.71a |
| Liver (+Oligo) | 52.11 ± 6.77 | 73.09 ± 14.41a | 69.03 ± 7.37 | 79.57 ± 3.06 |
| Muscle (−Oligo) | NA | NA | NA | NA |
| Muscle (+Oligo) | 28.17 ± 4.51 | 32.33 ± 6.59 | 35.66 ± 3.97 | 37.08 ± 7.98 |
a p < 0.05, statistical comparisons were performed between WT and Grx2−/− mitochondria under each condition.
As complex I is a well characterized target for Grx2 deglutathionylation (45, 46), we next tested the effect of Grx2−/− on complex I activity. Others have shown that complex I glutathionylation not only lowers its activity but also increases mitochondrial ROS production (47). The specific activity of complex I was significantly decreased (∼37%) in liver mitochondria from Grx2−/− mice (Fig. 3a). Interestingly, performing the reactions in the presence of DTT did not reverse the inhibition of complex I in Grx2−/− (Fig. 3b). However, the activity of complex I in mitochondrial preparations from WT liver seemed to increase when DTT was added to the reaction mixture. For muscle mitochondria, complex I-specific activity seemed to be unaffected by Grx2−/− (Fig. 3a). Performing reactions in the presence of DTT had no further effects on complex I activity in mitochondrial preparations from WT and Grx2−/− muscle (Fig. 3b).
FIGURE 3.

Effect of Grx2−/− on complex I activity in liver and muscle mitochondria. Reactions were performed on digitonized mitochondria in the absence (a) or presence (b) of 2 mm DTT. Student's t test, n = 4, mean ± S.E.
Next, we decided to assess the effects of Grx2−/− on levels of TCA cycle metabolites and mitochondrial ATP. In liver mitochondria, Grx2−/− led to the accumulation of several TCA cycle intermediates (Fig. 4a). Specifically, there was a significant accumulation in pyruvate, citrate, and succinate, possibly due to a slowing of the TCA cycle, thus prompting the accumulation of metabolites. These data are consistent with the decrease in complex I activity and the increase in ROS emission. Indeed, decreased NADH oxidation by complex I is well known to diminish TCA cycle flux and increase metabolite accumulation (48). Further TCA cycle enzymes have been shown to be inhibited through glutathionylation (49). In muscle mitochondria, no alterations in pyruvate, malate, or citrate were observed (Fig. 4b). However, a significant decrease and increase in 2-oxoglutarate and succinate levels, respectively, were observed (Fig. 4b). Thus, in contrast to liver, muscle mitochondria from Grx2−/− do not display any fluctuations in TCA cycle flux except for the decrease in 2-oxoglutarate, which would suggest increased utilization and conversion to succinate. ATP levels were lower in liver mitochondria from Grx2−/− mice (Fig. 4c). These effects were not observed in muscle mitochondria isolated from Grx2−/− mice (Fig. 4d). Thus, our findings indicate that Grx2 regulates mitochondrial metabolism differently in skeletal muscle and liver mitochondria.
FIGURE 4.

Levels of TCA cycle metabolites and ATP in liver (a and c) and muscle (b and d) mitochondria, as assessed by HPLC. Student's t test, n = 5, mean ± S.E.
Effect of Grx2−/− on Mitochondrial Bioenergetics
Our observations above indicate that Grx2−/− results in decreased complex I activity, TCA cycle flux, and ATP levels and increased ROS production in liver mitochondria, whereas loss of Grx2 had no effect on any of these parameters in muscle mitochondria except TCA cycle flux. These fundamental differences prompted us to measure various bioenergetics parameters and respiratory states in liver and muscle mitochondria. To test the energetics of liver and muscle mitochondria from WT and Grx2−/−, we used a new method involving the Seahorse XF24 Analyzer (35). In this instrument OCR and energetics can be measured in up to 20 samples simultaneously, requiring only 10 μg of mitochondrial protein per well. Compared with a Clark-type oxygen electrode system, much less mitochondrial protein is typically required for measurements. Before proceeding with our assays, we validated our Seahorse protocol by measuring RCR of mitochondria (supplemental Fig. S2, A and B) and assessing mitochondrial integrity (supplemental Fig. S2, C and D). Seahorse determinations were performed in parallel with measurements in the Clark-type oxygen electrode. For RCR measurements, liver and muscle mitochondria were very responsive to sequential ADP treatments in the Seahorse XF24. Rates of respiration following ADP exposure were similar in both the XF24 and the Clark-type oxygen electrode (supplemental Fig. S2, A and B). However, the measured rate of state 2 respiration (an estimation of proton leak) was much higher in the XF24 versus the Clark-type oxygen electrode. This difference altered the calculated RCR values between the two methods (supplemental Fig. S2, A and B). To eliminate the possibility that this difference was due to loss of mitochondrial outer membrane integrity, we measured state 3 respiration before and after addition of cytochrome c. As shown in supplemental Fig. S2, C and D, addition of cytochrome C did not alter the absolute respiration rates in either the XF24 or the Clark-type oxygen electrode. This indicates that mitochondria maintain outer membrane integrity after isolation and attachment to the XF24 TC plates.
Applying this method, we measured bioenergetics in liver and muscle mitochondria from WT and Grx2−/− (supplemental Fig. S3A). As shown in Fig. 5a, Grx2−/− did not alter state 2 or FCCP-stimulated respiration in liver mitochondria. However, Grx2−/− induced a significant decrease and increase in ADP-stimulated and proton leak-dependent (state 4) respiration, respectively, thus indicating diminished mitochondrial coupling efficiency (Fig. 5a). Muscle mitochondria from Grx2−/− mice displayed increases in state 2, state 3, and state 4 respiration rates (Fig. 5b). No change in the respiratory control ratio (state 3/state 4) of muscle mitochondria was observed. We confirmed the increase in proton leak in skeletal muscle mitochondria from Grx2−/− using the complex II-linked energy substrate succinate. Proton leak-dependent respiration was significantly higher in muscle mitochondria from Grx2−/− mice (supplemental Fig. S4). No differences in leak were observed in liver mitochondria when succinate was the substrate. We next examined if the changes in proton leak were associated with ANT. Intriguingly, carboxyatractyloside (CAT; an ANT inhibitor) did not decrease proton leak-dependent respiration in liver mitochondria from WT and Grx2−/− (supplemental Fig. S5). CAT treatment decreased proton leak in muscle mitochondria from WT and Grx2−/− mice (supplemental Fig. S5). However, the leak remained elevated in the Grx2−/− compared with WT mitochondria indicating other leak mechanisms, such as UCP3, are activated.
FIGURE 5.

Impact of Grx2−/− on bioenergetics of mitochondria from liver (a) and skeletal muscle (b). Bioenergetic determinations were performed with the Seahorse XF24 Extracellular Flux Analyzer. Mitochondria (10 μg) were attached to the surface of Seahorse TC plates and then treated sequentially with ADP (0.1 mm), oligomycin (oligo; 2.5 μg/ml) and FCCP (8 μm) to test state 3, state 4, and maximal respiration, respectively. % contribution of respiration to ATP production was calculated by dividing state 4 respiration (proton leak-dependent) by state 3 respiration. Student's t test, n = 4, mean ± S.E. Pyr, pyruvate; Mal, malate.
UCP3 Is Less Glutathionylated in Grx2−/− Muscle Mitochondria
In our previous work, we showed that glutathionylation of UCP3 inhibits leak and that this can be reversed by ROS (15). The increase in ANT-independent proton leak in Grx2−/− skeletal muscle mitochondria prompted us to determine whether these differences in leak were associated with UCP3 and its glutathionylation state. Mitochondria from Grx2−/− skeletal muscle were sequentially treated with oligomycin, H2O2 (10 μm), and diamide (10 μm) to test the sensitivity of proton leak toward changes in mitochondrial redox state (supplemental Fig. S3B). Our group has previously established that diamide can serve as a glutathionylation catalyst deactivating UCP3, whereas H2O2 (or other ROS species) can reverse glutathionylation thereby activating proton leak (22). In WT muscle mitochondria, a significant increase in proton leak was observed following treatment with H2O2 (Fig. 6a). This increase was not observed in muscle mitochondria from Grx2−/− mice. However, it is important to point out that state 4 (proton leak-dependent) respiration was already elevated in Grx2−/− mitochondria prior to treatment with H2O2. Treatment of WT mitochondria with H2O2 actually elevated state 4 respiration to levels observed in Grx2−/− mitochondria. The subsequent injection of the glutathionylation catalyst diamide lowered respiration back to oligomycin-induced state 4 respiration levels in WT and Grx2−/− muscle mitochondria (Fig. 6a). Thus, our results would suggest that H2O2 is required to stimulate UCP3, and this activation can be reversed by glutathionylation with diamide. Most important though is the observation that the H2O2 effect is absent in Grx2−/− mitochondria.
FIGURE 6.

Effect of H2O2 and diamide on mitochondrial proton leak. a, impact of successive H2O2 and diamide treatments on proton leak in mitochondria isolated from muscle of WT and Grx2−/− mice. One-way analysis of variance with Fisher's protected least significant difference post hoc test, n = 4, mean ± S.E. * and # correspond to comparisons with WT or Grx2−/− (oligomycin (oligo) conditions). b, impact of successive H2O2 (Per) and diamide (Dia) treatments on proton leak in mitochondria isolated from muscle of WT and UCP3−/− mice. One-way analysis of variance with Fisher's protected least significant difference post hoc test, n = 4, mean ± S.E. * and # correspond with comparisons to WT or UCP3−/− (oligomycin conditions). c, Grx2 is required to glutathionylate UCP3. Mitochondria were treated with BioGEE, and proteins were immunoprecipitated and then tested for UCP3 by immunoblot. d, visualization of UCP3 glutathionylation status by immunofluorescent microscopy. Gastrocnemius muscle sections were fixed and treated with antibodies directed against UCP3 (green) and BioGEE (red). Co-localization of both stains provides a yellow fluorescence. Preincubation in NEM or DTT were used as controls. Scale bar, 10 μm.
To confirm that UCP3 was responsible for the changes in proton leak following H2O2 and diamide treatment, we performed the same experiments on muscle mitochondria from UCP3−/− mice. The presence or absence of UCP3 was confirmed by immunoblot (supplemental Fig. S5C). Absolute proton leak-dependent respiration rates were 2-fold higher in mitochondria collected from muscle of WT mice (Fig. 6b). It is important to point out that mitochondria were isolated in the presence of substrate (pyruvate and malate), which can maintain a high protonic potential. Indeed, Azzu et al. (50) previously reported that maintenance of a high protonic potential in isolated mitochondria is required to properly measure leaks through UCP3. Leak was significantly increased and decreased in WT muscle mitochondria by subsequent treatments with H2O2 and diamide, respectively (Fig. 6b). H2O2 and diamide effects were absent in muscle mitochondria collected from UCP3−/− mice. The elevated leak in WT mitochondria remained even when mitochondria were treated with CAT, thus indicating that ANT is not responsible for the differences observed (supplemental Fig. S5D).
Next, we tested the glutathionylation status of UCP3. For this, we treated freshly isolated mitochondria with BioGEE, a membrane-permeable glutathione analog that tags glutathionylation sites with biotin. The biotinylated protein can then be isolated for immunoblot analysis. A higher amount of BioGEE binding indicates that there are more free glutathionylation sites available for BioGEE modification, i.e. a lower endogenous level of glutathionylation. More BioGEE-tagged UCP3 was enriched from Grx2−/− than WT muscle mitochondria (Fig. 6c), indicating a lower endogenous UCP3 glutathionylation in Grx2−/− muscle mitochondria. No UCP3 was detected or enriched from liver mitochondria. We confirmed these observations by immunofluorescent staining for both UCP3 (green) and BioGEE-tagged proteins (red) in gastrocnemius muscle sections. A combination of red and green fluorescence provides yellow fluorescence indicating co-localization of UCP3 antibody and BioGEE. Thus, more yellow fluorescence indicates that more UCP3 protein is deglutathionylated. More UCP3 stain was co-localized with BioGEE staining in gastrocnemius sections from Grx2−/− mice (Fig. 6d). Importantly, most of the signal associated with the co-localization of both antibodies was around the edges of the sections and possibly localized to subsarcolemmal mitochondria (Fig. 6d). We also analyzed sections that were pretreated with NEM or DTT (see “Materials and Methods”). Pretreatment with either NEM or DTT confirmed that changes in fluorescent staining were associated with UCP3 glutathionylation state. Hence, there is decreased glutathionylation of UCP3 in muscle from Grx2−/−.
Grx2 Is Required to Deactivate UCP3 Leak
The observations above indicate the following: 1) proton leak is higher in muscle mitochondria from Grx2−/− mice; 2) these effects can be reversed using glutathionylation catalysts, and 3) UCP3 glutathionylation is much lower in Grx2 −/− than WT muscle. We then questioned if there was a direct relationship between Grx2−/− and UCP3 function. To do this we used WT and UCP3−/− mouse primary myotubes transduced with either scrambled RNA or short hairpin Grx2 (shGrx2) lentiviral particles. There was an ∼82 and ∼61% knockdown in WT and UCP3−/− cells, respectively, following shGrx2 treatment (Fig. 7c). Grx2 knockdown in WT cells significantly increased state 4 respiration, which was readily suppressed by a subsequent treatment with diamide (Fig. 7b). The observed increase in proton leak following Grx2 knockdown was absent in UCP3−/− cells (Fig. 7b). These results support the idea that Grx2 directly modulates proton leak through UCP3 by glutathionylation.
FIGURE 7.
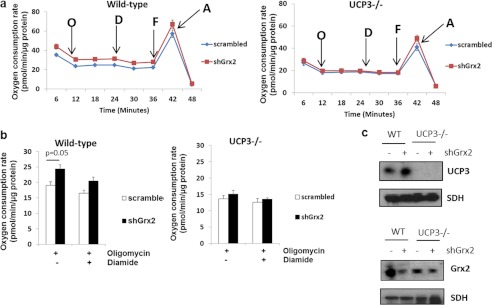
Grx2 is required to modulate proton leak through UCP3 in intact skeletal muscle cells. Primary myotubes from WT or UCP3−/− mice were transduced with shGrx2 lentivirus to knock down Grx2. Scrambled shRNA served as a control. a, oxygen consumption trace showing the bioenergetic responses of WT and UCP3−/− primary myotubes transduced with scrambled or shGrx2 lentiviral particles. O, oligomycin; D, diamide; F, FCCP; A, antimycin A. b, Grx2 knockdown increases proton leak in primary WT but not UCP3−/− myotubes. Student's t test, n = 4, mean ± S.E. c, immunoblot for UCP3 and Grx2 in WT and UCP3−/− myotubes knocked down for Grx2. SDH, succinate dehydrogenase.
DISCUSSION
Regulation of protein function by glutathionylation is especially relevant to mitochondria because this organelle harbors an environment that is conducive for reversible glutathionylation reactions (51). Numerous mitochondrial proteins, including key TCA cycle enzymes, some of the respiratory complexes, UCP2, UCP3, and ANT can be glutathionylated (52). Addition of a bulky glutathione moiety to these proteins alters their activities. In the mitochondrial matrix, Grx2 is the only enzyme known to mediate (de)glutathionylation (33, 53). Just a handful of mitochondrial proteins, including complex I and possibly also α-ketoglutarate dehydrogenase, is known to be targeted by Grx2 (46, 49). Previously, we showed that purified UCP3 can be glutathionylated by Grx1 in vitro (22). Furthermore, we were able to show that reversible glutathionylation of UCP3 is required to modulate mitochondrial ROS production that can have profound signaling effects (15). We and others have shown that UCP3 mitigates obesity and promotes fasting-induced fatty acid oxidation (54, 55). Thus, given that glutathionylation is an important covalent modification in mitochondria that is controlled in part by Grx2, we aimed to determine whether Grx2 is required to modulate mitochondrial function and control UCP3.
Here, we have identified Grx2 as the enzyme required to inhibit UCP3 proton leak via glutathionylation. In Grx2−/− muscle mitochondria, UCP3 was less glutathionylated as indicated by BioGEE enrichment assays and immunohistochemistry, consistent with the observed increases in proton leak. The importance of Grx2 in modulating UCP3 leak was confirmed using primary myotubes from WT and UCP3−/− mice. Indeed, knockdown of Grx2 in WT primary myotubes increased proton leak, although no effect was observed in myotubes from UCP3−/− mice. We also performed functional determinations on isolated mitochondria using a novel multiwell plate approach to ascertain if the increased proton leak in Grx2−/− muscle mitochondria could be further stimulated by H2O2 and/or reversed by diamide. Prior to diamide treatment, mitochondria under state 4 respiratory conditions were acutely treated with 10 μm H2O2. Intriguingly, H2O2 increased leak in WT mitochondria to levels found in Grx2−/− muscle mitochondria, consistent with the conclusion that UCP3 leak in Grx2−/− is fully activated. When similar experiments were performed on muscle mitochondria from WT and UCP3−/− mice, H2O2 and diamide activated and impeded the leak, respectively, only in mitochondrial preparations from WT mice, which confirmed our previous observations (22). From these observations, we can conclude that Grx2 is required to turn off UCP3-mediated proton leak through glutathionylation. However, the mechanism of ROS-mediated UCP3 activation remains elusive.
We have previously observed that ROS-induced deglutathionylation of UCP3 requires a cellular/mitochondrial environment because this reaction does not proceed in vitro with purified UCP3. This led us to propose in previous publications that ROS may activate a yet to be identified enzyme that activates UCP3 through deglutathionylation (see Introduction). However, it is also possible that ROS may actually oxidize UCP3 thiols to sulfenic acid moieties to activate proton conductance. In this case, glutathionylation may block ROS-mediated thiol oxidation and activation of leak. It should be noted that leak through ANT was also increased in Grx2−/− skeletal muscle mitochondria suggesting that this protein may also be targeted by Grx2 (56). This increase in the CAT-sensitive leak could also be associated with the increase in ANT protein levels. However, despite inhibition of ANT with CAT, the leak was still elevated in Grx2−/−, indicating the contributions of both UCP3 and ANT to leak in Grx2−/− muscle mitochondria. Intriguingly, the increase in proton leak in muscle mitochondria did not compromise mitochondrial ATP production. It is important to point out however that Grx2 is not the first enzyme reported to interact with UCP3. For instance, UCP3 protein is turned over by proteosomal degradation that requires ubiquitination (57). In regard to redox biology, Trx2 has been found to interact with the N terminus of UCP3 in the intermembrane space (58). It was demonstrated that the Trx2-UCP3 complex is required to lower mitochondrial ROS emission. To our knowledge, the interaction between Trx2 and UCP3 is the first evidence showing that UCP3 actually has binding partners. Intriguingly however, in regard to redox signaling, Trx2 fulfills different roles than Grx2 because Trx2 preferentially reduces intra- or intermolecular disulfide bridges instead of mediating glutathionylation reactions. Indeed, we observed no compensatory increases in Trx2 expression supporting the divergence in Trx2 and Grx2 in redox signaling. However, this does not diminish the importance of Trx2 in the regulation of UCP3. In fact, it would seem that UCP3 serves as a hub for redox regulation because of the following: 1) prominent thiol-metabolizing enzymes, namely Grx2 and Trx2, interact with UCP3; 2) UCP3 plays an important role in limiting mitochondrial ROS emission (ROS levels have a direct effect on mitochondrial thiol homeostasis).
The effects of Grx2−/− in liver mitochondria were in stark contrast to those in muscle mitochondria. Indeed, oxidative phosphorylation and aerobic ATP production were decreased in liver mitochondria; this was accompanied by decreased complex I activity and TCA cycle flux and increased mitochondrial ROS emission. Incubation of mitochondrial extracts from Grx2−/− liver in DTT, which reverses glutathionylation, did lower mitochondrial ROS production but did not restore complex I activity. It is possible that complex I may have been deactivated by the increase in ROS. Oxidation of key thiol residues on the 75-kDa subunit of complex I has been reported to deactivate the respiratory complex (59). It is important to note however that despite the increase in ROS production in Grx2−/− liver mitochondria, no oxidative damage (as assessed by His-HNE protein adducts) was recorded. This result may seem inconsistent with the elevation in GSSG levels; however, liver mitochondria retained high GSH levels, and there were no compensatory increases in antioxidative enzymes. Thus, we can conclude that the observed metabolic changes appear to be due to the lack of Grx2, rather than oxidative damage. Thus, this mouse model effectively illustrates the importance of Grx2 in the regulation of mitochondrial metabolism in liver. Because UCP2 and -3 are not expressed in liver parenchyma, it is possible that the increase in leak is due to other proton-conducting proteins that are modulated by Grx2-mediated (de)glutathionylation events.
It has been known for some time that proteins can be covalently modified by glutathione (60) and that this reaction can potentially regulate metabolism and other processes (61, 62). After several decades, it is now well appreciated that there are two classes of glutathionylation reactions, enzymatic and nonenzymatic. Both reaction types are dictated by the 2GSH/GSSG redox pair, and the amount of ROS being produced, which not only influences the redox state of 2GSH/GSSG but also renders thiols more amenable for glutathionylation. However, the true nature of these reactions and how they regulate cellular processes still remains elusive. In fact, the identity of the thiol transferase first described by Mannervik and Axelsson (31) (see Introduction) was not identified until the mid-1990s (in 1995, Mieyal and Chock first suggested that glutaredoxin was responsible for catalyzing glutathionylation reactions (63)). What remains clear however is that glutathionylation reactions can be protein-specific and tightly regulated, and this can have a profound impact on cell function. Nonenzymatic glutathionylation reactions have been described to proceed via a multitude of pathways (30, 64, 65), including ROS-mediated oxidation of protein thiols to reactive sulfenic acids, generation of thiyl radicals, or simply a thiol disulfide exchange between GSSG and a protein thiol. However, for regulatory purposes, glutathionylation reactions must proceed enzymatically because these types of reactions can be more rapid, efficient, and specific. Our observations support the idea that glutathionylation is at least in part mediated by Grx2, is site-specific, and cannot be mediated simply by GSSG. Indeed, Grx2−/− elevated GSSG, but this did not induce any overt changes in protein glutathionylation in mitochondria. We also found that UCP3 is a target for Grx2, which further argues that glutathionylation reactions can be specific. However, detailed analysis of the mitochondrial proteome from Grx2−/− mice is required because we cannot fully account for all the bioenergetic changes in liver and muscle mitochondria. Grx2−/− did alter glutathione homeostasis in both liver and muscle mitochondria. Furthermore, in liver mitochondria Grx2−/− also significantly increased the Eh of 2GSH/GSSG, which could account for the observed effect on liver mitochondria. Intriguingly, circulating GSH and GSSG levels were significantly decreased in Grx2−/− mice indicating either a decreased propensity to expel GSH into blood or enhanced glutathione uptake from blood. Because of the increase in total glutathione in the mitochondrial environment, the latter rather than the former is most likely. Thus, Grx2−/− alters glutathione homeostasis but not enough to induce oxidative damage or uncontrolled hyper-glutathionylation.
Reversible glutathionylation of proteins has mostly been investigated in the cytosol where it participates in the modulation of cell signaling in conjunction with phosphorylation cascades (66). In mitochondria, the regulatory role of glutathionylation is less well studied, but with the observation that glutathionylation reactions can be mediated, at least in part, by Grx2, it is becoming more appreciated. Using the new Grx2−/− mouse model and a rapid and sensitive plate-based approach for measurement of mitochondrial energetics in different samples simultaneously, we investigated if Grx2 was required to control proton leak through UCP3. Along with our focused experiments on UCP3, we also measured the role of Grx2 in the regulation of mitochondrial metabolism overall in liver and skeletal muscle. Our results indicate that Grx2 plays an important role in regulating mitochondrial metabolism, but the regulatory role is tissue-dependent. Collectively, we have identified Grx2 as the enzyme responsible for regulating proton leak through UCP3 by glutathionylation. Specifically, by conjugating glutathione to UCP3, Grx2 inhibits proton leak in skeletal muscle mitochondria. What remains elusive however is how Grx2 actually conjugates glutathione to UCP3 and how ROS subsequently remove this moiety. However, based on our findings and work published by others (41, 44), it is increasingly clear that redox circuits govern important mitochondrial processes, including energetics, by eliciting their glutathionylation and deglutathionylation.
Acknowledgments
Grx2−/− mice were originally generated by Dr. Y. S. Ho (Institute of Environmental Health Sciences, Wayne State University, Detroit). We thank Raed Hanania and the Cell Biology and Image Acquisition (CBIA) Microscopy Core at the University of Ottawa for training on the deconvoluting microscope and Mahmoud Salkhordeh for the isolation and purification of primary muscle cells.
This work was supported by grants from the Canadian Institutes of Health Research, Institute of Nutrition, Metabolism, and Diabetes (to M. E. H.), and a postdoctoral fellowship from Canadian Institutes of Health Research (to R. J. M.).

This article contains supplemental Figs. S1–S3, Tables S1 and S2, and additional references.
- ROS
- reactive oxygen species
- NEM
- N-ethylmaleimide
- OCR
- oxygen consumption rate
- FCCP
- carbonyl cyanide p-trifluoromethoxyphenylhydrazone
- HNE
- 4-hydroxy-2-nonenal
- DM
- differentiating medium
- PSSG
- protein-glutathione
- RCR
- respiratory control ratio
- TC
- tissue culture
- ANT
- adenine nucleotide translocase
- CAT
- carboxyatractyloside.
REFERENCES
- 1. Mitchell P. (1961) Coupling of phosphorylation to electron and hydrogen transfer by a chemi-osmotic type of mechanism. Nature 191, 144–148 [DOI] [PubMed] [Google Scholar]
- 2. Himms-Hagen J., Harper M. E. (1999) Biochemical aspects of the uncoupling proteins: view from the chair. Int. J. Obes. Relat. Metab. Disord. 23, S30–S32 [DOI] [PubMed] [Google Scholar]
- 3. Mailloux R. J., Harper M. E. (2011) Uncoupling proteins and the control of mitochondrial reactive oxygen species production. Free Radic. Biol. Med. 51, 1106–1115 [DOI] [PubMed] [Google Scholar]
- 4. Adams S. H. (2000) Uncoupling protein homologs: emerging views of physiological function. J. Nutr. 130, 711–714 [DOI] [PubMed] [Google Scholar]
- 5. Azzu V., Brand M. D. (2010) The on-off switches of the mitochondrial uncoupling proteins. Trends Biochem. Sci. 35, 298–307 [DOI] [PMC free article] [PubMed] [Google Scholar]
- 6. Diao J., Allister E. M., Koshkin V., Lee S. C., Bhattacharjee A., Tang C., Giacca A., Chan C. B., Wheeler M. B. (2008) UCP2 is highly expressed in pancreatic alpha-cells and influences secretion and survival. Proc. Natl. Acad. Sci. U.S.A. 105, 12057–12062 [DOI] [PMC free article] [PubMed] [Google Scholar]
- 7. Robson-Doucette C. A., Sultan S., Allister E. M., Wikstrom J. D., Koshkin V., Bhattacharjee A., Prentice K. J., Sereda S. B., Shirihai O. S., Wheeler M. B. (2011) Beta-cell uncoupling protein 2 regulates reactive oxygen species production, which influences both insulin and glucagon secretion. Diabetes 60, 2710–2719 [DOI] [PMC free article] [PubMed] [Google Scholar]
- 8. Andrews Z. B., Liu Z. W., Walllingford N., Erion D. M., Borok E., Friedman J. M., Tschöp M. H., Shanabrough M., Cline G., Shulman G. I., Coppola A., Gao X. B., Horvath T. L., Diano S. (2008) UCP2 mediates ghrelin's action on NPY/AgRP neurons by lowering free radicals. Nature 454, 846–851 [DOI] [PMC free article] [PubMed] [Google Scholar]
- 9. Harper M. E., Dent R., Monemdjou S., Bézaire V., Van Wyck L., Wells G., Kavaslar G. N., Gauthier A., Tesson F., McPherson R. (2002) Decreased mitochondrial proton leak and reduced expression of uncoupling protein 3 in skeletal muscle of obese diet-resistant women. Diabetes 51, 2459–2466 [DOI] [PubMed] [Google Scholar]
- 10. Huppertz C., Fischer B. M., Kim Y. B., Kotani K., Vidal-Puig A., Slieker L. J., Sloop K. W., Lowell B. B., Kahn B. B. (2001) Uncoupling protein 3 (UCP3) stimulates glucose uptake in muscle cells through a phosphoinositide 3-kinase-dependent mechanism. J. Biol. Chem. 276, 12520–12529 [DOI] [PubMed] [Google Scholar]
- 11. Mailloux R. J., Dumouchel T., Aguer C., deKemp R., Beanlands R., Harper M. E. (2011) Hexokinase II acts through UCP3 to suppress mitochondrial reactive oxygen species production and maintain aerobic respiration. Biochem. J. 437, 301–311 [DOI] [PubMed] [Google Scholar]
- 12. Choi C. S., Fillmore J. J., Kim J. K., Liu Z. X., Kim S., Collier E. F., Kulkarni A., Distefano A., Hwang Y. J., Kahn M., Chen Y., Yu C., Moore I. K., Reznick R. M., Higashimori T., Shulman G. I. (2007) Overexpression of uncoupling protein 3 in skeletal muscle protects against fat-induced insulin resistance. J. Clin. Investig. 117, 1995–2003 [DOI] [PMC free article] [PubMed] [Google Scholar]
- 13. Korshunov S. S., Skulachev V. P., Starkov A. A. (1997) High protonic potential actuates a mechanism of production of reactive oxygen species in mitochondria. FEBS Lett. 416, 15–18 [DOI] [PubMed] [Google Scholar]
- 14. Bevilacqua L., Ramsey J. J., Hagopian K., Weindruch R., Harper M. E. (2005) Long-term caloric restriction increases UCP3 content but decreases proton leak and reactive oxygen species production in rat skeletal muscle mitochondria. Am. J. Physiol. Endocrinol. Metab. 289, E429–E438 [DOI] [PubMed] [Google Scholar]
- 15. Mailloux R. J., Harper M. E. (2012) Mitochondrial proticity and ROS signaling: lessons from the uncoupling proteins. Trends Endocrinol. Metab. 23, 451–458 [DOI] [PubMed] [Google Scholar]
- 16. Echtay K. S., Roussel D., St-Pierre J., Jekabsons M. B., Cadenas S., Stuart J. A., Harper J. A., Roebuck S. J., Morrison A., Pickering S., Clapham J. C., Brand M. D. (2002) Superoxide activates mitochondrial uncoupling proteins. Nature 415, 96–99 [DOI] [PubMed] [Google Scholar]
- 17. Lombardi A., Busiello R. A., Napolitano L., Cioffi F., Moreno M., de Lange P., Silvestri E., Lanni A., Goglia F. (2010) UCP3 translocates lipid hydroperoxide and mediates lipid hydroperoxide-dependent mitochondrial uncoupling. J. Biol. Chem. 285, 16599–16605 [DOI] [PMC free article] [PubMed] [Google Scholar]
- 18. Trenker M., Malli R., Fertschai I., Levak-Frank S., Graier W. F. (2007) Uncoupling proteins 2 and 3 are fundamental for mitochondrial Ca2+ uniport. Nat. Cell Biol. 9, 445–452 [DOI] [PMC free article] [PubMed] [Google Scholar]
- 19. Graier W. F., Trenker M., Malli R. (2008) Mitochondrial Ca2+, the secret behind the function of uncoupling proteins 2 and 3? Cell Calcium 44, 36–50 [DOI] [PMC free article] [PubMed] [Google Scholar]
- 20. Deleted in proof.
- 21. Mailloux R. J., Adjeitey C. N., Xuan J. Y., Harper M. E. (2012) Crucial yet divergent roles of mitochondrial redox state in skeletal muscle versus brown adipose tissue energetics. FASEB J. 26, 363–375 [DOI] [PubMed] [Google Scholar]
- 22. Mailloux R. J., Seifert E. L., Bouillaud F., Aguer C., Collins S., Harper M. E. (2011) Glutathionylation acts as a control switch for uncoupling proteins UCP2 and UCP3. J. Biol. Chem. 286, 21865–21875 [DOI] [PMC free article] [PubMed] [Google Scholar]
- 23. Shelton M. D., Chock P. B., Mieyal J. J. (2005) Glutaredoxin: role in reversible protein S-glutathionylation and regulation of redox signal transduction and protein translocation. Antioxid. Redox Signal. 7, 348–366 [DOI] [PubMed] [Google Scholar]
- 24. Fratelli M., Demol H., Puype M., Casagrande S., Eberini I., Salmona M., Bonetto V., Mengozzi M., Duffieux F., Miclet E., Bachi A., Vandekerckhove J., Gianazza E., Ghezzi P. (2002) Identification by redox proteomics of glutathionylated proteins in oxidatively stressed human T lymphocytes. Proc. Natl. Acad. Sci. U.S.A. 99, 3505–3510 [DOI] [PMC free article] [PubMed] [Google Scholar]
- 25. Mailloux R. J., Fu A., Robson-Doucette C., Allister E. M., Wheeler M. B., Screaton R., Harper M. E. (2012) Glutathionylation state of uncoupling protein-2 and the control of glucose-stimulated insulin secretion. J. Biol. Chem. 287, 39673–39685 [DOI] [PMC free article] [PubMed] [Google Scholar]
- 26. Pfefferle A., Mailloux R. J., Adjeitey C. N., Harper M. E. (2013) Glutathionylation of UCP2 sensitizes drug resistant leukemia cells to chemotherapeutics. Biochim. Biophys. Acta 1833, 80–89 [DOI] [PubMed] [Google Scholar]
- 27. Wang J., Boja E. S., Tan W., Tekle E., Fales H. M., English S., Mieyal J. J., Chock P. B. (2001) Reversible glutathionylation regulates actin polymerization in A431 cells. J. Biol. Chem. 276, 47763–47766 [DOI] [PubMed] [Google Scholar]
- 28. Chen Y. R., Chen C. L., Pfeiffer D. R., Zweier J. L. (2007) Mitochondrial complex II in the post-ischemic heart: oxidative injury and the role of protein S-glutathionylation. J. Biol. Chem. 282, 32640–32654 [DOI] [PubMed] [Google Scholar]
- 29. Gallogly M. M., Mieyal J. J. (2007) Mechanisms of reversible protein glutathionylation in redox signaling and oxidative stress. Curr. Opin. Pharmacol. 7, 381–391 [DOI] [PubMed] [Google Scholar]
- 30. Mieyal J. J., Gallogly M. M., Qanungo S., Sabens E. A., Shelton M. D. (2008) Molecular mechanisms and clinical implications of reversible protein S-glutathionylation. Antioxid. Redox Signal. 10, 1941–1988 [DOI] [PMC free article] [PubMed] [Google Scholar]
- 31. Mannervik B., Axelsson K. (1980) Role of cytoplasmic thiol transferase in cellular regulation by thiol-disulphide interchange. Biochem. J. 190, 125–130 [DOI] [PMC free article] [PubMed] [Google Scholar]
- 32. Papov V. V., Gravina S. A., Mieyal J. J., Biemann K. (1994) The primary structure and properties of thiol transferase (glutaredoxin) from human red blood cells. Protein Sci. 3, 428–434 [DOI] [PMC free article] [PubMed] [Google Scholar]
- 33. Gallogly M. M., Starke D. W., Leonberg A. K., Ospina S. M., Mieyal J. J. (2008) Kinetic and mechanistic characterization and versatile catalytic properties of mammalian glutaredoxin 2: implications for intracellular roles. Biochemistry 47, 11144–11157 [DOI] [PMC free article] [PubMed] [Google Scholar]
- 34. Wu H., Lin L., Giblin F., Ho Y. S., Lou M. F. (2011) Glutaredoxin 2 knockout increases sensitivity to oxidative stress in mouse lens epithelial cells. Free Radic. Biol. Med. 51, 2108–2117 [DOI] [PMC free article] [PubMed] [Google Scholar]
- 35. Rogers G. W., Brand M. D., Petrosyan S., Ashok D., Elorza A. A., Ferrick D. A., Murphy A. N. (2011) High throughput microplate respiratory measurements using minimal quantities of isolated mitochondria. PLoS One 6, e21746. [DOI] [PMC free article] [PubMed] [Google Scholar]
- 36. Bevilacqua L., Seifert E. L., Estey C., Gerrits M. F., Harper M. E. (2010) Absence of uncoupling protein-3 leads to greater activation of an adenine nucleotide translocase-mediated proton conductance in skeletal muscle mitochondria from calorie-restricted mice. Biochim. Biophys. Acta 1797, 1389–1397 [DOI] [PubMed] [Google Scholar]
- 37. Mailloux R. J., Harper M. E. (2010) Glucose regulates enzymatic sources of mitochondrial NADPH in skeletal muscle cells; a novel role for glucose-6-phosphate dehydrogenase. FASEB J. 24, 2495–2506 [DOI] [PubMed] [Google Scholar]
- 38. Schafer F. Q., Buettner G. R. (2001) Redox environment of the cell as viewed through the redox state of the glutathione disulfide/glutathione couple. Free Radic. Biol. Med. 30, 1191–1212 [DOI] [PubMed] [Google Scholar]
- 39. Zhang H., Limphong P., Pieper J., Liu Q., Rodesch C. K., Christians E., Benjamin I. J. (2012) Glutathione-dependent reductive stress triggers mitochondrial oxidation and cytotoxicity. FASEB J. 26, 1442–1451 [DOI] [PMC free article] [PubMed] [Google Scholar]
- 40. Brand M. D., Nicholls D. G. (2011) Assessing mitochondrial dysfunction in cells. Biochem. J. 435, 297–312 [DOI] [PMC free article] [PubMed] [Google Scholar]
- 41. Shutt T., Geoffrion M., Milne R., McBride H. M. (2012) The intracellular redox state is a core determinant of mitochondrial fusion. EMBO Rep. 13, 909–915 [DOI] [PMC free article] [PubMed] [Google Scholar]
- 42. Kemp M., Go Y. M., Jones D. P. (2008) Nonequilibrium thermodynamics of thiol/disulfide redox systems: a perspective on redox systems biology. Free Radic. Biol. Med. 44, 921–937 [DOI] [PMC free article] [PubMed] [Google Scholar]
- 43. Chrestensen C. A., Starke D. W., Mieyal J. J. (2000) Acute cadmium exposure inactivates thiol transferase (glutaredoxin), inhibits intracellular reduction of protein-glutathionyl-mixed disulfides, and initiates apoptosis. J. Biol. Chem. 275, 26556–26565 [DOI] [PubMed] [Google Scholar]
- 44. Murphy M. P. (2012) Mitochondrial thiols in antioxidant protection and redox signaling: distinct roles for glutathionylation and other thiol modifications. Antioxid. Redox Signal. 16, 476–495 [DOI] [PubMed] [Google Scholar]
- 45. Wu H., Xing K., Lou M. F. (2010) Glutaredoxin 2 prevents H2O2-induced cell apoptosis by protecting complex I activity in the mitochondria. Biochim. Biophys. Acta 1797, 1705–1715 [DOI] [PMC free article] [PubMed] [Google Scholar]
- 46. Beer S. M., Taylor E. R., Brown S. E., Dahm C. C., Costa N. J., Runswick M. J., Murphy M. P. (2004) Glutaredoxin 2 catalyzes the reversible oxidation and glutathionylation of mitochondrial membrane thiol proteins: implications for mitochondrial redox regulation and antioxidant defense. J. Biol. Chem. 279, 47939–47951 [DOI] [PubMed] [Google Scholar]
- 47. Taylor E. R., Hurrell F., Shannon R. J., Lin T. K., Hirst J., Murphy M. P. (2003) Reversible glutathionylation of complex I increases mitochondrial superoxide formation. J. Biol. Chem. 278, 19603–19610 [DOI] [PubMed] [Google Scholar]
- 48. Murphy M. P. (2009) How mitochondria produce reactive oxygen species. Biochem. J. 417, 1–13 [DOI] [PMC free article] [PubMed] [Google Scholar]
- 49. Applegate M. A., Humphries K. M., Szweda L. I. (2008) Reversible inhibition of α-ketoglutarate dehydrogenase by hydrogen peroxide: glutathionylation and protection of lipoic acid. Biochemistry 47, 473–478 [DOI] [PubMed] [Google Scholar]
- 50. Azzu V., Parker N., Brand M. D. (2008) High membrane potential promotes alkenal-induced mitochondrial uncoupling and influences adenine nucleotide translocase conformation. Biochem. J. 413, 323–332 [DOI] [PMC free article] [PubMed] [Google Scholar]
- 51. Hurd T. R., Costa N. J., Dahm C. C., Beer S. M., Brown S. E., Filipovska A., Murphy M. P. (2005) Glutathionylation of mitochondrial proteins. Antioxid. Redox Signal. 7, 999–1010 [DOI] [PubMed] [Google Scholar]
- 52. Sabens Liedhegner E. A., Gao X. H., Mieyal J. J. (2012) Mechanisms of altered redox regulation in neurodegenerative diseases–focus on S-glutathionylation. Antioxid. Redox Signal. 16, 543–566 [DOI] [PMC free article] [PubMed] [Google Scholar]
- 53. Gladyshev V. N., Liu A., Novoselov S. V., Krysan K., Sun Q. A., Kryukov V. M., Kryukov G. V., Lou M. F. (2001) Identification and characterization of a new mammalian glutaredoxin (thiol transferase), Grx2. J. Biol. Chem. 276, 30374–30380 [DOI] [PubMed] [Google Scholar]
- 54. Seifert E. L., Bézaire V., Estey C., Harper M. E. (2008) Essential role for uncoupling protein-3 in mitochondrial adaptation to fasting but not in fatty acid oxidation or fatty acid anion export. J. Biol. Chem. 283, 25124–25131 [DOI] [PubMed] [Google Scholar]
- 55. Costford S. R., Chaudhry S. N., Crawford S. A., Salkhordeh M., Harper M. E. (2008) Long term high fat feeding induces greater fat storage in mice lacking UCP3. Am. J. Physiol. Endocrinol. Metab. 295, E1018–E1024 [DOI] [PubMed] [Google Scholar]
- 56. Queiroga C. S., Almeida A. S., Martel C., Brenner C., Alves P. M., Vieira H. L. (2010) Glutathionylation of adenine nucleotide translocase induced by carbon monoxide prevents mitochondrial membrane permeabilization and apoptosis. J. Biol. Chem. 285, 17077–17088 [DOI] [PMC free article] [PubMed] [Google Scholar]
- 57. Mookerjee S. A., Brand M. D. (2011) Characteristics of the turnover of uncoupling protein 3 by the ubiquitin proteasome system in isolated mitochondria. Biochim. Biophys. Acta 1807, 1474–1481 [DOI] [PMC free article] [PubMed] [Google Scholar]
- 58. Hirasaka K., Lago C. U., Kenaston M. A., Fathe K., Nowinski S. M., Nikawa T., Mills E. M. (2011) Identification of a redox-modulatory interaction between uncoupling protein 3 and thioredoxin 2 in the mitochondrial intermembrane space. Antioxid. Redox Signal. 15, 2645–2661 [DOI] [PMC free article] [PubMed] [Google Scholar]
- 59. Hurd T. R., Requejo R., Filipovska A., Brown S., Prime T. A., Robinson A. J., Fearnley I. M., Murphy M. P. (2008) Complex I within oxidatively stressed bovine heart mitochondria is glutathionylated on Cys-531 and Cys-704 of the 75-kDa subunit: potential role of CYS residues in decreasing oxidative damage. J. Biol. Chem. 283, 24801–24815 [DOI] [PMC free article] [PubMed] [Google Scholar]
- 60. Isaacs J., Binkley F. (1977) Glutathione-dependent control of protein disulfide-sulfhydryl content by subcellular fractions of hepatic tissue. Biochim. Biophys. Acta 497, 192–204 [DOI] [PubMed] [Google Scholar]
- 61. Ziegler D. M. (1985) Role of reversible oxidation-reduction of enzyme thiols-disulfides in metabolic regulation. Annu. Rev. Biochem. 54, 305–329 [DOI] [PubMed] [Google Scholar]
- 62. Isaacs J. T., Binkley F. (1977) Cyclic AMP-dependent control of the rat hepatic glutathione disulfide-sulfhydryl ratio. Biochim. Biophys. Acta 498, 29–38 [DOI] [PubMed] [Google Scholar]
- 63. Mieyal J. J., Chock P. B. (2012) Post-translational modification of cysteine in redox signaling and oxidative stress: Focus on S-glutathionylation. Antioxid. Redox Signal. 16, 471–475 [DOI] [PMC free article] [PubMed] [Google Scholar]
- 64. Dalle-Donne I., Rossi R., Colombo G., Giustarini D., Milzani A. (2009) Protein S-glutathionylation: a regulatory device from bacteria to humans. Trends Biochem. Sci. 34, 85–96 [DOI] [PubMed] [Google Scholar]
- 65. Zaffagnini M., Bedhomme M., Lemaire S. D., Trost P. (2012) The emerging roles of protein glutathionylation in chloroplasts. Plant Sci. 185, 86–96 [DOI] [PubMed] [Google Scholar]
- 66. Pastore A., Piemonte F. (2012) S-Glutathionylation signaling in cell biology: progress and prospects. Eur. J. Pharm. Sci. 46, 279–292 [DOI] [PubMed] [Google Scholar]