

Abstract
Birth weight within the normal range is associated with a variety of adult-onset diseases, but the mechanisms behind these associations are poorly understood1. Previous genome-wide association studies identified a variant in the ADCY5 gene associated both with birth weight and type 2 diabetes, and a second variant, near CCNL1, with no obvious link to adult traits2. In an expanded genome-wide association meta-analysis and follow-up study (up to 69,308 individuals of European descent from 43 studies), we have now extended the number of genome-wide significant loci to seven, accounting for a similar proportion of variance to maternal smoking. Five of the loci are known to be associated with other phenotypes: ADCY5 and CDKAL1 with type 2 diabetes; ADRB1 with adult blood pressure; and HMGA2 and LCORL with adult height. Our findings highlight genetic links between fetal growth and postnatal growth and metabolism.
To understand further the genetic factors involved in fetal growth and its association with adult diseases, we performed an expanded genome wide association study (GWAS) of birth weight in up to 26,836 individuals of European ancestry from 18 studies (Stage 1; Supplementary Table 1; Supplementary Figures 1 to 3; see Online Methods). After follow-up analyses of 21 of the most strongly associated independent single nucleotide polymorphisms (SNPs; P < 1×10⁻⁵) in additional European samples (Supplementary Tables 2 and 3), we identified novel associations with birth weight at four loci (P < 5×10⁻⁸), and confirmed three previously reported associations2-4 (rs900400 near CCNL1, P = 3.6×10−38; rs9883204 in ADCY5, P = 5.5×10⁻²⁰; rs6931514 in CDKAL1; P = 1.5×10⁻¹⁸), in a joint meta-analysis of up to 69,308 individuals (Table 1; Figure 1 and Supplementary Figure 4). The index SNPs at the four newly-associated loci were rs1042725 in HMGA2 (P = 1.4×10⁻¹⁹), rs724577 in LCORL (P = 4.6×10⁻¹¹), rs1801253 in ADRB1 (P = 3.6×10⁻⁹) and rs4432842 at chromosome 5q11.2 (P = 4.6×10⁻⁸). The effect size estimates range from 0.034 SD to 0.072 SD per allele and equate approximately to changes in birth weight of 16 to 35g (Table 1). These estimates did not change materially in sensitivity analyses excluding studies with self- or parentally-reported birth weight data and those without a measure of gestational age (Supplementary Table 4).
Table 1.
Associations between seven loci associated with birth weight and various anthropometric measures taken at birth (from joint meta-analysis of up to 69,308 individuals).
| Locus (Index SNP, Effect allele/Other allele) |
Birth weight (combined meta- analysis of European Discovery and Follow-up studies) [in grams] |
Birth weight, adjusted for maternal genotype |
Birth weight, adjusted for birth length |
Birth length | Birth head circumference |
Ponderal Index (weight/length3) |
|
|---|---|---|---|---|---|---|---|
|
CCNL1 (rs900400, C/T) |
N | 61142 | 11130 | 36209 | 35953 | 23000 | 35708 |
| Beta (SE) | −0.072 (0.006) [−35] |
−0.108 (0.014) | −0.067 (0.005) | −0.025 (0.007) | −0.033 (0.009) | −0.090(0.008) | |
| P-value | 3.6E-38 | 7.5E-14 | 1.2E-35 | 6.7E-04 | 2.3E-04 | 9.5E-28 | |
| Unadj beta (SE)* | - | −0.109 (0.013) | −0.085 (0.008) | - | - | - | |
| Unadj P-value* | - | 7.5E-18 | 8.81E-29 | - | - | - | |
|
| |||||||
|
ADCY5 (rs9883204, C/T) |
N | 61509 | 11307 | 36015 | 36084 | 23184 | 35836 |
| Beta (SE) | −0.059 (0.006) [−29] |
−0.077 (0.016) | −0.032 (0.006) | −0.035 (0.009) | −0.031 (0.010) | −0.034 (0.010) | |
| P-value | 5.5E-20 | 1.5E-06 | 5.8E-07 | 5.0E-05 | 0.0027 | 2.9E-04 | |
| Unadj beta (SE)* | - | −0.064 (0.014) | −0.058 (0.009) | - | - | - | |
| Unadj P-value* | - | 5.7E-06 | 7.4E-11 | - | - | - | |
|
| |||||||
|
HMGA2 (rs1042725, T/C) |
N | 68655 | 9649 | 35961 | 36030 | 23277 | 35781 |
| Beta (SE) | −0.047 (0.005) [−23] |
−0.025 (0.015) | −0.018 (0.005) | −0.046 (0.007) | −0.039 (0.009) | −0.016 (0.008) | |
| P-value | 1.4E-19 | 0.096 | 5.5E-04 | 1.7E-10 | 5.4E-06 | 0.049 | |
| Unadj beta (SE)* | - | −0.029 (0.013) | −0.053 (0.007) | - | - | - | |
| Unadj P-value* | - | 0.027 | 1.2E-12 | - | - | - | |
|
| |||||||
|
CDKAL1 (rs6931514, G/A) |
N | 68822 | 9415 | 35789 | 35861 | 22894 | 35614 |
| Beta (SE) | −0.050 (0.006) [−24] |
−0.056 (0.017) | −0.026 (0.006) | −0.035 (0.008) | −0.019 (0.010) | −0.034 (0.009) | |
| P-value | 1.5E-18 | 0.001 | 9.4E-06 | 1.7E-05 | 0.042 | 8.6E-05 | |
| Unadj beta (SE)* | - | −0.045 (0.015) | −0.051 (0.008) | - | - | - | |
| Unadj P-value* | - | 0.003 | 6.7E-10 | - | - | - | |
|
| |||||||
|
5q11.2 (rs4432842, C/T) |
N | 53619 | 6136 | 28465 | 28532 | 20222 | 28290 |
| Beta (SE) | −0.034 (0.006) [−16] |
−0.040 (0.021) | −0.018 (0.006) | −0.023 (0.008) | −0.030 (0.010) | −0.023 (0.009) | |
| P-value | 4.6E-08 | 0.056 | 0.003 | 0.006 | 0.003 | 0.010 | |
| Unadj beta (SE)* | - | −0.043 (0.018) | −0.034 (0.008) | - | - | - | |
| Unadj P-value* | - | 0.018 | 4.6E-05 | - | - | - | |
|
| |||||||
|
LCORL (rs724577, C/A) |
N | 55877 | 8733 | 29956 | 30027 | 21065 | 29781 |
| Beta (SE) | −0.042 (0.006) [−20] |
−0.078 (0.018) | −0.010 (0.006) | −0.047 (0.009) | −0.027 (0.010) | −0.011 (0.010) | |
| P-value | 4.6E-11 | 2.0E-05 | 0.13 | 8.3E-08 | 0.008 | 0.258 | |
| Unadj beta (SE)* | - | −0.071 (0.016) | −0.042 (0.009) | - | - | - | |
| Unadj P-value* | - | 8.4E-06 | 3.8E-06 | - | - | - | |
|
| |||||||
|
ADRB1 (rs1801253, G/C) |
N | 49660 | 6231 | 29695 | 29762 | 17833 | 29519 |
| Beta (SE) | −0.041 (0.007) [−20] |
−0.029 (0.023) | −0.021 (0.006) | −0.027 (0.009) | −0.033 (0.011) | −0.035 (0.009) | |
| P-value | 3.6E-09 | 0.18 | 0.001 | 0.002 | 0.004 | 2.3E-04 | |
| Unadj beta (SE)* | - | −0.036 (0.019) | −0.045 (0.009) | - | - | - | |
| Unadj P-value* | - | 0.058 | 4.3E-07 | - | - | - | |
Results are from inverse variance, fixed-effects meta-analysis of all available study samples of European ancestry. The effect allele for each SNP is labelled on the positive strand according to HapMap. The beta value is the change in trait z score per birth weight-lowering allele from linear regression, adjusted for sex and gestational age (where available), assuming an additive genetic model. To obtain the equivalent birth weight effect in grams, we multiplied by 484g, the median birth weight standard deviation of European studies in 2. There was little detectable heterogeneity between studies (all P > 0.01).
Results are unadjusted for maternal genotype or birth length, but only in samples where maternal genotype or birth length is available (for direct comparison with the model that is adjusted for maternal genotype or birth length, respectively.)
Figure 1.
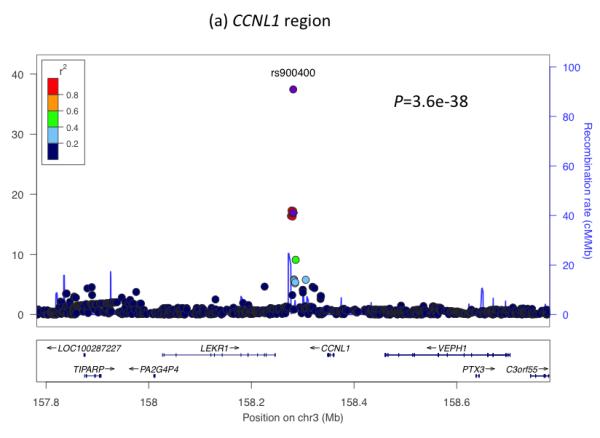
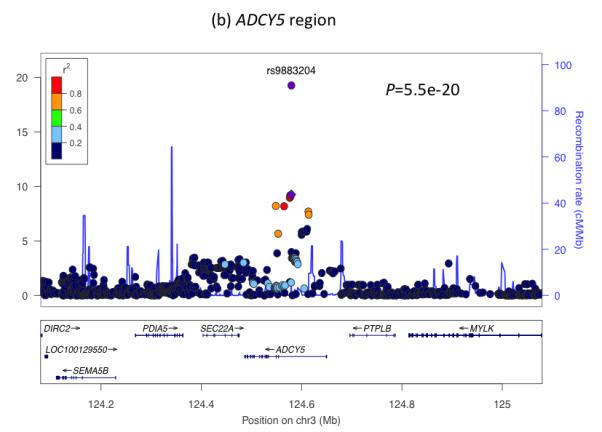
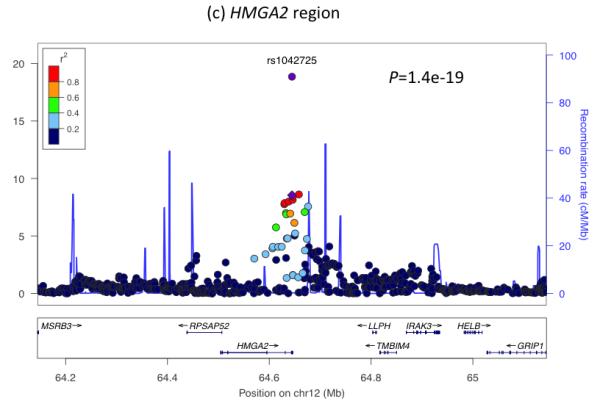
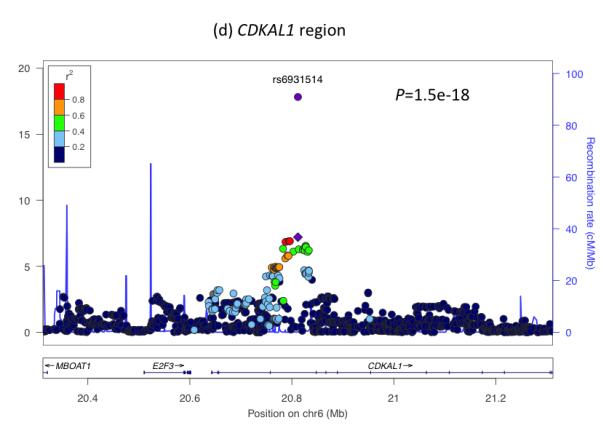
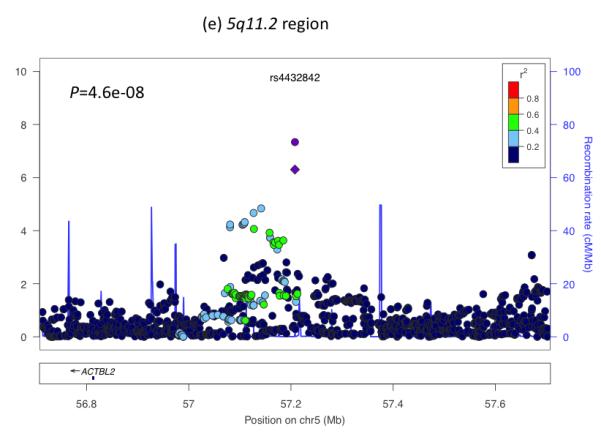
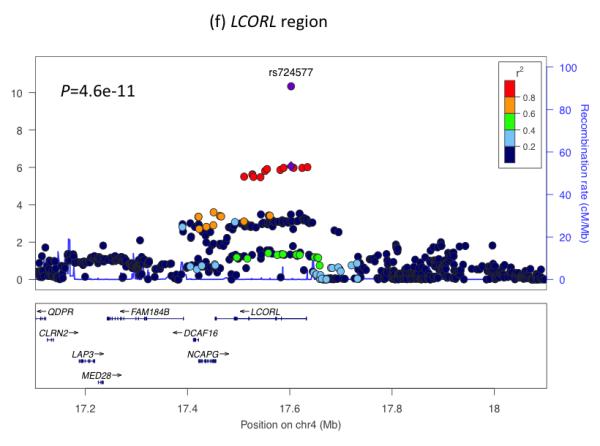
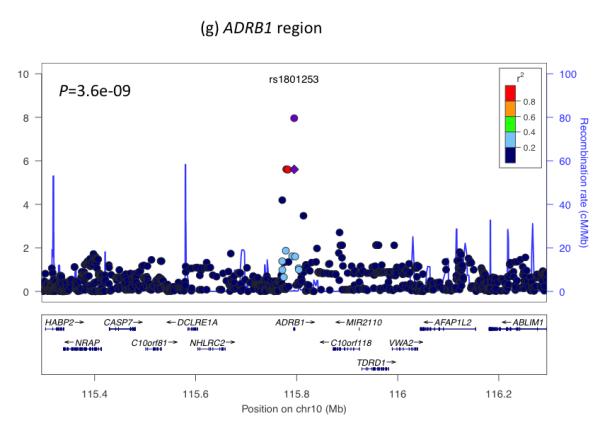
Regional plots of seven loci associated with birth weight at P<5×10⁻⁸. For each of the CCNL1 (a), ADCY5 (b), HMGA2 (c), CDKAL1 (d), 5q11.2 (e), LCORL (f), and ADRB1 (g) regions, SNPs are plotted with their meta-analysis P values (as –log10 values) as a function of genomic position (NCBI Build 36). In each panel, the European discovery stage SNP taken forward for follow-up is represented by a purple circle (with global [discovery + follow-up] meta-analysis P value), with its discovery P value denoted by a purple diamond. Estimated recombination rates (taken from HapMap) are plotted to reflect the local LD structure around the associated SNPs and their correlated proxies (according to a blue to red scale from r2 = 0 to 1, based on pairwise r2 values from HapMap CEU). Gene annotations were taken from the University of California Santa Cruz genome browser.
Through the cellular mechanisms of gametogenesis and fertilization, fetal genotype is correlated with maternal genotype (r ≈ 0.5). Using up to 11,307 mother-child pairs from a subset of studies, we found no evidence that the seven associations we observed at P < 5×10⁻⁸ are driven by the maternal, rather than the fetal, genotype (likelihood-ratio test P >0.05; Table 1).
For five of the seven confirmed associations with birth weight, correspondence with GWAS findings for adult traits (type 2 diabetes, blood pressure or height) provide clues to the biological pathways involved. Two SNPs represent the same signals as known type 2 diabetes loci: ADCY5 (previously reported2) and CDKAL1 (previously examined in smaller candidate gene studies of birth weight3-5). We observed similar z score effect size estimates of the associations between each of these loci and ponderal index (calculated as weight/length3 to indicate neonatal leanness), birth length and head circumference (Table 1), suggesting a general effect on fetal growth. At both loci, the birth weight-lowering allele is associated with greater type 2 diabetes risk2-4. This observation is consistent with the fetal insulin hypothesis6, which proposes that common genetic variation influencing insulin secretion or action, both in prenatal development and adult life, could partly explain epidemiological correlations between lower birth weight and type 2 diabetes. The type 2 diabetes risk allele at ADCY5 is associated with a number of features suggesting impaired insulin secretion: higher glucose levels after fasting and 2 hours after an oral glucose challenge7,8; lower 2-hour insulin levels, adjusted for 2-hour glucose levels8; higher fasting proinsulin (relative to mature insulin) levels9; and lower Homeostatic Model Assessment (HOMA)-derived index of beta-cell function HOMA-B7 (Supplementary Table 5). The risk allele at CDKAL1 is strongly associated with reduced insulin secretion in studies of adults10. Given the key role of fetal insulin in prenatal growth, we hypothesize that the ADCY5 and CDKAL1 risk alleles reduce fetal insulin levels, which mediate the associations with birth weight.
To investigate whether type 2 diabetes susceptibility loci other than ADCY5 and CDKAL1 influence fetal growth, we tested the associations between 47 additional, published type 2 diabetes loci and birth weight in our Stage 1 meta-analysis. We observed more associations with birth weight than expected by chance (Figure 2a), with 7 associations at P < 0.05, of which 4 achieved P < 0.01 (MTNR1B-rs1387153, KCNQ1-rs231362, HHEX- IDE-rs5015480 and GCK-rs4607517), including GCK at P=1×10⁻⁴. Meta-analysis of the HHEX-IDE result with previously published data (total n = 51,583) strengthened the evidence of association (P = 6.9×10⁻⁷; Supplementary Table 6). The type 2 diabetes risk alleles at HHEX-IDE and KCNQ1 follow ADCY5 and CDKAL1 in being associated with lower birth weight, providing additional support for the fetal insulin hypothesis, although the associations can only explain a small fraction of the epidemiological association.
Figure 2.
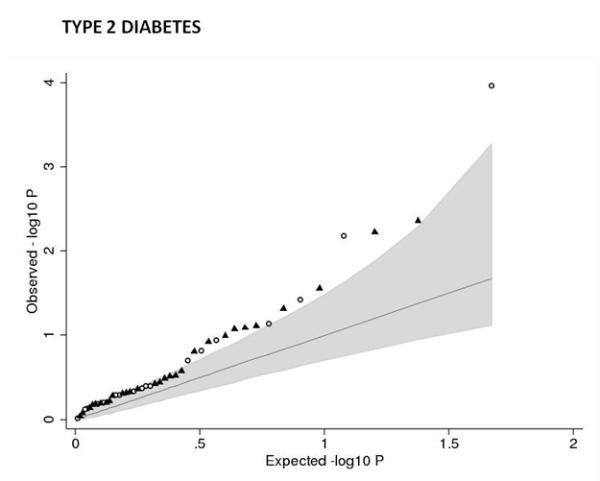
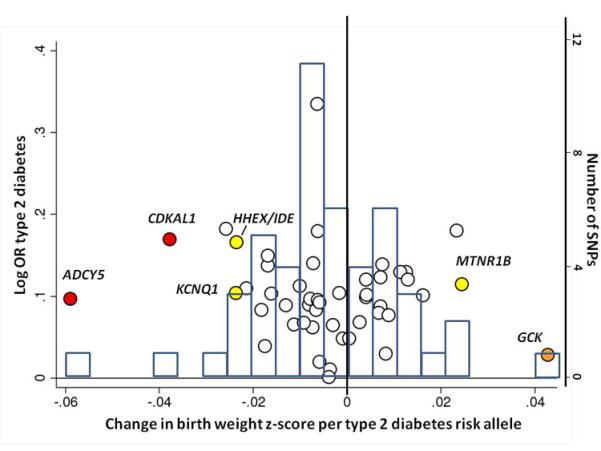
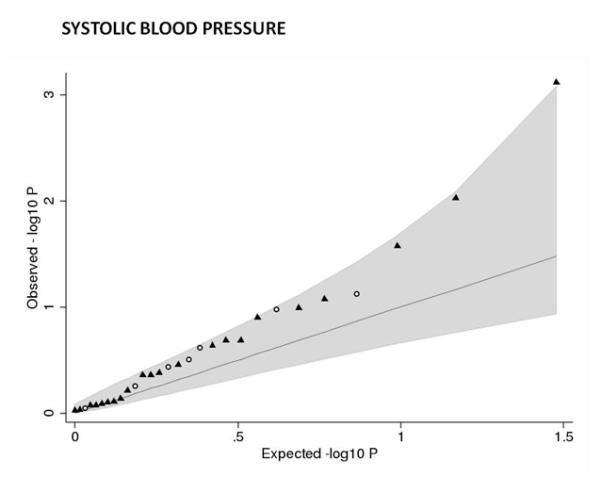
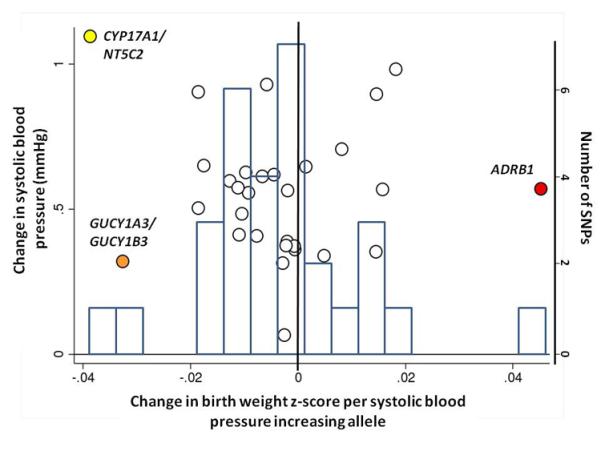
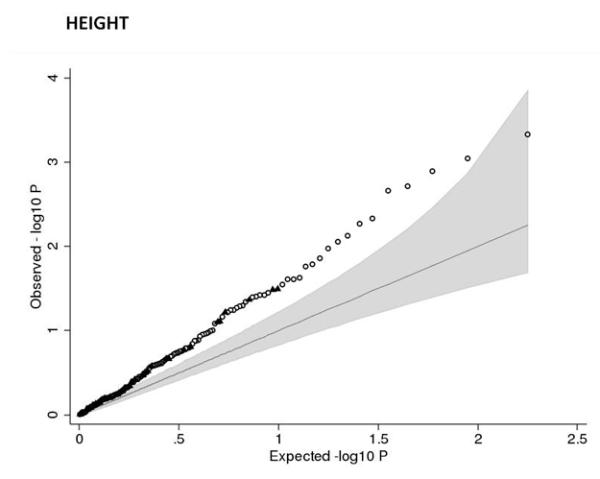
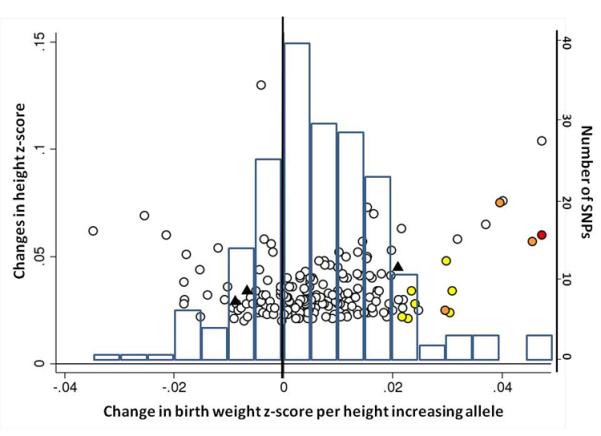
Associations between birth weight and known type 2 diabetes (T2D; a and b), systolic blood pressure (SBP, c and d) or height (e and f) loci from the discovery meta-analysis of N=26,836 individuals. Plots a, c and e are quantile-quantile plots: the black triangles (associated with lower birth weight) and circles (associated with higher birth weight) represent observed P-values after removing the loci that achieved P < 5×10⁻⁸ in the overall meta-analysis, and the black line represents expected P-values under the null. The grey area defines the approximate 95% confidence interval around the expected line. Plots b, d and f show, respectively, the T2D, SBP or height effect size (left-hand y-axis), taken from published meta-analyses14,17,21,22, against the birth weight effect size (x-axis), with a superimposed frequency histogram showing the number of SNPs in each category of birth weight effect size (right-hand y-axis). The odds ratios for type 2 diabetes are all obtained from the published DIAGRAM+ Consortium meta-analysis22, the largest available reference sample of European descent, and while they do not necessarily reach genome-wide significance in that sample, all loci have shown associations with type 2 diabetes at P < 5×10⁻⁸ (see Online Methods for details of published studies). Effect sizes are aligned to the T2D risk allele or the SBP- or height-increasing allele. Colours indicate birth weight association P-values: P<5e-08 (red); P>=5e-08 and P<0.001 (orange); P>=0.001 and P<0.01 (yellow); P>0.01 (white). The triangles in plot f are SNPs known to be associated with age at menarche. There were more associations between height loci and higher birth weight than expected under the null, and a slight excess of associations between T2D or SBP loci and lower birth weight (binomial sign test P = 0.02, 0.09 and 3×10⁻¹⁰ for b, d and f, respectively).
In contrast, the type 2 diabetes risk alleles at GCK and MTNR1B were associated with higher birth weight (Figure 2b). Higher maternal glucose levels are associated with higher offspring birth weight11, and both the GCK and MTNR1B loci influence fasting glucose levels throughout the normal physiological range7. Consistent with this, and with previous studies of the GCK variant12, the effect size estimates we observed for GCK and MTNR1B were lower after adjustment for maternal genotype (Supplementary Figure 5). Well-powered studies of mothers and offspring will be required to test formally the association between maternal genotype and birth weight at these loci. The lack of a fetal association at GCK-rs4607517 contrasts with the strong birth weight-lowering effects of rare, heterozygous fetal GCK mutations13, and suggests that the common GCK variant does not influence insulin secretion until postnatal life.
The association with birth weight at ADRB1 rs1801253 (Arg389Gly) links prenatal growth with blood pressure in adulthood since the same SNP is strongly associated with both systolic and diastolic blood pressure (P<5×10⁻⁸)14. Epidemiological associations between birth weight and systolic blood pressure (SBP) constitute some of the strongest evidence supporting the fetal origins of adult disease15. Most studies report a linear inverse association throughout the birth weight distribution, whereby lower birth weight is associated with higher adult SBP. There is also evidence that birth weights at the high end of the distribution are associated with higher SBP16. Based on the majority of studies, we might therefore expect a fetal SBP-raising allele to be associated with lower birth weight. However, the birth weight-lowering allele at rs1801253 (Gly389) is associated with lower blood pressure in later life. We observed similar effect size estimates for associations between ADRB1 and various birth measures (Table 1), suggesting a general effect on fetal growth. We tested for associations between birth weight and 29 additional blood pressure loci17 in our Stage 1 meta-analysis. While we did not observe strong evidence of deviation from the null (Figure 2c), associations between the SBP-raising allele and lower birth weight achieved P < 0.01 at GUCY1A3/GUCY1B3-rs13139571 (P=0.0008) and CYP17A1/NT5C2-rs11191548 (P=0.009). These were little altered on adjustment for maternal genotype (Figure 2d; Supplementary Table 7).
The associations with birth weight at the HMGA2 and LCORL loci link prenatal growth with postnatal stature. At both loci, the birth weight-lowering allele is also associated with lower adult height and associations are consistent with a primary effect on birth length (Table 1). The HMGA2 SNP is also strongly associated with birth head circumference and is known to associate with head circumference in infancy and intracranial volume in adulthood18,19 suggesting a general effect on growth. Variation at LCORL has also been associated with peak height velocity in infancy20, indicating an effect on growth in childhood. When testing 178 additional published height loci21, we observed more associations with birth weight than expected by chance (Figure 2e), indicating that many adult height loci influence prenatal growth. Of all 180 loci, 132 show the same direction of effect size estimate with birth weight as with height (binomial sign test P=3×10⁻¹⁰), although there is no strong correlation between adult height and birth weight effect sizes (Figure 2f). We did not observe any evidence that these associations were driven by maternal genotypes (Supplementary Table 8).
The remaining two loci (near CCNL1 and on chromosome 5q11.2) are not known to be associated with any other traits. The previously reported association near CCNL1 represents the strongest association with birth weight, and shows a strong association with ponderal index, but relatively weak associations with birth length and head circumference (Table 1), strengthening the evidence that this locus primarily acts through non-skeletal growth. In a subset of 7 studies with available postnatal data, the association had disappeared by 3 months of age (0.001 SD [95% CI: −0.030, 0.032] per rs900400 C-allele, relative to birth weight: −0.084 SD [95%CI: −0.106, −0.062]; Supplementary Table 9; Supplementary Figure 6), suggesting that the growth effects of the CCNL1 locus are specifically intrauterine. Little is known about the birth weight locus at chromosome 5q11.2: the nearest gene, ACTBL2, is approximately 400kb away and has no obvious link with fetal growth. Associations at this locus are similar across the different anthropometric birth measures (Table 1) and there are no associations with adult metabolic or anthropometric traits in published studies (Supplementary Table 5).
We were interested to explore whether the same variants have any impact on birth weight in other ethnic groups. Using data from a range of non-European studies, including those of Middle Eastern, East and Southeast Asian and African origin (total n = 11,848; Supplementary Table 10), we showed that the 7 SNPs together explained between 0.32% and 1.52% of the variance in birth weight, which was similar to that in Europeans (0.76%; Supplementary Table 11; Supplementary Figures 7 and 8).
To conclude, we have identified four, and confirmed three loci associated with birth weight, which explain a similar proportion of variance to maternal smoking exposure in pregnancy (Supplementary Figure 9). The associations between five of the loci and adult traits (i) highlight biological pathways of relevance to the fetal origins of type 2 diabetes, (ii) reveal complexity in that type 2 diabetes risk alleles can be associated with either higher or lower birth weight, (iii) illuminate a novel genetic link between fetal growth and adult blood pressure and (iv) demonstrate substantial overlap between the genetics of prenatal growth and adult height.
ONLINE METHODS
Stage 1: Genome-wide association (GWA) meta-analysis of birth weight: discovery studies, genotyping and imputation
We combined 18 population-based European studies with birth weight and GWA data available (total n = 26,836 individuals): two sub-samples from the 1958 British Birth Cohort (B58C-WTCCC, n = 2,195; B58C-T1DGC, n = 2,037); the Avon Longitudinal Study of Parents And Children (ALSPAC (Discovery); n = 1,418); the Children’s Hospital of Philadelphia (CHOP , n = 7,380); the COpenhagen Prospective Study on Asthma in Childhood (COPSAC-2000, n = 353); the European Prospective Investigation of Cancer (EPIC, n = 1,478); the Erasmus Rucphen Family (ERF) study (n = 325); two sub-samples from the Generation R study (Generation R (Discovery 1), n = 1,194; Generation R (Discovery 2), n = 1,410); the Helsinki Birth Cohort Study (HBCS, n = 1,566); the Lifestyle – Immune System – Allergy (LISA) study (n = 387); the Northern Finland 1966 Birth Cohort (NFBC1966; n = 4,333); two sub-samples of singleton births from the Netherlands Twin Register (NTR1, n = 414; NTR2, n = 247); the Orkney Complex Disease Study (ORCADES, n = 328); the Prevention and Incidence of Asthma and Mite Allergy (PIAMA) study (n = 368); the Raine study (RAINE, n = 1,105); and the Sorbs study (SORBS, n = 298).
While no systematic phenotypic difference is seen between the sub-samples of the 1958 British Birth Cohort, Generation R and Netherlands Twin Register, they were analyzed separately because they were genotyped on different platforms and/or at different times.
Genotypes within each study were obtained using high-density SNP arrays and then imputed for up to ~2.7 million HapMap SNPs (Phase II, release 21/22; http://hapmap.ncbi.nlm.nih.gov/). The basic characteristics, exclusions applied (for example, individuals of non-European ancestry, related individuals), genotyping, quality control and imputation methods for each discovery sample are presented in Supplementary Table 1.
Statistical analysis within discovery studies
Birth weight (BW) was transformed to a z score ([BW value – mean BW]/s.d. BW) to facilitate comparison of the data across studies. Multiple births and, where information was available (see Supplementary Table 1), preterm births (gestational age <37 weeks) were excluded from all analyses. The association between each SNP and birth weight was assessed in each study sample using linear regression of birth weight z score against genotype using an additive genetic model, with sex and, where available, gestational age as covariables. Since gestational age was not available in all studies, we later performed a sensitivity analysis, excluding the studies that did not have this covariable (see below). The GWA analysis was performed using SNPTEST23, mach2qtl24, PLINK25 (http://pngu.mgh.harvard.edu/purcell/plink/), GenABEL26 or ProbABEL27. Details of any additional corrections for study-specific population structure are given in Supplementary Table 1. The data annotation, exchange and storage were facilitated by the SIMBioMS platform (http://www.simbioms.org)28.
Meta-analysis of discovery studies
Prior to meta-analysis, SNPs with a minor allele frequency (MAF) < 0.01 and poorly imputed SNPs (proper_info ≤ 0.4 (SNPTEST); r2hat ≤ 0.3 (mach2qtl)) were filtered. Genomic control (GC)29 was applied to adjust the statistics generated within each cohort (see Supplementary Table 1 for individual study λ values). Inverse variance fixed-effects meta-analyses were undertaken using different software packages METAL (2009-10-10 release)30 and GWAMA (version 2.0.6)31 by two meta-analysts in parallel and compared to obtain identical results. The meta-analysis results were obtained for a total of 2,684,393 SNPs. We applied a second GC correction to adjust the overall meta-analysis statistics (λ = 1.051) before selecting 21 SNPs for follow-up, which surpassed a P-value threshold of P < 1×10⁻⁵. This additional GC correction was, however, only applied for the purpose of choosing the arbitrary significance threshold; we report here Stage 1 P-values after only the first GC correction (see Supplementary Table 2) because a second GC correction is generally considered to be over-conservative32. We additionally selected SNP rs6537307 (P=4.3×10⁻⁵), which is in linkage disequilibrium with a known HHIP height-associated variant (HapMap r2 = 0.58 with rs685478333). Of the 22 selected SNPs, rs1004059 at SYNP02L (P = 2.3×10⁻⁶) was available in only 8 studies since its MAF was close to 0.01. After obtaining data from this SNP from all available Stage 1 studies, we observed a meta-analysis P-value of P = 6×10⁻⁵, and so did not consider it further.
Stage 2: Follow-up of lead signals in European studies
Twenty-one SNPs selected from the discovery meta-analysis were taken forward for either custom genotyping or analysis in studies with newly available genome-wide or CardioMetabochip array genotyping (the latter included 6 of the 21 SNPs). If the index SNP was unavailable, this was substituted with a closely correlated proxy from the HapMap (see Supplementary Table 12). Of a total of 25 available studies (maximum combined n = 42,519), there were 14 studies with custom genotyping (n = 22,569 individuals), of which 2 studies later acquired additional in silico data (ALSPAC (Replication), n = 6,315 with GWA; NFBC1986, n = 4,897 with CardioMetabochip). Eight further studies had in silico GWA data (n = 13,992 individuals) and 3 further studies had in silico CardioMetabochip array data (n = 5,958 individuals). Details of these studies are presented in Supplementary Table 3. Since resources for custom genotyping were limited, the total number of analyzed individuals varied by SNP, with 3 SNPs analysed in available in silico studies only (see Supplementary Table 2). Within each study, we analysed the association between each available SNP and birth weight z score in the same way as described above for Stage 1 studies.
Combined discovery and follow-up meta-analyses
We performed fixed effects inverse variance meta-analyses of the association between each SNP and birth weight, including up to 43 discovery and follow-up samples of European descent (maximum total n = 69,308). Individual study results for any SNP showing strong evidence of deviation from Hardy-Weinberg Equilibrium (P <1×10⁻⁴) were excluded. Meta-analyses were performed in parallel at two different study centres, using two software packages in parallel (METAL 2009-10-10 release30 and GWAMA ver.2.0.631. We used Cochran’s Q test and the derived inconsistency statistic, I2 34 to assess evidence of between-study heterogeneity of effect size. Results that crossed the widely accepted genome-wide significance threshold of P < 5×10⁻⁸ were considered to represent robust evidence of association.
Sensitivity analyses and phenotypic data quality checks
The ascertainment and availability of phenotype data varied widely among the 43 studies (see Supplementary Tables 1 and 3). For example, birth weight was measured by trained personnel in some studies, but in others was self-reported in adulthood. Gestational age was not available as a covariable in all studies. We therefore performed further analyses to verify data quality and check that the effect size estimates in our meta-analyses were not greatly influenced by poor quality data or lack of adjustment for gestational age.
To identify any studies that showed unusual relationships between birth weight and other phenotypes, we obtained from each study the percentage of variance in birth weight explained by each of sex, parity, maternal smoking, gestational age and maternal pre-pregnancy BMI as 100*adjusted-R2 value from linear regression of birth weight against each individual trait. The observed relationships between birth weight and each related trait were reasonably consistent across all of the 43 studies (see Supplementary Table 13 and Supplementary Figure 9).
To assess whether adjustment for gestational age or measurement/recall bias of birth weight influenced the associations between each of the 21 SNPs and birth weight, we repeated the fixed-effects inverse-variance meta-analyses of the European results in three different sub-sets of studies: (i) studies with birth weight collected by any method that adjusted for gestational age (n = 35); (ii) studies with measured or medical record of birth weight that adjusted for gestational age only where available (n = 26); (iii) studies with measured or medical record of birth weight which also adjusted for gestational age (n = 24). We compared the effect size estimates between each of these three meta-analyses and the overall meta-analysis result (Supplementary Table 4).
Associations between birth weight and seven confirmed loci in non-European samples of varying ancestry
Using 8 study samples of varying ancestry, we investigated the 7 loci, which showed genome-wide significant associations with birth weight in the combined meta-analysis of European discovery and follow-up studies. The 8 non-European studies were from East/Southeast Asia (Chinese and Filipino), Africa (African-American, Mandinka and Moroccan), Middle East (Arab, Turkish), and South America (Surinamese) (total n = 11,848; Supplementary Table 10). Samples were genotyped either by custom SNP assay (2 studies), CardioMetabochip (1 study) or genome-wide chip (5 studies). The index SNP from the European meta-analysis was taken forward as the index SNP for the non-European analyses, and associations with birth weight were analysed as described above. If the index SNP was unavailable, it was substituted with a closely correlated ancestry-specific proxy from the 1000 Genomes Pilot 1 YRI and JPT+CHB samples (released June 2010), which was found using SNAP (http://www.broadinstitute.org/mpg/snap/; see Supplementary Table 12). In the 5 studies with GWA data, we considered all SNPs within 250-kb either side of the European index SNP.
We performed three analyses:
Meta-analysis of single SNP associations with birth weight: we performed fixed-effects inverse variance meta-analyses of available studies, as described above, for each of the 7 loci.
Ethnicity-specific regional analysis: we performed fixed effects inverse variance meta-analyses for SNPs within the 500 kb surrounding the 7 index SNPs in an ethnicity-specific manner for n = 2,135 East/Southeast Asian and n = 6,315 African-American samples. We plotted the association results against chromosomal position using LocusZoom (http://csg.sph.umich.edu/locuszoom/).
Combined genotype risk score analysis: to assess the associations between birth weight and the 7 confirmed loci in combination, we created a risk allele count (RAC) by summing the birth-weight lowering alleles at each SNP. We performed this analysis in 7 non-European studies in which 6 to 7 SNPs were available (combined n = 11,014) and one representative European Stage 2 study (NFBC1986, n = 4647). If a SNP was missing, all individuals were assigned a value of 2*frequency (HapMap, ethnicity-specific) of the birth weight-lowering allele. We performed linear regression of birth weight z score against RAC (additive model), with sex and gestational age (where available) as covariables. A genetic risk score, weighted by effect size in Europeans, gave similar results in all non-European studies (data not shown).
Variance explained
To estimate the percentage of variation in birth weight explained jointly by the 7 confirmed birth weight loci, we obtained the adjusted-R2 from univariate linear regression of birth weight against risk allele count in 6 non-European studies and one European study (NFBC1986).
Analysis of additional anthropometric phenotypes measured at birth: birth length, birth head circumference, ponderal index
Where available, in both Stage 1 and 2 European studies, we created within-study z scores for birth length (available from 27 studies, n = 36,084), birth head circumference (20 studies, n = 23,277), and ponderal index (calculated as birth weight/length3, 27 studies, n = 35,836). The z scores were calculated by the same method as was used for birth weight. We used linear regression to assess the association between each outcome and each of the 7 confirmed birth weight SNPs, with sex and gestational age (where available) as covariables. We combined the results across studies using fixed-effects inverse variance meta-analysis.
Analysis of birth weight adjusted for birth length
Where both birth weight and birth length were available, we used linear regression to assess the association between birth weight z score and the 7 confirmed birth weight SNPs, with sex, gestational age (where available) and birth length as covariables. In the same set of samples, we again performed linear regression to assess the association between birth weight z score and SNP, with only sex and gestational age (where available) as covariables to allow direct comparison of analyses with and without adjustment for birth length. Meta-analysis was performed as above.
Analysis of birth weight adjusted for maternal genotype
To assess whether the birth weight associations at the seven confirmed birth weight loci were independent of maternal genotype, we used mother-offspring pairs from up to 10 European studies with both maternal and fetal genotype available (Discovery n = 7,879, Follow-up n = 3,428, total n = 11,307). Within each study, we performed linear regression of birth weight z score against each of the SNPs, with sex, gestational age (where available) and maternal genotype as covariables. For direct comparison, we repeated this without maternal genotype, using only subjects for whom maternal genotype was available. Fixed effects inverse variance meta-analysis was performed to combine results across studies for (i) fetal genotype, and (ii) fetal genotype adjusted for maternal genotype. We performed a likelihood ratio test to compare the model fit before and after adjustment for maternal genotype.
Analysis of associations between known type 2 diabetes, blood pressure, height and BMI loci and birth weight
Of the seven confirmed birth weight loci, five had previously been associated with either type 2 diabetes (CDKAL1 and ADCY5), blood pressure (ADRB1) or adult height (LCORL and HMGA2). To assess whether association with birth weight is a common feature of loci associated with these adult traits, we extracted results from our Stage 1 discovery meta-analysis for 49 published type 2 diabetes SNPs7,22,35-48, 180 height SNPs21 and 30 blood pressure SNPs14,17. To complement these analyses, we analyzed the associations between the same sets of SNPs and birth weight z score in n = 5,327 mother-child pairs from the ALSPAC study. We adjusted for sex and gestational age, recorded the results before and after adjustment for maternal genotype and compared the fit of the two models using a likelihood ratio test to assess evidence of confounding by maternal genotype. This was particularly important for the analyses of type 2 diabetes SNPs since there is evidence that at least two of the known loci influence birth weight via the maternal genotype49,50. For each set of loci, we used the binomial probability (sign) test, available at http://faculty.vassar.edu/lowry/binomialX.html, to assess whether there was more evidence of negative or positive associations with birth weight than the 50% expected under the null.
For the HHEX-IDE (type 2 diabetes) locus, there are previously-published studies reporting associations with birth weight, not all of which overlap with our Stage 1 Discovery samples4,5. To obtain an approximate overall result for this locus, we therefore meta-analyzed (inverse variance, fixed effects) our Stage 1 result with additional published data from the ALSPAC, Inter99 and EFSOCH studies and in silico data available from Stage 2 (total n = 51,583). Two SNPs at the locus were represented in the meta-analysis: rs1111875 and rs5015480 (r2 = 0.97). Since the effect sizes for the published studies were in grams, we first converted them to equivalent z-score values by dividing effect size estimates and 95% confidence limits by 484 (the median standard deviation of birth weight in grams, from our previous GWA study of birth weight)2.
Analysis of the associations between seven confirmed birth weight loci and adult metabolic and anthopometric traits in publicly available results of GWA meta-analyses
We looked up the 7 confirmed birth weight index SNPs in publicly available published meta-analysis datasets to assess their associations with adult metabolic and anthropometric traits: (i) fasting glucose and fasting insulin7, (ii) fasting proinsulin9, (iii) triglycerides, total cholesterol, low density lipoprotein (LDL) cholesterol and high density lipoprotein (HDL) cholesterol51, (iv) height21 and (v) BMI52.
Analysis of the association between CCNL1 and weight up to 6 months in seven studies
We used available postnatal weight data from the EFSOCH, Generation R (Discovery 1), Generation R (Discovery 2), LISA, HBCS, NFBC1966 and NFBC1986 (maximum total n = 15,090). Each study analysed weight data at the following time points, where available: birth; 1 (+/− 0.2) month; 2 (+/− 0.2) months; 3 (+/− 0.3) months; 6 (+/− 0.4) months. Within each study, we created weight-for-age z scores for each of the postnatal time points using Growth Analyser 3.0 (http://www.growthanalyser.org; Dutch Growth Research Foundation, Rotterdam, the Netherlands). The reference was a cohort of 475,588 children born between 1977 and 1981 in Sweden53. Birth weight was analysed as described above. At each subsequent time point, we performed linear regression of weight-for-age z score against rs900400 genotype (or designated proxy SNP, see Supplementary Table 12), with gestational age at birth as a covariable. We combined the results across studies using fixed effects inverse variance meta-analysis.
Supplementary Material
ACKNOWLEDGMENTS
See Supplementary Note. Major funding for the research in this paper is as follows: Academy of Finland (project grants 126925, 121584, 124282, 129378 (Salve), 117787 (Gendi), and 41071 (Skidi), 209072, 129255, 104781, 120315, 129269, 1114194, 206374, 251360, 139900/24300796, Center of Excellence in Complex Disease Genetics and SALVE) and Biocentrum Helsinki; Arthritis Research UK; Augustinus Foundation; Biobanking and Biomolecular Resources Research Infrastructure (BBMRI–NL); Biomedical Research Council, Singapore BMRC 06/1/21/19/466; BIF: Boehringer Ingelheim Fonds (travel grant to AT); British Heart Foundation; C.G. Sundell Foundation; Canadian Institutes of Health Research (Grant ID MOP-82893); Cancer Research United Kingdom; Chief Scientist Office of the Scottish Government; Children’s Hospital of Philadelphia (Institute Development Award); Conselleria de Sanitat Generalitat Valenciana; Copenhagen Graduate School of Health Sciences; Cotswold Foundation (Research Development Award); Curtin University and Women and Infants Research Foundation; Danish Health Insurance Societies (Health Fund); Danish Medical Research Council; Danish National Research Foundation; Danish Pediatric Asthma Centre; Danish Pharmacists’ Fund; Danish Strategic Research Council; Darlington Trust; Department of Health and Social Services in Northern Ireland; Deutsche Forschungsgemeinschaft (DFG); DHFD, Diabetes Hilfs- und Forschungsfonds Deutschland (travel grant to MS); Diabetes UK (grants RD08/0003704, RD08/0003692); Dunhill Medical Trust; Dutch Asthma Foundation (grant 3.4.01.26, 3.2.06.022, 3.4.09.081 and 3.2.10.085CO); Dutch ministry of the environment; EFRE: Europäische Fonds für regionale Entwicklung (LIFE Child Obesity); Egmont Foundation; Else Kröner-Fresenius Foundation; Emil Aaltonen Foundation (T.L); ENGAGE project and grant agreement HEALTH-F4-2007-201413; Erasmus Medical Center; Erasmus University Rotterdam; European Commission (EURO-BLCS, Beta-JUDO, Framework 5 award QLG1-CT-2000-01643, GABRIEL (Integrated Program LSH-2004-1.2.5-1 contract number 018996), framework program 6 EUROSPAN project (contract no. LSHG-CT-2006-018947), Sixth RTD Framework Programme (Contract FOOD-CT-2005-007034), Seventh Framework Program (FP7/2007-2013)); European Research Council (ERC Advanced, 230374); European Science Foundation (ESF, EU/QLRT-2001-01254); Exeter NHS Research and Development; Faculty of Biology and Medicine of Lausanne; Finnish Foundation of Cardiovascular Research; Finnish Cultural Foundation; Finnish Innovation Fund Sitra; Finnish Ministry of Education and Culture; Finnish Ministry of Social Affairs and Health; Finnish Social Insurance Institution; Foundation for Paediatric Research; Fundació La Marató de TV3; Fundación Roger Torné; Generalitat de Catalunya-CIRIT 1999SGR 00241; German Diabetes Association (to AT); German Bundesministerium fuer Forschung und Technology (grants 01 AK 803 A-H, 01 IG 07015 G); German Research Foundation for the Clinical Research Group “Atherobesity” KFO 152 (KO3512/1 to AK); GlaxoSmithKline; Hagedorn Research Institute; Instituto de Salud Carlos III (CB06/02/0041, FIS PI041436, PI081151, PI041705, and PS09/00432, FIS-FEDER 03/1615, 04/1509, 04/1112, 04/1931, 05/1079, 05/1052, 06/1213, 07/0314, and 09/02647); Interdisciplinary Centre for Clinical Research at the University of Leipzig (B27 to AT, MS); Integrated Research and Treatment Centre (IFB) Adiposity Diseases; Jackstädt-Foundation; Juho Vainio Foundation; Juvenile Diabetes Research Foundation International (JDRF); Kuopio, Tampere and Turku University Hospital Medical Funds (grant 5031343 for Timo Lakka; grant 9M048 for TeLeht); The Lundbeck Foundation; Lundbeck Foundation Centre of Applied Medical Genomics for Personalized Disease Prediction, Prevention and Care (LuCAMP); March of Dimes Birth Defects Foundation (6-FY09-507); Medical Research Council, UK (Grant ref: 74882, G0000934, G0601653, G0500539, G0600705, G0601261, G0600331, PrevMetSyn/SALVE PS0476; MC-A760-5QX00); Munich Center of Health Sciences (MC Health); National Health and Medical Research Council of Australia (Grant ID 403981 and ID 003209); National Human Genome Research Institute; National Institute of Allergy and Infectious Diseases; National Institute of Child Health and Human Development; National Institute of Diabetes and Digestive and Kidney Diseases (NIDDK); National Institutes of Health (U01DK062418; U01HG004423; U01HG004446; U01HG004438; R01DK075787; R01HD056465; 1R01HD056465-01A; R01D0042157-01A; DK078150; TW05596; HL085144; HD054501; RR20649; ES10126; DK56350; ‘Biomedical Research Centres’ funding); NBIC/BioAssist/RK/2008.024; NHLBI grant 5R01HL087679-02 through the STAMPEED program (1RL1MH083268-01); NIH Genetic Association Information Network (GAIN); NIH/NIMH (5R01MH63706:02, MH081802); Rutgers University Cell and DNA Repository cooperative agreement (NIMH U24 MH068457-06); Novo Nordisk Foundation Center for Basic Metabolic Research; Center for Medical Systems Biology (CMSB, NWO Genomics); Netherlands Organization for Scientific Research (NWO: MagW/ZonMW (Middelgroot-911-09-032, Spinozapremie 56-464-14192, 904-61-090, 904-61-193, 480-04-004, 400-05-717, Addiction-31160008, 985-10-002, 40-0056-98-9032, 912-03-031); Paavo Nurmi Foundation; Peninsula NIHR Clinical Research Facility; Pharmacy Foundation of 1991; PhD School of Molecular Metabolism University of Southern Denmark; Raine Medical Research Foundation; Royal Society; Sigrid Juselius Foundation; South West NHS Research and Development; Spanish Ministry of Science and Innovation (SAF2008-00357), Turku Univ Hospital; Swiss National Science Foundation (33CSCO-122661); Tampere Tuberculosis Foundation; Telethon Institute for Child Health Research; Turku University Foundation; U.S. Centers for Disease Control and Prevention; University Hospital Oulu, Biocenter, University of Oulu, Finland (75617); University of Bristol; University of Potsdam, Germany; University of Southampton, UK; University of Western Australia (UWA); VU University’s Institute for Health and Care Research (EMGO+) and Neuroscience Campus Amsterdam (NCA); Wellcome Trust (grants GR069224, WT088806, 068545/Z/02, 076467, 085301, 090532, 083270, 083948, 085541/Z/08/Z, WT089549; WT083431MA); Yrjö Jahnsson Foundation.
Footnotes
AUTHOR CONTRIBUTIONS
Discussion group (decided upon analyses specific to the project): J.P.B., T.M.F., R.M.F. (co-lead/chair), S.F.A.G., M.H., V.W.V. J., M.-R.J., M.I.M., D.O.M.-K., C.E.P., I.P. (co-lead), N.J.T., H.Y.
Writing group (drafted and edited manuscript): T.M.F., R.M.F. (co-lead/chair), B.J.H., M.H. (co-lead), V.W.V.J., M.-R.J., M.I.M., D.O.M.-K., I.P., H.R.T., N.J.T., H.Y. (co-lead).
Meta-analyses and other key analyses:
Stage 1, Discovery meta-analysis: R.M.F. (lead), J. Heikkinen (data exchange), D.O.M.-K, I.P., U.S.
Stage 2, Follow-up and overall meta-analysis: R.M.F., M.H. (co-lead), I.P., H.Y. (co-lead).
Sensitivity meta-analyses: R.M.F., H.Y. (lead).
Analyses of known type 2 diabetes, blood pressure and height loci (including ALSPAC mother-child pair analyses): R.M.F. (lead), D.A.L., N.J.T., H.Y.
Postnatal data analysis: D.L.C., R.M.F., M. Kaakinen, D.O.M.-K. (lead), E.T., U.S.
Trans-ethnic analyses and genotype risk score analysis: M.H. (lead), I.P. (chair), N.J.T., H.Y., [CHOP] J.P.B., H.H., S.F.A.G., [CLHNS] Y.W., K.L.M., [Generation R] H.R.T., V.W.V.J., [MRC Keneba] BJ.H., A.J.F., A.M.P., [SAUDI] D.O.M.-K., F.S.A., B.F.M., [SCORM] L.-K.G., S.-M.S.
Cohort-specific contributions:
Project design: (B58C) E.H., C.P.; (ALSPAC) D.A.L., G.D.S., N.J.T.; (BBC) B.H., M.I.M.; (CHOP) J.P.B., S.F.A.G., H.H., J.Z.; (CLHNS) L.S.A., K.L.M.; (COLAUS) P.V.; (COPSAC-2000) H.B.; (COPSAC-REGISTRY) H.B., K.B.; (DNBC) M.M.; (EFSOCH) T.M.F., A.T.H.; (EPIC/EPIC-Norfolk) K.K.O.; (Generation R) A.H., V.W.V.J., D.O.M-K.; (HBCS) J.G.E.; (HCS) C.C.; (HELENA) F.G., L.A.M.; (INMA) X.E.; (Leipzig-Kids) A.K.; (LISAplus & GINIplus) J. Heinrich; (MRC Keneba) A.J.F., B.J.H., A.M.P.; (NFBC1966/NFBC1986) M-R.J., U.S.; (NTR) D.I.B.; (ORCADES) J.F.W.; (PANIC) T.A.L.; (PIAMA) M. Kerkhof., G.H.K., D.S.P.; (RAINE) J.P.N., C.E.P.; (SAUDI) F.S.A., B.F.M.; (SCORM) L-K.G., S-M.S.; (SORBS) M. Stumvoll, A.T.; (STRIP) H.N., O.T.R., O.S.; (SWS) K.M.G., H.M.I.; (TEENAGE) G.V.D., I.N.; (YF) T.L., J.S.V.; (Young Hearts Project) C.A.G.B.
Sample collection and phenotyping: (B58C) D.J.B., E.H., C.P.; (ALSPAC) D.A.L., G.D.S.; (BBC) B.H., T.P., T.S.; (CHOP) H.H.; (CLHNS) L.S.A., C.W.K.; (COLAUS) P.V.; (COPSAC-2000) H.B., L.P., N.H.V.; (COPSAC-REGISTRY) H.B., K.B., M.V.H., D.M.H., E.K-M.; (DNBC) B.F., F.G., M.M.; (EFSOCH) A.T.H., B.A.K., B.M.S.; (EPIC/EPIC-Norfolk) K.K.O.; (ERF) B.A.O., C.M.v.D.; (Generation R) A.H., V.W.V.J., D.O.M-K., H.R.T.; (GoDARTS) E.R.P.; (HBCS) J.G.E.; (HELENA) F.G., L.A.M.; (INMA) M.G.; (Inter99) T.H., T.J., O.P., A.V., D.R.W.; (Leipzig-Kids) A.K.; (LISAplus & GINIplus) C.F.; (MRC Keneba) A.J.F.; (NFBC1966/NFBC1986) M-R.J., M. Kaakinen, A.P.; (NTR) D.I.B., E.J.C.d.G., J.M.V., G.W.; (ORCADES) J.F.W.; (PANIC) T.O.K., T.A.L., V. Lindi; (PIAMA) M. Kerkhof., G.H.K., D.S.P.; (Project Viva) M.W.G.; (RAINE) J.P.N., C.E.P.; (SAUDI) A.A-O., B.F.M., D.M.M.; (SCORM) L-K.G., S-M.S.; (SORBS) M. Stumvoll, A.T.; (STRIP) H.N., O.T.R., O.S.; (SWS) K.M.G.; (TEENAGE) C.K-G., I.N.; (YF) T.L., J.S.V.; (Young Hearts Project) C.A.G.B.
Genotyping: (B58C and B58C-Replication) A.J.B., C.J.G., M.I.M., N.R.R.; (ALSPAC) J.P.K., G.M.,S.M.R.; (BBC) A.J.B., B.H., M.I.M., T.P., N.R.R., T.S.; (CHOP) S.F.A.G., H.H.; (COPSAC-REGISTRY) M.V.H., D.M.H.; (EFSOCH) T.M.F., R.M.F.; (EPIC/EPIC-Norfolk) R.J.F.L., N.J.W., K.K.O.; (ERF) B.A.O., C.M.v.D.; (Generation R) F.R., A.G.U.; (GoDARTS) K.Z.; (HBCS) E.W.; (HCS) J.W.H.; (HELENA) J.D., A. Meirhaeghe.; (INMA) M.B.; (Inter99) E.A.A., T.H., M.N.H.; (Leipzig-Kids) A.K.; (LISAplus & GINIplus) N.K., C.M.T.T.; (MRC Keneba) B.J.H.; (NFBC1966/NFBC1986) A.I.F.B., J.L.B., P.F., M.I.M.; (NTR) J-J.H.; (ORCADES) J.F.W.; (PANIC) T.A.L., V. Lindi.; (PIAMA) M. Kerkhof, G.H.K., D.S.P.; (Project Viva) J.N.H., R.M.S.; (RAINE) J.P.N., C.E.P.; (SAUDI) B.F.M., D.M.M.; (SCORM) S-M.S.; (SORBS) M. Stumvoll; (STRIP) O.T.R.; (SWS) J.W.H.; (TEENAGE) A.J.B., C.J.G., M.I.M., N.R.R.; (YF) T.L.; (Young Hearts Project) P.A., A. Meirhaeghe.
Statistical analysis: (B58C) D.J.B.; (B58C-Replication) M.H.; (ALSPAC) D.M.E., B.S.P., N.J.T.; (BBC) B.H., M.H., T.P., T.S.; (CHOP) J.P.B., S.F.A.G., H.Z.; (CLHNS) Y.W.; (COLAUS) Z.K.; (COPSAC-2000) E.K-M.; (COPSAC-REGISTRY) E.K-M.; (DNBC) B.F., F.G.; (EFSOCH) R.M.F., H.Y.; (EPIC/EPIC-Norfolk) M.d.H., J.H.Z.; (ERF) A.I.; (Generation R) D.O.M-K., H.R.T.; (GoDARTS) E.R.P., K.Z.; (HBCS) D.L.C.; (HCS) K.A.J.; (HELENA) A. Meirhaeghe; (INMA) M.B.; (Inter99) E.A.A., M.N.H.; (Leipzig-Kids) A. Mahajan; (LISAplus & GINIplus) E.T.; (MRC Keneba) A.J.F., B.J.H.; (NFBC1966/NFBC1986) P.C., S.D., M.H., M. Kaakinen., I.P., S.S., U.S.; (NTR) J-J.H.; (ORCADES) M. Kirin; (PANIC) V. Lindi.; (PIAMA) M. Kerkhof; (Project Viva) M.W.G., J.N.H., R.M.S.; (RAINE) N.M.W.; (SAUDI) D.O.M-K.; (SCORM) L-K.G., S-M.S.; (SORBS) V.Lagou, I.P.; (STRIP) O.T.R., M. Saarinen; (SWS) S.J.B., H.M.I.; (TEENAGE) I.N., M.H.; (YF) D.L.C., E.W.; (Young Hearts Project) P.A., A. Meirhaeghe.
COMPETING FINANCIAL INTERESTS The authors declare no competing financial interests.
REFERENCES
- 1.Godfrey KM, Barker DJ. Fetal nutrition and adult disease. Am J Clin Nutr. 2000;71:1344S–52S. doi: 10.1093/ajcn/71.5.1344s. [DOI] [PubMed] [Google Scholar]
- 2.Freathy RM, et al. Variants in ADCY5 and near CCNL1 are associated with fetal growth and birth weight. Nat Genet. 2010;42:430–5. doi: 10.1038/ng.567. [DOI] [PMC free article] [PubMed] [Google Scholar]
- 3.Zhao J, et al. Examination of type 2 diabetes loci implicates CDKAL1 as a birth weight gene. Diabetes. 2009;58:2414–8. doi: 10.2337/db09-0506. [DOI] [PMC free article] [PubMed] [Google Scholar]
- 4.Andersson EA, et al. Type 2 diabetes risk alleles near ADCY5, CDKAL1 and HHEX-IDE are associated with reduced birthweight. Diabetologia. 2010;53:1908–16. doi: 10.1007/s00125-010-1790-0. [DOI] [PubMed] [Google Scholar]
- 5.Freathy RM, et al. Type 2 diabetes risk alleles are associated with reduced size at birth. Diabetes. 2009;58:1428–33. doi: 10.2337/db08-1739. [DOI] [PMC free article] [PubMed] [Google Scholar]
- 6.Hattersley AT, Tooke JE. The fetal insulin hypothesis: an alternative explanation of the association of low birthweight with diabetes and vascular disease. Lancet. 1999;353:1789–92. doi: 10.1016/S0140-6736(98)07546-1. [DOI] [PubMed] [Google Scholar]
- 7.Dupuis J, et al. New genetic loci implicated in fasting glucose homeostasis and their impact on type 2 diabetes risk. Nat Genet. 2010;42:105–16. doi: 10.1038/ng.520. [DOI] [PMC free article] [PubMed] [Google Scholar]
- 8.Saxena R, et al. Genetic variation in GIPR influences the glucose and insulin responses to an oral glucose challenge. Nat Genet. 2010;42:142–8. doi: 10.1038/ng.521. [DOI] [PMC free article] [PubMed] [Google Scholar]
- 9.Strawbridge RJ, et al. Genome-wide association identifies nine common variants associated with fasting proinsulin levels and provides new insights into the pathophysiology of type 2 diabetes. Diabetes. 2011;60:2624–34. doi: 10.2337/db11-0415. [DOI] [PMC free article] [PubMed] [Google Scholar]
- 10.Steinthorsdottir V, et al. A variant in CDKAL1 influences insulin response and risk of type 2 diabetes. Nat Genet. 2007;39:770–5. doi: 10.1038/ng2043. [DOI] [PubMed] [Google Scholar]
- 11.Metzger BE, et al. Hyperglycemia and adverse pregnancy outcomes. N Engl J Med. 2008;358:1991–2002. doi: 10.1056/NEJMoa0707943. [DOI] [PubMed] [Google Scholar]
- 12.Freathy RM, et al. Hyperglycemia and Adverse Pregnancy Outcome (HAPO) study: common genetic variants in GCK and TCF7L2 are associated with fasting and postchallenge glucose levels in pregnancy and with the new consensus definition of gestational diabetes mellitus from the International Association of Diabetes and Pregnancy Study Groups. Diabetes. 2010;59:2682–9. doi: 10.2337/db10-0177. [DOI] [PMC free article] [PubMed] [Google Scholar]
- 13.Hattersley AT, et al. Mutations in the glucokinase gene of the fetus result in reduced birth weight. Nat Genet. 1998;19:268–70. doi: 10.1038/953. [DOI] [PubMed] [Google Scholar]
- 14.Johnson AD, et al. Association of hypertension drug target genes with blood pressure and hypertension in 86,588 individuals. Hypertension. 2011;57:903–10. doi: 10.1161/HYPERTENSIONAHA.110.158667. [DOI] [PMC free article] [PubMed] [Google Scholar]
- 15.Lenfant C. Low birth weight and blood pressure. Metabolism. 2008;57(Suppl 2):S32–5. doi: 10.1016/j.metabol.2008.07.013. [DOI] [PubMed] [Google Scholar]
- 16.Gamborg M, et al. Birth weight and systolic blood pressure in adolescence and adulthood: meta-regression analysis of sex- and age-specific results from 20 Nordic studies. Am J Epidemiol. 2007;166:634–45. doi: 10.1093/aje/kwm042. [DOI] [PubMed] [Google Scholar]
- 17.Ehret GB, et al. Genetic variants in novel pathways influence blood pressure and cardiovascular disease risk. Nature. 2011;478:103–9. doi: 10.1038/nature10405. [DOI] [PMC free article] [PubMed] [Google Scholar]
- 18.Ikram MA, et al. Common variants at 6q22 and 17q21 are associated with intracranial volume. Nat Genet. 2012;44:539–544. doi: 10.1038/ng.2245. [DOI] [PMC free article] [PubMed] [Google Scholar]
- 19.Taal HR, et al. Common variants at 12q15 and 12q24 are associated with infant head circumference. Nat Genet. 2012;44:532–538. doi: 10.1038/ng.2238. [DOI] [PMC free article] [PubMed] [Google Scholar]
- 20.Sovio U, et al. Genetic determinants of height growth assessed longitudinally from infancy to adulthood in the northern Finland birth cohort 1966. PLoS Genet. 2009;5:e1000409. doi: 10.1371/journal.pgen.1000409. [DOI] [PMC free article] [PubMed] [Google Scholar]
- 21.Lango Allen H, et al. Hundreds of variants clustered in genomic loci and biological pathways affect human height. Nature. 2010;467:832–8. doi: 10.1038/nature09410. [DOI] [PMC free article] [PubMed] [Google Scholar]
- 22.Voight BF, et al. Twelve type 2 diabetes susceptibility loci identified through large-scale association analysis. Nat Genet. 2010;42:579–89. doi: 10.1038/ng.609. [DOI] [PMC free article] [PubMed] [Google Scholar]
- 23.Marchini J, Howie B, Myers S, McVean G, Donnelly P. A new multipoint method for genome-wide association studies by imputation of genotypes. Nat Genet. 2007;39:906–13. doi: 10.1038/ng2088. [DOI] [PubMed] [Google Scholar]
- 24.Li Y, Willer CJ, Ding J, Scheet P, Abecasis GR. MaCH: using sequence and genotype data to estimate haplotypes and unobserved genotypes. Genet Epidemiol. 2010;34:816–34. doi: 10.1002/gepi.20533. [DOI] [PMC free article] [PubMed] [Google Scholar]
- 25.Purcell S, et al. PLINK: a tool set for whole-genome association and population-based linkage analyses. Am J Hum Genet. 2007;81:559–75. doi: 10.1086/519795. [DOI] [PMC free article] [PubMed] [Google Scholar]
- 26.Aulchenko YS, Ripke S, Isaacs A, van Duijn CM. GenABEL: an R library for genome-wide association analysis. Bioinformatics. 2007;23:1294–6. doi: 10.1093/bioinformatics/btm108. [DOI] [PubMed] [Google Scholar]
- 27.Aulchenko YS, Struchalin MV, van Duijn CM. ProbABEL package for genome-wide association analysis of imputed data. BMC Bioinformatics. 2010;11:134. doi: 10.1186/1471-2105-11-134. [DOI] [PMC free article] [PubMed] [Google Scholar]
- 28.Krestyaninova M, et al. A System for Information Management in BioMedical Studies--SIMBioMS. Bioinformatics. 2009;25:2768–9. doi: 10.1093/bioinformatics/btp420. [DOI] [PMC free article] [PubMed] [Google Scholar]
- 29.Devlin B, Roeder K. Genomic control for association studies. Biometrics. 1999;55:997–1004. doi: 10.1111/j.0006-341x.1999.00997.x. [DOI] [PubMed] [Google Scholar]
- 30.Willer CJ, Li Y, Abecasis GR. METAL: fast and efficient meta-analysis of genomewide association scans. Bioinformatics. 2010;26:2190–1. doi: 10.1093/bioinformatics/btq340. [DOI] [PMC free article] [PubMed] [Google Scholar]
- 31.Magi R, Morris AP. GWAMA: software for genome-wide association meta-analysis. BMC Bioinformatics. 2010;11:288. doi: 10.1186/1471-2105-11-288. [DOI] [PMC free article] [PubMed] [Google Scholar]
- 32.Yang J, et al. Genomic inflation factors under polygenic inheritance. Eur J Hum Genet. 2011;19:807–12. doi: 10.1038/ejhg.2011.39. [DOI] [PMC free article] [PubMed] [Google Scholar]
- 33.Weedon MN, et al. Genome-wide association analysis identifies 20 loci that influence adult height. Nat Genet. 2008;40:575–83. doi: 10.1038/ng.121. [DOI] [PMC free article] [PubMed] [Google Scholar]
- 34.Higgins JP, Thompson SG. Quantifying heterogeneity in a meta-analysis. Stat Med. 2002;21:1539–58. doi: 10.1002/sim.1186. [DOI] [PubMed] [Google Scholar]
- 35.Altshuler D, et al. The common PPARgamma Pro12Ala polymorphism is associated with decreased risk of type 2 diabetes. Nat Genet. 2000;26:76–80. doi: 10.1038/79216. [DOI] [PubMed] [Google Scholar]
- 36.Grant SF, et al. Variant of transcription factor 7-like 2 (TCF7L2) gene confers risk of type 2 diabetes. Nat Genet. 2006;38:320–3. doi: 10.1038/ng1732. [DOI] [PubMed] [Google Scholar]
- 37.Sladek R, et al. A genome-wide association study identifies novel risk loci for type 2 diabetes. Nature. 2007;445:881–5. doi: 10.1038/nature05616. [DOI] [PubMed] [Google Scholar]
- 38.Zeggini E, et al. Replication of genome-wide association signals in UK samples reveals risk loci for type 2 diabetes. Science. 2007;316:1336–41. doi: 10.1126/science.1142364. [DOI] [PMC free article] [PubMed] [Google Scholar]
- 39.Scott LJ, et al. A genome-wide association study of type 2 diabetes in Finns detects multiple susceptibility variants. Science. 2007;316:1341–5. doi: 10.1126/science.1142382. [DOI] [PMC free article] [PubMed] [Google Scholar]
- 40.Saxena R, et al. Genome-wide association analysis identifies loci for type 2 diabetes and triglyceride levels. Science. 2007;316:1331–6. doi: 10.1126/science.1142358. [DOI] [PubMed] [Google Scholar]
- 41.Sandhu MS, et al. Common variants in WFS1 confer risk of type 2 diabetes. Nat Genet. 2007;39:951–3. doi: 10.1038/ng2067. [DOI] [PMC free article] [PubMed] [Google Scholar]
- 42.Gudmundsson J, et al. Two variants on chromosome 17 confer prostate cancer risk, and the one in TCF2 protects against type 2 diabetes. Nat Genet. 2007;39:977–83. doi: 10.1038/ng2062. [DOI] [PubMed] [Google Scholar]
- 43.Zeggini E, et al. Meta-analysis of genome-wide association data and large-scale replication identifies additional susceptibility loci for type 2 diabetes. Nat Genet. 2008;40:638–45. doi: 10.1038/ng.120. [DOI] [PMC free article] [PubMed] [Google Scholar]
- 44.Rung J, et al. Genetic variant near IRS1 is associated with type 2 diabetes, insulin resistance and hyperinsulinemia. Nat Genet. 2009;41:1110–5. doi: 10.1038/ng.443. [DOI] [PubMed] [Google Scholar]
- 45.Prokopenko I, et al. Variants in MTNR1B influence fasting glucose levels. Nat Genet. 2009;41:77–81. doi: 10.1038/ng.290. [DOI] [PMC free article] [PubMed] [Google Scholar]
- 46.Kong A, et al. Parental origin of sequence variants associated with complex diseases. Nature. 2009;462:868–74. doi: 10.1038/nature08625. [DOI] [PMC free article] [PubMed] [Google Scholar]
- 47.Kooner JS, et al. Genome-wide association study in individuals of South Asian ancestry identifies six new type 2 diabetes susceptibility loci. Nat Genet. 2011;43:984–9. doi: 10.1038/ng.921. [DOI] [PMC free article] [PubMed] [Google Scholar]
- 48.Yamauchi T, et al. A genome-wide association study in the Japanese population identifies susceptibility loci for type 2 diabetes at UBE2E2 and C2CD4A-C2CD4B. Nat Genet. 2010;42:864–8. doi: 10.1038/ng.660. [DOI] [PubMed] [Google Scholar]
- 49.Weedon MN, et al. Genetic regulation of birth weight and fasting glucose by a common polymorphism in the islet cell promoter of the glucokinase gene. Diabetes. 2005;54:576–81. doi: 10.2337/diabetes.54.2.576. [DOI] [PubMed] [Google Scholar]
- 50.Freathy RM, et al. Type 2 diabetes TCF7L2 risk genotypes alter birth weight: a study of 24,053 individuals. Am J Hum Genet. 2007;80:1150–61. doi: 10.1086/518517. [DOI] [PMC free article] [PubMed] [Google Scholar]
- 51.Teslovich TM, et al. Biological, clinical and population relevance of 95 loci for blood lipids. Nature. 2010;466:707–13. doi: 10.1038/nature09270. [DOI] [PMC free article] [PubMed] [Google Scholar]
- 52.Speliotes EK, et al. Association analyses of 249,796 individuals reveal 18 new loci associated with body mass index. Nat Genet. 2010;42:937–48. doi: 10.1038/ng.686. [DOI] [PMC free article] [PubMed] [Google Scholar]
- 53.Niklasson A, et al. An update of the Swedish reference standards for weight, length and head circumference at birth for given gestational age (1977-1981) Acta Paediatr Scand. 1991;80:756–62. doi: 10.1111/j.1651-2227.1991.tb11945.x. [DOI] [PubMed] [Google Scholar]
Associated Data
This section collects any data citations, data availability statements, or supplementary materials included in this article.