

Abstract
The glucose concentration of the airway surface liquid (ASL) is much lower than blood and is tightly regulated by the airway epithelium. ASL glucose is elevated in patients with viral colds, cystic fibrosis, chronic obstructive pulmonary disease (COPD) and asthma. Elevated ASL glucose is also associated with increased incidence of respiratory infection. However, the mechanism by which ASL glucose increases under inflammatory conditions is unknown. The aim of this study was to investigate the effect of pro-inflammatory mediators (PIMs) on the mechanisms governing airway glucose homeostasis in polarised monolayers of human airway (H441) and primary human bronchial epithelial (HBE) cells. Monolayers were treated with TNF-α, IFN-γ and LPS over 72 hours. PIM treatment led to increase in ASL glucose concentration and significantly reduced H441 and HBE transepithelial resistance (RT). This decline in RT was associated with an increase in paracellular permeability of glucose. Similar enhanced rates of paracellular glucose flux were also observed across excised trachea from LPS-treated mice. Interestingly, PIMs enhanced glucose uptake across the apical, but not the basolateral, membrane of H441 and HBE monolayers. This increase was predominantly via phloretin-sensitive GLUT-mediated uptake, which coincided with an increase in GLUT2 and GLUT10 abundance. In conclusion, exposure of airway epithelial monolayers to PIMs results in increased paracellular glucose flux, and apical GLUT-mediated glucose uptake. However uptake was insufficient to limit glucose accumulation in ASL. These data provide for the first time, a mechanism to support clinical findings that ASL glucose concentration is increased in patients with airway inflammation.
Keywords: Glucose, airway, inflammation, GLUT2, GLUT10, cytokines, LPS
Introduction
The airway epithelium is covered by a thin layer of surface liquid (ASL), which is vital for mucociliary clearance and necessary for maintaining the sterility of the respiratory tract. The volume and composition of ASL is tightly regulated. Our group has previously shown that glucose is present in ASL, but at much lower concentrations than in blood (ASL glucose ~0.4 mM; ~12.5 times lower than blood) [1, 2]. The importance of ion transport across the airway epithelium and its role in maintaining salt and fluid homeostasis of ASL has long been established, but until relatively recently, little was known about the role of glucose in ASL.
ASL glucose concentration is the net effect of paracellular diffusion from blood/interstitial fluid across respiratory epithelium into ASL and removal of glucose from ASL by uptake into epithelial cells through glucose transporters and subsequent cellular metabolism. Transcellular glucose movement has also been reported but this was significantly exceeded by both apical and basolateral uptake [3, 4] (Fig. 8). Glucose uptake across human airway epithelial cell membranes is mediated by facilitative glucose transporters (GLUTs; SLC2A gene family). We have previously detected GLUT2 protein in both apical and basolateral membranes of H441 airway epithelial cells and in epithelial cells from human bronchial biopsies [5]. In primary HBE cell cultures GLUT10 is expressed on the apical membrane and GLUT1 on the basolateral membrane [6]. SGLT protein has not been found in human airway epithelial cells in vitro. In H441 cell monolayers, phloretin (an inhibitor of GLUT mediated transport) inhibited D-glucose uptake across the apical and basolateral membranes and increased the appearance of D-glucose in the apical compartment [3]. Similarly in HBE cell monolayers, 2-deoxyglucose (a substrate for GLUT but not SGLT transport) was taken up across the apical and basolateral membranes [6]. Overall these findings indicate that glucose uptake through apically localised GLUTs plays an important role in maintaining low ASL glucose concentrations.
Figure 8. Proposed mechanisms controlling glucose concentrations in airway surface liquid.

Normal airway: Under normal conditions, glucose predominantly diffuses from blood/interstitial fluid across the respiratory epithelium into airway surface liquid (ASL) via paracellular pathways and this is limited by the permeability of the epithelium. Apical and basolateral facilitative GLUT-mediated transport restricts glucose accumulation in ASL (there is little evidence for Na+-glucose co-transport in these airway cells). Glucose taken up into the cell is rapidly metabolised. This is critical to maintain low intracellular glucose concentrations which provide a driving force for glucose uptake via GLUT transporters. It also limits the transcellular transport of glucose and predicts that ASL glucose concentrations equilibrate with intracellular glucose concentration. Airway treated with pro-inflammatory mediators: Pro-inflammatory mediators reduce transepithelial resistance and increase paracellular diffusion of glucose across the epithelium into ASL. Whilst apical GLUT-mediated glucose transport and GLUT2 and 10 abundance is increased, this is insufficient to prevent a rise in glucose concentration in the ASL.
In humans, ASL glucose concentrations are elevated if the airway epithelium is inflamed or if blood glucose is elevated. Nasal glucose concentrations are undetectable (< 1 mM) in healthy volunteers, but detectable in 50% of patients with symptoms of viral rhinitis (~1 mM) and 90% with diabetes mellitus (~4 mM) [1]. Breath glucose is elevated in people with lung inflammation due to cystic fibrosis (2.0 ± 1.1 mM), with hyperglycaemia due to diabetes mellitus (1.2 ± 0.7 mM) and to highest concentrations in people with both cystic fibrosis and diabetes mellitus (4.0 ± 2.0 mM) [2]. Intensive care patients with elevated ASL glucose concentrations are more likely to have respiratory infection, particularly with methicillin-resistant Staphylococcus aureus (MRSA), than those with normal ASL glucose [7]. Patients with COPD who also have diabetes mellitus are more likely to have gram negative organisms cultured from sputum than those without diabetes [8]. Therefore, maintenance of low ASL glucose is essential for preservation of airway sterility.
While we now have a basic understanding of the mechanisms that control glucose homeostasis in the airways, the effect of inflammatory conditions on these regulatory mechanisms is unknown. Therefore the aim of this study was to investigate the effects of pro-inflammatory mediators on glucose uptake (through GLUTs), paracellular glucose flux and the resultant net changes in ASL glucose in human airway epithelia. This study provides new insights into mechanisms that lead to elevated ASL glucose concentrations and compromise airway sterility in patients with inflamed airways.
Materials and methods
Cell culture
Immortalised human airway epithelial cells (H441) obtained from the American Type Culture Collection (ATCC, Manassas, VA, USA) were cultured in RPMI-1640 media containing 10% foetal calf serum (FCS) (Invitrogen, UK), 10 mM glucose, 2 mM glutamate, 1 mM sodium pyruvate, 10 μg/ml insulin, 5 μg/ml transferrin, 7 ng/ml sodium selenite, 100 U/ml penicillin and 100 μg/ml streptomycin. Polarised monolayers were produced by culturing cells for 7-10 days on permeable membrane supports (Transwells, Corning, MA, USA) at air-liquid interface (ALI). The basolateral membrane was exposed to RPMI media containing 4% charcoal-stripped serum, 10 mM glucose, 200 μM dexamethasone and 10 nM 3,3′-5-triiodothyronine (T3), 2 mM L-glutamine, 1 mM sodium pyruvate, 10 μg/ml insulin, 5 μg/ml transferrin, 7 ng/ml sodium selenite, 100 U/ml penicillin.
Human bronchial epithelial cells (HBE cells; Clonetics) were cultured in bronchial epithelial cell basal media (BEBM) containing BEGM singlequots (Clonetics) in a T-162 flask (Fisher) until confluent. HBE cells were seeded at 8.25×10⁴ cells/well on Transwells and fed with differentiation media containing 50% BEBM: 50% Dulbecco’s modified eagles medium (DMEM; 4.5 g/ml glucose), BEGM singlequots (without triiodothreonine, retinoic acid and GA1000), gentamicin (50 μg/ml) and all trans retinoic acid (5×10⁻⁸ M; all Clonetics). HBE cells remained submerged in differentiation media for 7 days, after which they were taken to ALI for 7-14 days, to form fully differentiated confluent monolayers.
Pro-inflammatory mediators
LPS has been shown to elicit inflammatory cytokine secretion in human and mouse airways in vivo [9, 10]. We therefore used LPS for treating the mouse airways. However, treatment with LPS (15 μg/ml) in previous experiments using H441 cells did not significantly affect transepithelial resistance [11]. A wide range of pro-inflammatory cytokines have been shown to be up-regulated acutely and chronically in lung disease. In diseases such as CF and COPD, levels of tumor necrosis factor α (TNF-α) and interleukin IL-1β have been shown to be raised [12-14] In addition, increased levels of IFN-γ were observed in COPD and IFN-γ mRNA was detected in the airway epithelium of CF patients [15, 16]. In a study using human alveolar epithelial cells Coyne et al [17] showed that treatment with TNF-α (10 ng/ml) and IFN-γ (100 ng/ml) together (but not alone) significantly reduced transepithelial resistance over a similar time course used in this study. However, the addition of IL1β (100 ng/ml) did not have any further affect. Therefore we used a cocktail of pro-inflammatory mediators (PIMs), consisting of TNF-α (100 ng/ml), INF-γ (100 ng/ml) (concentrations similar to that detected in CF patients [17]) and LPS (from Pseudomonas aeruginosa and Escherichia coli; 10 μg/ml) applied to both the apical and basolateral surfaces of polarised airway epithelial monolayers in glucose-containing RPMI media (volumes were 50 μl and 1 ml, respectively). Control untreated monolayers also had RPMI media (50 μl) applied to the apical surface. Cells were treated for 24, 48 and 72 hours with PIMs, with treatment ending on the same day post-seeding (see Fig. 1A).
Figure 1. The glucose concentration of ASL overlying H441 airway epithelial monolayers increases following treatment with pro-inflammatory mediators (PIMs).

A: Time-course of PIM treatment of H441 monolayers. PIM treatment began 7 days post-seeding (for 72 hour treatment), with PIMs added to both the apical and basolateral compartments in 50 μl and 1 ml of glucose-containing RPMI media, respectively. Control monolayers also had media (50 μl) applied to the apical surface. All monolayers were washed and 50 μl of glucose-free media was applied to the apical surface, 9 days post-seeding (24h prior to end of time-course). B: ASL glucose concentration of H441 monolayers after 24, 48 and 72 hours of PIM exposure. (* P < 0.05 compared to control; **** P < 0.0001 compared to control, P < 0.001 compared to 24 hours and P < 0.01 compared to 48 hours, n=5). C: Cell viability in control and PIM treated H441 monolayers (% of control cell monolayer viability, n=4).
External glucose concentrations are known to modify GLUT expression in other epithelia, such as the intestine [18] and pancreatic islets [19]. To control for potential changes in ASL glucose concentration produced by PIM treatment, airway cell cultures were bathed with media containing 10mM glucose on both surfaces during PIM treatment. Thus, any changes determined on GLUT mediated glucose transport were a product of PIM treatment and not glucose concentration.
Cell viability in monolayers treated with and without pro-inflammatory mediators was tested by trypsinising the monolayer and analysing the live:dead cell count (identified by Trypan Blue exclusion) using a haemocytometer.
Glucose uptake experiments
Cells grown at ALI were washed twice with glucose-free transport medium [15 mM HEPES buffer (pH 7.6), 135 mM NaCl, 5 mM KCl, 1.8 mM CaCl2 and 0.8 mM MgCl2] to remove culture medium, then incubated for 15 minutes at room temperature in the same solution to deplete the cells of intracellular glucose.
To study the effects of PIM treatment on airway epithelial glucose transport, uptake experiments were performed with radiolabelled glucose ([14C]-D-glucose) on both H441 and primary HBE monolayers, as described previously [5]. Experiments were initiated by replacing the medium with 0.5 ml transport medium containing 1.0 μCi of [14C]-D-glucose plus 10 mM of non-radiolabelled equivalent glucose to either the basolateral or apical side of the monolayer, followed by incubation at room temperature for 10 minutes. Preliminary experiments indicated that uptake was linear between 0 and 10 minutes (data not shown). Uptake was terminated by adding 2 ml ice-cold stop solution (15 mM HEPES buffer (pH 7.6); 135 mM choline Cl; 5 mM KCl; 0.8 mM MgSO4; 1.8 mM CaCl2 and 0.2 mM HgCl2). The cells were then rinsed twice with 2 ml stop solution and lysed in 0.5 ml of 10 mM Tris–HCl (pH 8.0) with 0.2% SDS. Lysed samples were added to 2 ml scintillation cocktail and radioactive emissions determined using a scintillation counter to quantify glucose uptake.
GLUT-mediated glucose uptake was studied using phloretin (1 mM dissolved in ethanol; an inhibitor of GLUT-mediated glucose uptake) [18]. Phloretin or its vehicle (ethanol) was added to apical or basolateral chambers in the pre-incubation period (20 minutes) prior to addition of D- and L-glucose.
Uptake was calculated as nmol glucose/mg protein and converted to % control to compensate fro variability between batches of cells.
Transepithelial glucose flux
To measure transepithelial glucose flux and transepithelial electrical resistance (RT), H441 cells grown at ALI were mounted in Ussing chambers maintained at 37°C. Both sides of the epithelial cells were bathed in a physiological salt solution (in millimolars): NaCl, 117; NaHCO3, 25; KCl, 4.7; MgSO4, 1.2; KH2PO4, 1.2; CaCl2, 2.5 (equilibrated with 5% CO2 to pH 7.3-7.4). The solution was bubbled with 21% O2 + 5% CO2 pre-mixed gas and continuously circulated throughout the course of the experiment.
Prior to the experiment, cells were washed then incubated for 15 minutes in glucose-free medium. Cells were then mounted in Ussing chambers as above. Flux experiments were initiated by adding 10 mM D-glucose to salt solution containing 1.0 μCi of [14C]-L-glucose to the basolateral side of the epithelial cells. L-glucose is the metabolically inert, non-transportable stereoisomer of D-glucose and thus can only cross the membrane by passive diffusion via paracellular pathways. After mixing, initial samples of 200 μl were removed immediately from the apical and basolateral baths. Apical and basolateral samples (200 μl) were taken every 10 minutes up to 60 minutes and the concentration of radiolabelled glucose was analysed using a scintillation counter.
Transepithelial movement of [14C]-L-glucose from the basolateral to the apical chamber was determined by measuring the amount of tracer radioisotope/glucose as counts per minute (cpm) that had appeared in the apical tracer/glucose-free chamber. Glucose equivalence was calculated using the equation: (Δcpm in the apical chamber/total cpm in the basolateral chamber) × Δ time × concentration of glucose [20].
ASL Glucose Measurements
To evaluate the effects of pro-inflammatory mediators (PIMs) on the glucose concentration of the surface liquid overlying H441 monolayers, the apical surface was washed, monolayers were placed in 50 μl of glucose-free media and left for 24 hours to equilibrate (glucose removed 24 hours prior to conclusion of PIM treatment time-course; see Fig. 1A). Apical fluid was removed from the cell surface and pooled in triplicate for each condition. No difference in apical fluid volume was observed between monolayers. ASL glucose was measured using a glucose oxidase analyser (Analox Instruments, UK).
Transepithelial resistance measurement
The permeability of the cell monolayer to ions was routinely assessed by measuring transepithelial resistance (RT) using an epithelial voltohmmeter (EVOM; World Precision Instruments, UK) attached to ‘chopstick’ electrodes. RT was also monitored during flux experiments by briefly clamping transepithelial potential difference (VT) to 0 mV and 2.0 mV at regular intervals and measuring the short circuit current (Isc). RT (Ω.cm2) was calculated as change in voltage (mV)/change in current (mA).
Western blotting
Membrane protein fractions (50 μg) were separated on 4–12% Bis-Tris acrylamide gels, transferred to polyvinylidine difluoride membranes and incubated overnight at 4oC with anti GLUT2–GLUT10 affinity-purified antisera (1:200; Alpha Diagnostic, San Antonio, TX) or mouse monoclonal anti β-actin (1:500, AbCam, Cambridge, UK). Blots were washed three times in PBS + 0.01% TWEEN 20 then incubated with rabbit anti-mouse secondary antiserum (1:200) (GE Healthcare, UK) followed by streptavidin horseradish peroxidase (HRP) conjugate (1:200) (GE Healthcare, UK) for 1 hour each at room temperature. Immunostained proteins were visualised using enhanced chemiluminescence (ECL) western blot analysis system (NEN Life Science Products, Boston, MA; Western lightning, PerkinElmer, Norwalk, CT, USA) and exposure to X-ray film. All western blots were repeated three times. Binding specificity of GLUT2 and GLUT10 antibodies was confirmed in a repeat experiment where membranes were pre-incubated with antigenic peptides.
Immunofluorescence staining of human bronchial epithelium
H441 cells grown on Transwells were fixed with paraformaldahyde for 10 minutes. Cells were blocked with 10% bovine serum in 0.1% Triton X-100-PBS. Cells were incubated with rabbit polyclonal antibodies raised against human GLUT2 and GLUT10 transporters (1:500 dilution in 0.1%Triton-PBS; Alpha Diagnostic, San Antonio, TX) at room temperature for 1 hour. After washing 3 × 10 minutes in PBS, sections were incubated in FITC-conjugated goat anti-rabbit IgG 1:1000 diluted in 0.1% Triton-PBS for 1 hour at room temperature. Slides were washed three times for 10 minutes in PBS, sections were then counterstained with 4′,6-diamidino-2- phenyindole (DAPI; 1:1,000 diluted in 0.1% Triton-PBS) to localise cell nuclei. As a control, sections were also incubated with GLUT2/10 antiserum pre-absorbed with a 10-fold excess of the appropriate antigenic peptide for 20 minutes. Images were observed with a fluorescence microscope Zeiss with Axioplan 2 analysis system using the Axiovision 4.5 software. Cell fluorescence was recorded by excitation at 450–490 nm. Leica software was used to capture images, under identical conditions of imaging, illumination intensity, and photomultiplier settings.
LPS treated mice
All experiments were carried out in accordance with the UK Home Office The Animals (Scientific Procedures) Act, 1986. Male BALB/c mice (6–8 wk, Charles River Laboratories, Margate, UK) were used. Mice received 50 μl of a 0.05 mg/ml solution of LPS (Escherichia coli 0127:B8, Sigma, Poole, UK; in sterile saline) or saline via the intranasal route while lightly anesthetized with 4% isofluorane. After 24 hours mice were killed with an overdose of sodium pentobarbitone and the trachea was quickly dissected away from surrounding tissues and further microdissected in Krebs salt solution. Flat preparations of trachea were made by cutting through the ventral aspect of the cartilage rings before being placed in a modified Ussing chamber. Flux experiments were performed using the same method as described for cell cultures.
A separate group of mice was treated with LPS or saline in an identical manner, in order to verify the extent of the inflammatory response to LPS. Mice were killed with an overdose of pentobarbitone and a cannula was inserted into the trachea. Three 0.5 ml aliquots of PBS were lavaged in and out of the airways. Total counts of cells in the bronchoalveolar lavage fluid (BAL) were determined using a haemocytometer. Differential cell counts were performed on cytospin preparations of BAL fluid stained with Diff Quick (Gamidor Technical Services Ltd, Didcot, UK). Concentrations of murine TNF-α in BAL fluid were detemined by ELISA using a commercially available kit (Peprotech, UK).
Chemicals and reagents
All chemicals and reagents were obtained from Sigma, Poole, UK unless otherwise stated.
Statistical analysis
Values are reported as the mean ± SEM. Statistical analysis was performed using paired Student’s t test or analysis of variance (ANOVA) tests followed by Bonferroni multiple comparison post hoc tests. P values of < 0.05 were considered statistically significant.
Results
Glucose concentration of airway epithelial cell ASL rises in response to treatment with pro-inflammatory mediators
PIM treatment increased the concentration of glucose present in the H441 ASL from 0.24 ± 0.07 mM (control) to 0.70 ± 0.19 mM after 48 hours exposure (P < 0.05 compared to control; n=5) and further to 1.9 ± 0.43 mM after 72 hours (P < 0.0001 compared to control and P < 0.01 compared to 48 hours; n=5; Fig. 1B). Although the mean concentration of glucose was higher than control after 24 hours it did not reach statistical significance (Fig. 1B). No change in the viability of the airway epithelial monolayers was observed after 72 hours of PIM treatment (P < 0.05; n=4; Fig. 1C), so PIM-induced apoptosis can be ruled out as an explanation for observed changes in glucose homeostasis. In order to understand how these changes occured, we investigated the effect of PIMs on mechanisms that govern ASL glucose homeostasis, which have previously been characterised by our group [3].
Pro-inflammatory mediators increase glucose uptake across the apical, but not the basolateral membrane of epithelial cell monolayers
Measurement of glucose uptake into epithelial cells across the apical or basolateral membrane showed that PIM exposure enhanced glucose uptake across the apical membranes of both H441 and HBE cells. Compared to control (untreated cells), apical glucose uptake was increased by 42 ± 5% and 66 ± 24% in H441 after 48 and 72 hours of PIM treatment (P < 0.05; n=5; Fig. 2), respectively. Apical glucose uptake was also increased in HBE monolayers and compared to control increased by 164 ± 53% after 72 hours treatment with the inflammatory mediator mix (P < 0.05; n=3). Interestingly, the increase in glucose uptake was restricted to the apical membrane. Uptake across the basolateral membrane was more variable and no significant changes in basolateral glucose uptake were observed between control or PIM treatment at any time point in either cell line (P < 0.05; n=5; Fig. 2). To confirm that the changes in glucose uptake were mediated by GLUT transporters, further experiments were conducted on H441 cells in the presence of the GLUT specific inhibitor phloretin (1 mM). Compared to control, a significant increase in phloretin-sensitive glucose uptake was observed across the apical membrane of H441 monolayers after 48 and 72 hours of PIM treatment (apical uptake increased by 116 ± 33% and 133 ± 22%, respectively; P < 0.05; n=4; Fig. 3). No changes in GLUT-sensitive uptake were determined across the basolateral membrane (data not shown). These data are consistent with PIM enhancing apical GLUT-mediated glucose uptake.
Figure 2. Pro-inflammatory mediator treatment increases D-glucose uptake across the apical membrane of H441 and primary HBE monolayers.

Uptake of 14C-D-glucose across the apical and basolateral membranes of H441 and HBE monolayers, after 24, 48 and 72 hours of PIM exposure compared to control untreated monolayers and shown as % control. (* P < 0.05 and ** P < 0.01, compared to control, n=3-5 as given in results section).
Figure 3. Pro-inflammatory mediator exposure enhances phloretin-sensitive D-glucose uptake across the apical membrane of H441 airway monolayers.
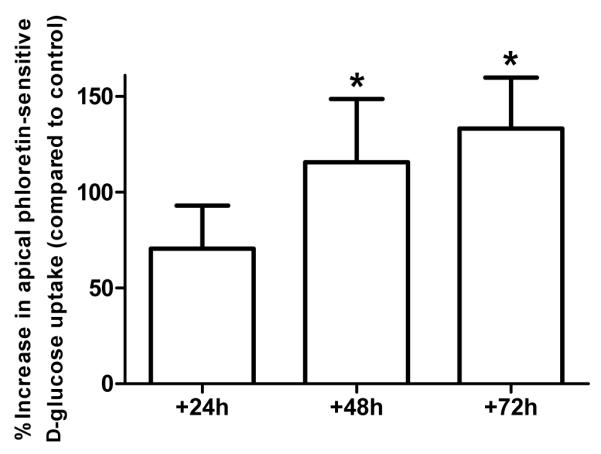
Phloretin-sensitive uptake of 14C-D-glucose across the apical membrane of H441 cell monolayers, after 24, 48 and 72 hours of PIM exposure, compared to control untreated monolayers and shown as % control. 1 mM phloretin (GLUT inhibitor) was applied to the apical membrane for 30 minutes prior to commencing the uptake experiment. (* P < 0.05 compared to control, n=4).
Apical GLUT2 and GLUT10 abundance increases after treatment with pro-inflammatory mediators
Correlating with the changes in glucose transport, an increase in GLUT2 and GLUT10 abundance was seen in PIM-treated H441 monolayers, as determined by immunocytochemistry (Fig. 4) and Western blot (Fig. 5A & 5B). Taken together, glucose uptake and expression studies demonstrate increased, rather than decreased, glucose transport by airway epithelial cells in response to treatment with PIMs. Changes in glucose transport therefore do not explain elevation in ASL in response to an inflammatory stimulus.
Figure 4. Pro-inflammatory mediators enhance GLUT2 and GLUT10 abundance in H441 airway epithelial monolayers.

Proinflammatory mediators enhance GLUT2 and GLUT10 abundance in H441 airway epithelial monolayers. Untreated (control) or PIM treated (for +24, +48 and +72 h) H441 cell monolayers immunostained with GLUT2 (GLUT2 AB) or GLUT10 (GLUT10 AB) antisera and FITC-conjugated secondary antiserum (green). GLUT2 and GLUT10 specificity was verified by comparison against immunoflorescence from cells immunostained as above but in the presence of antigenic blocking peptides (GLUT2 + BP and GLUT10 + BP, respectively). Overlays of GLUT2 AB and GLUT10 AB with corresponding images of cell nuclei stained with DAPI (blue) are also shown (GLUT2 + DAPI and GLUT10 + DAPI, respectively). Images were acquired with a x40 oil immersion lens under identical conditions of illumination intensity and photo-multiplier settings. One set of images from n = 4 experiments is shown
Figure 5. Pro-inflammatory mediators increase GLUT2 and GLUT10 protein abundance in H441 airway epithelial monolayers by Western Blot.

Western blot analysis of GLUT2 (A) and GLUT10 (B) expression (both ~50 kDa) in lysates from untreated (control) and PIM treated (for 24, 48 and 72 hours) H441 cell monolayers. Band intensities (as a measure of abundance) were calculated by normalising to β-actin (~40 kDa) and are shown as % control. (* P < 0.05 compared to control, n=4).
Pro-inflammatory mediators decrease RT and enhance the paracellular flux of glucose across airway epithelial cell cultures and ex vivo murine trachea
According to our model, an alternative explanation for elevation of ASL glucose under inflammatory conditions is an increase in paracellular glucose flux. Our group has previously shown that there is a correlation between the transepithelial electrical resistance (RT) and the rate of glucose flux through paracellular pathways across airway monolayers [3].
After treatment with PIM, RT decreased at each time point from 453 ± 48 Ω.cm2 (control) to 225 ± 16 Ω.cm2 (72 hours) in H441 and from 627 ± 40 Ω.cm2 to 278 ± 15 Ω.cm2 in HBE monolayers (P < 0.0001 compared to control, n=8, respectively, Fig. 6A). There was a significant increase in the rate of [14C]-L-glucose flux across both H441 and HBE monolayers in response to PIM exposure at 48 hours (P < 0.01 compared to control) and 72 hours (P < 0.001 compared to control, n=4, respectively, Fig. 6B). Interestingly, while a significant decrease was seen in RT after 24 hours of treatment (P < 0.01; n = 4), no change in paracellular glucose flux was observed in either cell type until 48 hours.
Figure 6. Pro-inflammatory mediator treatment decreases RT and increases the rate of paracellular glucose flux across H441 and primary HBE monolayers.

A: The effects of PIM treatment (24, 48, 72 hours) on transepithelial resistance (RT) of polarised H441 and HBE monolayers. (** P < 0.01; *** P < 0.001 and **** P < 0.01 compared to control; † P < 0.05 compared to 24 hours, n=8). B: Time course of apical L-glucose appearance across polarised monolayers of H441 and HBE cells. Transport was traced by applying [14C]-L-Glucose to the basolateral reservoir and sampling the apical reservoir for [14C]-radiolabel appearance at 10 minute intervals for one hour of incubation at 37oC. (48 hours= P < 0.01 compared to control and 72 hours= P < 0.001 compared to control, in both cell types, n=4).
To verify whether an inflammatory stimulus results in a similar enhanced paracellular movement of glucose in vivo, radiolabelled L-glucose flux experiments were performed across excised trachea from LPS-treated mice. Like PIM treatment of airway epithelial monolayers in cell culture, LPS pre-treatment (for 24 hours) resulted in approximately a 9-fold increase in [14C]-L-glucose flux across mouse trachea (from 0.025 ± 0.010 μmoles/min/cm2 (control) to 0.212 ± 0.052 μmoles/min/cm2 (LPS-treated; P < 0.05; n=3; Fig. 7A). The number of neutrophils obtained from BAL fluid was elevated in LPS-treated mice compared to saline controls (* P < 0.0001 at both 3 hours and 24 hours, compared to saline control; n=6) confirming that LPS had induced an acute inflammatory response in the mouse airway (Fig. 7B). The inflammatory cytokine TNF-α was also present in the BAL fluid of LPS treated mice, while TNF-α levels in control mice were undetectable. The concentration of TNF-α rose to 10.6 ± 0.5 pg/ml after 3 hours of LPS exposure and then returned to baseline by 24 hours (Fig. 7C).
Figure 7. LPS exposure leads to enhanced paracellular glucose flux across ex vivo murine trachea.

A: Time course of basolateral to apical L-glucose flux across excised trachea from saline (control) or LPS treated mice (24 hour exposure). Transport was traced by applying [14C]-L-Glucose to the mucosal reservoir and sampling the luminal reservoir for [14C]-radiolabel appearance at 20 minute intervals, over a duration of 100 minutes. (* P < 0.05 compared to control, n=3). B: Neutrophil count from BAL fluid of LPS and saline treated mice after 3 and 48 hours exposure. (* P < 0.0001 at all time points compared to saline control, n=6). C: TNF-α concentration of BAL fluid from LPS treated mice after 3 and 24 hours. TNF-α was undetectable in BAL samples from control mice, n=6).
Discussion
In humans, airway inflammation is associated with elevation of ASL glucose concentrations [2]. In this study we have confirmed our clinical observations, by demonstrating that exposure of airway epithelial cell monolayers to pro-inflammatory mediators increases ASL glucose concentrations. We have shown that the underlying mechanism is increased basolateral to apical paracellular glucose flux, which exceeds compensatory upregulation of apical glucose transport. As elevated ASL glucose concentrations compromise the sterility of the lungs and increase susceptibility to infection, insight into disruption of airway glucose homeostasis under inflammatory conditions could provide new therapeutic targets for lung infection.
In both cell culture models (polarised H441 and HBE cell monolayers) and excised murine trachea, PIM treatment lead to an increase in basolateral-to-apical paracellular flux of glucose. These changes were associated with a decrease in RT across airway epithelial cells. This is consistent with findings in primary human airway epithelial cell monolayers where cytokines elevated in chronic lung inflammation (TNF-α and IFN-γ) for 72 hours increased epithelial permeability to small and large solutes (10 kDa and 2000 kDa dextrans)[17]. However, interestingly, while a significant decrease was seen in RT after 24 hours of treatment, no change in paracellular glucose flux was observed until 48 hours. The route taken by glucose through epithelial tight junctions is currently unknown. Recent evidence indicates that factors regulating ion movement through epithelial tight junctions may be different to those regulating small non-charged solutes [21-24]. As RT is a measure of resistance to ionic movement, this measurement may not accurately represent the resistance to movement of small non charged solutes such as glucose [24, 25]. In support of this, we have previously shown that the relationship between RT and glucose appearance in the apical chamber of H441 cells was not linear. As RT decreased, there was an exponential increase in glucose appearance [3]. At the RT values determined in the current study, our finding that there was little change in glucose flux after a 24 hour treatment with PIMs (RT ≥ 300 Ω.cm2) would be consistent with our previous observations that there is little movement of glucose at these resistance values. However, as RT decreased from 300- 200 Ω.cm2, 48 and 72 hours post treatment with PIMs, there would be an incremental rise in glucose flux resulting in increased glucose appearance in the ASL. Over time, this would lead to glucose accumulation in ASL, particularly if the processes mediating glucose uptake from the apical membrane were also compromised, resulting in further elevation of ASL glucose at 72 hours post PIM treatment. These findings are important because the paracellular pathway taken by glucose through epithelial tight junctions may represent an important therapeutic target to maintain airway sterility and restrict the growth of glucose-utilising bacteria in inflammatory airway disease.
Glucose transport was investigated, since a decline in GLUT-mediated uptake by the epithelium could also contribute to the PIM-induced increase in ASL glucose. Conversely, we found that apical glucose uptake via GLUT transporters was increased in human airway cells in vitro. In our model, this would serve to reduce glucose accumulation in ASL. However, further analysis of our in vitro experiments showed that paracellular glucose flux (~4.1 nmol/min/cm2; n=3) was approximately equal to the combined effects of apical and basolateral glucose uptake (apical ~ 1.1, basolateral ~2.9, total ~4.0 nmol/min/cm2; n=3) in control H441 airway monolayers. However, after 72 hours of PIM treatment, paracellular glucose flux (~12.1 nmol/min/cm2; n=3) exceeded bilateral glucose uptake (apical ~ 1.7, basolateral ~3.3, total ~5.0 nmol/min/cm2; n=3), which would lead to an increase in ASL glucose. Thus, even though glucose transport was upregulated, this was insufficient to balance the increased paracellular glucose leak and prevent an increase in glucose concentration in ASL.
We showed previously that inhibition of apical GLUT uptake with phloretin increased accumulation of apical glucose. Importantly, our data therefore indicates that without the contribution of GLUT-mediated uptake, it is likely that glucose levels in ASL would rise further in response to PIMs. Interestingly, GLUT10 expression correlated with the increase in apical phloretin-sensitive glucose uptake. Pezzulo and colleagues recently showed that GLUT10 is expressed in HBE monolayers [6], but little is known about its contribution to overall glucose transport in airway epithelia. As the significant increase in apical glucose uptake occurs at the same time-point (after 48 hours of PIM treatment) as the increase in GLUT10, but not GLUT2 abundance, we speculate that GLUT10 may play an important role in transporting glucose under these conditions. Further work is now required to elucidate its function in the airway. These findings also raise the possibility that GLUT transport could be further stimulated to lower ASL glucose and harnessed as an additional therapy for airway inflammatory disease.
Conclusions
Exposure of airway epithelial cell monolayers to a cocktail of pro-inflammatory mediators leads to an increase in ASL glucose concentration and supports our clinical data that ASL glucose is increased in airway inflammation [1, 2]. Elevation of ASL glucose concentration was predominantly the result of increased paracellular flux of glucose (due to the enhanced permeability of epithelial tight junctions), which was not overcome by a compensatory increase in apical GLUT-mediated glucose transport (Fig. 8). These experiments provide an insight into the mechanisms that are disrupted under inflammatory conditions and may provide new therapeutic targets for lowering airway glucose in order to decrease the associated respiratory infection.
Abbrevaitaions used
- ASL
Airwway surface liquid
- GLUT
Glucose transporter
- HBE cells
Human bronchial epithelial cells
- PIM
Pro-inflammatory mediators
- RT
Transepithelial resistance
Footnotes
Supported by the Wellcome Trust 088304/Z/09/Z
References
- 1.Philips BJ, Meguer JX, Redman J, Baker EH. Factors determining the appearance of glucose in upper and lower respiratory tract secretions. Intensive Care Med. 2003;29:2204–2210. doi: 10.1007/s00134-003-1961-2. [DOI] [PubMed] [Google Scholar]
- 2.Baker EH, Clark N, Brennan AL, Fisher DA, Gyi KM, Hodson ME, Philips BJ, Baines DL, Wood DM. Hyperglycemia and cystic fibrosis alter respiratory fluid glucose concentrations estimated by breath condensate analysis. J. Appl. Physiol. 2007;102:1969–1975. doi: 10.1152/japplphysiol.01425.2006. [DOI] [PubMed] [Google Scholar]
- 3.Kalsi KK, Baker EH, Fraser O, Chung YL, Mace OJ, Tarelli E, Philips BJ, Baines DL. Glucose homeostasis across human airway epithelial cell monolayers: role of diffusion, transport and metabolism. Pflugers Arch. 2009;457:1061–1070. doi: 10.1007/s00424-008-0576-4. [DOI] [PubMed] [Google Scholar]
- 4.Saumon G, Martet G. Effect of changes in paracellular permeability on airspace liquid clearance: role of glucose transport. Am. J. Physiol. 1996;270:L191–L198. doi: 10.1152/ajplung.1996.270.2.L191. [DOI] [PubMed] [Google Scholar]
- 5.Kalsi KK, Baker EH, Medina RA, Rice S, Wood DM, Ratoff JC, Philips BJ, Baines DL. Apical and basolateral localisation of GLUT2 transporters in human lung epithelial cells. Pflugers Arch. 2008;456:991–1003. doi: 10.1007/s00424-008-0459-8. [DOI] [PMC free article] [PubMed] [Google Scholar]
- 6.Pezzulo AA, Gutierrez J, Duschner KS, McConnell KS, Taft PJ, Ernst SE, Yahr TL, Rahmouni K, Klesney-Tait J, Stoltz DA, Zabner J. Glucose depletion in the airway surface liquid is essential for sterility of the airways. PLoS One. 2011;6:e16166. doi: 10.1371/journal.pone.0016166. [DOI] [PMC free article] [PubMed] [Google Scholar]
- 7.Philips BJ, Redman J, Brennan A, Wood D, Holliman R, Baines D, Baker EH. Glucose in bronchial aspirates increases the risk of respiratory MRSA in intubated patients. Thorax. 2005;60:761–764. doi: 10.1136/thx.2004.035766. [DOI] [PMC free article] [PubMed] [Google Scholar]
- 8.Loukides S, Polyzogopoulos D. The effect of diabetes mellitus on the outcome of patients with chronic obstructive pulmonary disease exacerbated due to respiratory infections. Respiration. 1996;63:170–173. doi: 10.1159/000196539. [DOI] [PubMed] [Google Scholar]
- 9.Thorn J. The inflammatory response in humans after inhalation of bacterial endotoxin: a review. Inflamm. Res. 2001;50:254–261. doi: 10.1007/s000110050751. [DOI] [PubMed] [Google Scholar]
- 10.Raoust E, Balloy V, Garcia-Verdugo I, Touqui L, Ramphal R, Chignard M. Pseudomonas aeruginosa LPS or flagellin are sufficient to activate TLR-dependent signaling in murine alveolar macrophages and airway epithelial cells. PLoS One. 2009;4:e7259. doi: 10.1371/journal.pone.0007259. [DOI] [PMC free article] [PubMed] [Google Scholar]
- 11.Baines DL, Albert AP, Hazell MJ, Gambling L, Woollhead AM, Dockrell ME. Lipopolysaccharide modifies amiloride-sensitive Na+ transport processes across human airway cells: role of mitogen-activated protein kinases ERK 1/2 and 5. Pflugers Arch. 2010;459:451–463. doi: 10.1007/s00424-009-0717-4. [DOI] [PMC free article] [PubMed] [Google Scholar]
- 12.Salva PS, Doyle NA, Graham L, Eigen H, Doerschuk CM. TNF-alpha, IL-8, soluble ICAM-1, and neutrophils in sputum of cystic fibrosis patients. Pediatr. Pulmonol. 1996;21:11–19. doi: 10.1002/(SICI)1099-0496(199601)21:1<11::AID-PPUL2>3.0.CO;2-T. [DOI] [PubMed] [Google Scholar]
- 13.Osika E, Cavaillon JM, Chadelat K, Boule M, Fitting C, Tournier G, Clement A. Distinct sputum cytokine profiles in cystic fibrosis and other chronic inflammatory airway disease. Eur. Respir. J. 1999;14:339–346. doi: 10.1034/j.1399-3003.1999.14b17.x. [DOI] [PubMed] [Google Scholar]
- 14.Boutou AK, Stanopoulos I, Pitsiou GG, Kontakiotis T, Kyriazis G, Sichletidis L, Argyropoulou P. Anemia of chronic disease in chronic obstructive pulmonary disease: a case-control study of cardiopulmonary exercise responses. Respiration. 2011;82:237–245. doi: 10.1159/000326899. [DOI] [PubMed] [Google Scholar]
- 15.Wojnarowski C, Frischer T, Hofbauer E, Grabner C, Mosgoeller W, Eichler I, Ziesche R. Cytokine expression in bronchial biopsies of cystic fibrosis patients with and without acute exacerbation. Eur. Respir. J. 1999;14:1136–1144. doi: 10.1183/09031936.99.14511369. [DOI] [PubMed] [Google Scholar]
- 16.Mroz RM, Szulakowski P, Pierzchala W, Chyczewska E, MacNee W. Pathogenesis of chronic obstructive pulmonary disease. Cellular mechanisms (part I) Wiad. Lek. 2006;59:92–96. [PubMed] [Google Scholar]
- 17.Coyne CB, Vanhook MK, Gambling TM, Carson JL, Boucher RC, Johnson LG. Regulation of airway tight junctions by proinflammatory cytokines. Mol. Biol. Cell. 2002;13:3218–3234. doi: 10.1091/mbc.E02-03-0134. [DOI] [PMC free article] [PubMed] [Google Scholar]
- 18.Kellett GL, Helliwell PA. The diffusive component of intestinal glucose absorption is mediated by the glucose-induced recruitment of GLUT2 to the brush-border membrane. Biochem. J. 2000;350(Pt 1):155–162. [PMC free article] [PubMed] [Google Scholar]
- 19.Kalupahana NS, Massiera F, Quignard-Boulange A, Ailhaud G, Voy BH, Wasserman DH, Moustaid-Moussa N. Overproduction of angiotensinogen from adipose tissue induces adipose inflammation, glucose intolerance, and insulin resistance. Obesity (Silver Spring) 2012;20:48–56. doi: 10.1038/oby.2011.299. [DOI] [PMC free article] [PubMed] [Google Scholar]
- 20.Mullin JM, Fluk L, Kleinzeller A. Basal-lateral transport and transcellular flux of methyl alpha-D-glucoside across LLC-PK1 renal epithelial cells. Biochim. Biophys. Acta. 1986;885:233–239. doi: 10.1016/0167-4889(86)90237-5. [DOI] [PubMed] [Google Scholar]
- 21.Van Itallie CM, Holmes J, Bridges A, Gookin JL, Coccaro MR, Proctor W, Colegio OR, Anderson JM. The density of small tight junction pores varies among cell types and is increased by expression of claudin-2. J. Cell Sci. 2008;121:298–305. doi: 10.1242/jcs.021485. [DOI] [PubMed] [Google Scholar]
- 22.Karczewski J, Groot J. Molecular physiology and pathology of tight junctions. III Tight junction regulation by intracellular messengers: differences in responses within and between epithelial. Am. J. Physiol. Gastrointest. Liver Physiol. 2007;279:G660–G665. doi: 10.1152/ajpgi.2000.279.4.G660. [DOI] [PubMed] [Google Scholar]
- 23.Balda M, Matter K. Tight junctions at a glance. J. Cell Sci. 2008;121:3677–3682. doi: 10.1242/jcs.023887. [DOI] [PubMed] [Google Scholar]
- 24.Shen L, Weber CR, Raleigh DR, Yu D, Turner JR. Tight junction pore and leak pathways: a dynamic duo. Annu. Rev. Physiol. 2011;73:283–309. doi: 10.1146/annurev-physiol-012110-142150. [DOI] [PMC free article] [PubMed] [Google Scholar]
- 25.Angelow S, Yu AS. Claudins and paracellular transport: an update. Curr. Opin. Nephrol. Hypertens. 2007;16:459–464. doi: 10.1097/MNH.0b013e32820ac97d. [DOI] [PubMed] [Google Scholar]