

Abstract
We estimated local and metapopulation effective sizes ( and meta-
 ) for three coexisting salmonid species (Salmo salar, Salvelinus fontinalis, Salvelinus alpinus) inhabiting a freshwater system comprising seven interconnected lakes. First, we hypothesized that
  might be inversely related to within-species population divergence as reported in an earlier study (i.e., FST: S. salar> S. fontinalis> S. alpinus). Using the approximate Bayesian computation method implemented in ONeSAMP, we found significant differences in
  (
( ) between species, consistent with a hierarchy of adult population sizes (
 ). Using another method based on a measure of linkage disequilibrium (LDNE:
  ), we found more finite
  values for S. salar than for the other two salmonids, in line with the results above that indicate that S. salar exhibits the lowest
  among the three species. Considering subpopulations as open to migration (i.e., removing putative immigrants) led to only marginal and non-significant changes in
  , suggesting that migration may be at equilibrium between genetically similar sources. Second, we hypothesized that meta-
 might be significantly smaller than the sum of local
  s (null model) if gene flow is asymmetric, varies among subpopulations, and is driven by common landscape features such as waterfalls. One ‘bottom-up’ or numerical approach that explicitly incorporates variable and asymmetric migration rates showed this very pattern, while a number of analytical models provided meta-
 estimates that were not significantly different from the null model or from each other. Our study of three species inhabiting a shared environment highlights the importance and utility of differentiating species-specific and landscape effects, not only on dispersal but also in the demography of wild populations as assessed through local
  s and meta-
 s and their relevance in ecology, evolution and conservation.
Keywords: Effective population size, gene flow, metapopulation, Salmo salar, Salvelinus fontinalis, Salvelinus alpinus
Introduction
Multispecies comparisons of closely related taxa in landscape genetics studies have the potential to assist in validating models in theoretical population genetics and empirically assess their applicability, that is, the extent to which they capture the nuances of natural populations (Hänfling and Weetman 2006; Fraser et al. 2007; Beebee 2009). When model results are discordant, conclusions can be difficult to draw, but agreement, on the other hand, suggests that parameters inferred from the data may be robust to differential assumptions characterizing the theoretical models (e.g., Whitlock and Barton 1997). Studies making these types of comparisons may be especially informative for conservation and management of wild populations, as they can elucidate the general influence of life history aspects and demography on population genetics (Turner et al. 1996; Whiteley et al. 2004; Manier and Arnold 2006; Gomez-Uchida et al. 2009).
The effective size of a population (Ne, Wright 1931) was defined to measure the rate of heterozygosity loss in a population, and is explicitly linked to migration rate (m) in the classical island model, through FST (Wright 1965). In addition to its importance at the interplay of population structure and dispersal, Ne is a central parameter in conservation biology as it is linked to the long-term viability and extinction risk of populations (Lande 1988; Frankham 1995). However, only recently have methods been developed that use genetic data to assess Ne independently of m (reviewed Wang 2005; Luikart et al. 2010). Such methods have been applied in numerous studies, mostly to reveal patterns of variable Ne within many taxa (fishes: Fraser et al. 2004; Gomez-Uchida et al. 2008; Palstra et al. 2009; reptiles: Manier and Arnold 2005; mammals: Kaeuffer et al. 2007; birds: Hoeck et al. 2010; see Palstra and Ruzzante 2008 for review). On the other hand, comparisons of Ne among different species occupying the same habitat have been sparse, even though these studies may provide evolutionary insights into previously documented ecological interactions (e.g., competition: Manier and Arnold 2005; predator-prey: Manier and Arnold 2006). Such analyses may also elucidate the role of life history in shaping variation in Ne in a shared common environment.
Most species naturally occur in networks of more or less interconnected populations (hereafter called meta-populations), thereby potentially biasing methods for estimating Ne that assume single closed populations. More importantly, this currently limits our understanding of the magnitude and behavior of Ne under typical conditions in the wild, both at the local scale of a population and at the global scale of a meta-population. Solutions have been proposed at different levels with various approaches (e.g., Fraser et al. 2007; Palstra and Ruzzante 2008; Waples and Do 2010). At the population level, approaches that simultaneously calculate contemporary Ne and m have gained popularity (Vitalis and Couvet 2001; Wang and Whitlock 2003; but see Waples and England 2011). Alternatively, some authors have attempted to identify immigrants and assess how they affect temporal estimates of contemporary Ne (Walter et al. 2009). Very few studies so far have explored the effects of gene flow on single-sample estimators of contemporary Ne (e.g., Palstra and Ruzzante 2011; Waples and England 2011). At the metapopulation level, the concept of effective metapopulation size (meta-Ne), that is the effective size of a subdivided population, has been the focus of extensive theoretical work (e.g., Whitlock and Barton 1997; Nunney 1999). Wang and Caballero (1999) argued that meta-Ne can be smaller or larger than the sum of Ne, depending on whether all subpopulations have equal variance in reproductive success. Recent empirical studies on salmonid fish have reported reductions in meta-Ne in the context of asymmetric gene flow and variable local Ne (Kuparinen et al. 2010; Palstra and Ruzzante 2011). These findings hence suggest that meta-Ne may indeed often be much smaller than would be predicted in relatively simple metapopulation models, but clearly more empirical estimates are required to validate this generalization.
This study focuses on three salmonid fish species, Atlantic salmon (Salmo salar), brook trout (Salvelinus fontinalis), and Arctic charr (Salvelinus alpinus), living in sympatry in a system of seven interconnected lakes in the Upper Humber River, Gros Morne National Park (Newfoundland, Canada: Fig. 1). All three species form discrete spawning aggregations within each lake, but with varying degrees of global population divergence (FST: S. salar > S. fontinalis > S. alpinus; Table 1; Gomez-Uchida et al. 2009). Such levels of population divergence seem to be inversely related to population density as local mark-recapture studies indicate the abundance of S. alpinus > S. fontinalis > S. salar (Table 1; see also Ryan and Kerekes 1988; Anions 1994).
Figure 1.
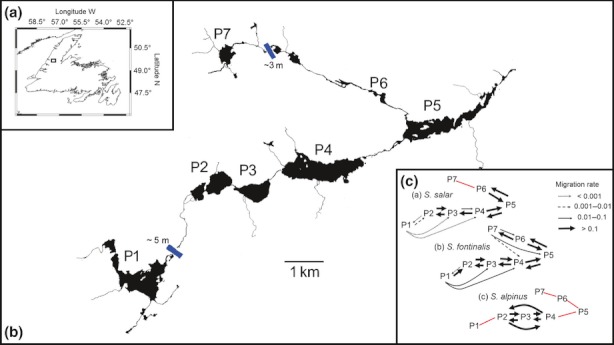
(a) Study site in the Upper Humber River, Gros Morne National Park (rectangle shows the area in western Newfoundland, Canada). (b) The population system: seven interconnected lakes locally referred to as “ponds” (P1–P7); P1 and P7 are found above waterfalls (in blue) of 5 m and 3 m, respectively, which are impassable for fish, whereas P2–P6 are found below waterfalls. River flows naturally from P1 to P5 and from P7 to P5. (c) Estimates of migration rate for (a) Salmo salar, (b) Salvelinus fontinalis, and (c) Salvelinus alpinus from a previous study (Gomez-Uchida et al. 2009) showed that these waterfalls represent barriers to dispersal and probably cause asymmetrical gene flow (arrows in log-scale), even though the magnitude was species-specific. Red lines indicate that no estimates of gene flow could be reliably obtained because samples were unavailable or insufficient (see text for details).
Table 1.
Data set and population (genetic and ecological) parameters for a community of salmonids (Salmo salar, Salvelinus fontinalis, and Salvelinus alpinus) from the Upper Humber River, Gros Morne National Park (Newfoundland, Canada)
| S. salar | S. fontinalis | S. alpinus | Remarks | |
|---|---|---|---|---|
| Data set | ||||
| Number of genotyped microsatellite loci | 12 | 13 | 11 | Details in Table S1–S4 from Gomez-Uchida et al. (2009) |
| Mean number of alleles per locus | 13.2 | 8.6 | 18.2 | Over all loci and populations |
| Number of subpopulations or ponds (names) | 6 (P1–P6) | 7 (P1–P7) | 3 (P2–P4) | Minimum sample size of 20 to estimate Ne |
| Number of genotyped individuals | 456 | 706 | 301 | Maximum of three loci with missing genotypes per individual* |
| Population | ||||
| Global population divergence – F'ST (95% CI) | 0.202 (0.200–0.205) | 0.076 (0.058–0.089) | 0.020 (0.012–0.025) | Standardized by heterozygosity |
| Global inbreeding coefficient – F'IT | 0.202 | 0.088 | 0.012 | Standardized by heterozygosity |
Average immigration rate ( ± SE) ± SE) |
0.053 ± 0.025 | 0.061 ± 0.034 | 0.153 ± 0.050 | Contemporary estimator using BIMr |
| Variance of dispersion distance (σ2) | 0.026 | 0.023 | – | No isolation by distance in S. alpinus |
| Adult population size | 989 | 2021 | 12773 | Mark-recapture estimate from Hardings pond (P2) |
Requirement for ONeSAMP (Tallmon et al. 2008).
Our goal in the present paper is twofold. We first test the hypothesis that contemporary effective population size will be inversely related to the degree of population structure with S. alpinus and S. salar exhibiting, respectively, the highest and lowest estimates of effective population size ( ) with S. fontinalis exhibiting an intermediate
  . Secondly, we estimate meta-Ne (meta-
 ) using a variety of models and then compare these estimates across models within species. Our second hypothesis, now related to meta-
 , is that meta-
 can be significantly smaller than the sum of local
  s if gene flow is asymmetric and varies among subpopulations (Tufto and Hindar 2003).
Materials and Methods
Study system and genetic data
The focal system consists of seven interconnected lakes or ‘ponds’ (P1–P7: Fig. 1) in the Upper Humber River, Gros Morne National Park, Newfoundland (details in Gomez-Uchida et al. 2009), where Atlantic salmon (Salmo salar), brook trout (Salvelinus fontinalis) and Arctic char (Salvelinus alpinus) naturally co-occur as non-anadromous landlocked populations, probably founded from anadromous populations that survived the Wisconsinan glacial maximum (10,000–12,000 BP) (Batterson and Catto 2001; Shaw et al. 2006).
The genetic data correspond to a subset of these ponds (hereby subpopulations) (Gomez-Uchida et al. 2009) including individual samples from S. salar, S. fontinalis and S. alpinus genotyped for 12, 13, and 11 microsatellite loci, respectively (Table 1). Most microsatellites assayed for S. salar and S. fontinalis were species-specific, but the majority of microsatellites assayed for S. alpinus originated from related salmonids (see Supporting Information in Gomez-Uchida et al. 2009). However, a high number of alleles per locus for S. alpinus, compared with the other two species (Table 1), suggest that ascertainment bias is probably negligible, if present at all. We set a minimum size of 20 individuals per population sample to estimate Ne and meta-Ne, resulting in the exclusion of one subpopulation (P7) for S. salar, none for S. fontinalis, and two (P5 and P7) for S. alpinus and leaving 6, 7 and 3 (total 16) subpopulations available for analyses for each species, respectively (Table 1). Population genetics parameter estimates required for some models of meta- , namely global estimates of divergence and inbreeding and contemporary estimates of migration, were taken from Gomez-Uchida et al. (2009).
Effective population size (Ne)
Firstly, contemporary  was estimated for each local subpopulation and species using ONeSAMP 1.2 (hereafter
  OSMP; Tallmon et al. 2008). Briefly, the program employs approximate Bayesian computation to estimate the size of an ideal Wright-Fisher population (with no migration or selection) based on summary statistics calculated from the empirical data. The timescale to which the resulting Ne estimate applies is not explicit, but probably applies to recent generations (Luikart et al. 2010). We obtained four replicate estimates of
  and their 95% credible limits (CL) under the following prior
 values: NeMIN = 10 and NeMAX = 2000. Although
  OSMP appeared robust to different NeMIN values across subpopulations and species (e.g., NeMIN = 20, 40: authors' unpubl. results), changes in NeMAX were not assessed, also because effective sizes in the three salmonids species were initially thought unlikely to be much larger than NeMAX given the size of these small ponds.
Secondly, we estimated Ne plus parametric 95% confidence intervals (CI) using the linkage disequilibrium (LD) of LDNE (hereafter NeLDNE; Waples and Do 2008). LDNE estimates reflect the number of parents that contributed to the sample (Waples 2005) and assume that LD at unlinked loci arises solely from genetic drift in an isolated population (Hill 1981; Wang 2005). Following Waples and Do (2010), we set the cut-off probability (Pcrit) for alleles of low frequency to be included in the estimation at Pcrit = 1/2S, where S is the subpopulation sample size.
Effects of immigration on  LDNE and
  OSMP assuming open subpopulations
The estimator methods implemented here assume that populations are closed to migration (Tallmon et al. 2008; Waples and Do 2008), but violation of this assumption may result in estimation bias (Vitalis and Couvet 2001; Palstra and Ruzzante 2011; Waples and England 2011). We thus conducted exploratory analyses to assess the impact of immigration on  , by identifying and excluding putative migrants from samples, and repeating the estimation of Ne in ONeSAMP and LDNE.
First-generation immigrants were identified in GENECLASS 2 (Piry et al. 2004) through Bayesian assignment of genotype likelihoods (Rannala and Mountain 1997). Here, individual genotypes were ranked according to the ratio Lh/Lmax that relates the likelihood of drawing genotypes from the populations in which they were sampled (numerator) with the maximum likelihood of such genotypes considering any of the study populations (denominator). We assumed that all sources of migrants were sampled (Paetkau et al. 2004) and attempted to minimize erroneous identification of migrants by setting the type I error at α = 0.01 and by graphically assessing likelihood scatter plots between recipient and source populations.
Effective metapopulation size (meta-Ne)
The estimation of meta-Ne from genetic data depends on the underlying model of spatial genetic structure (Wang and Caballero 1999). We have assumed that within our system, extinction and recolonization were infrequent and thus our model was more related to a “patchy” or “mainland-island” metapopulation than a classic Levins metapopulation (Koizumi et al. 2006). Here, we estimated meta-Ne assuming seven different models (Table 2), Firstly, we simply summed the various estimates of local Ne (Σ(Ne)); this is our Null model. We then estimated the associated 95% confidence intervals following the standard equation SE(Σ ( ) = sqrt [Σ (SE(
 )2)]. This was done taking into consideration the fact that lower and upper confidence intervals differed from each other. Then, we estimated meta-
 as defined by the Island (Wright 1931), Stepping Stone (Maruyama 1970), and Neighborhood models (Wright 1946; Maruyama 1971). These models assume that all subpopulations contribute equally to the next generation, but differ regarding assumptions on the spatial configuration and connectivity of subpopulations, yielding meta-
 that should be larger than Null estimates (Table 2). Population parameters included in these models were taken from Table 1 or indirectly calculated from data obtained in Gomez-Uchida et al. (2009). Effective population density (D) for Neighborhood meta-
 was obtained by dividing the sum of subpopulation
  s by the linear habitat length (L = 11 km); the variance of dispersion distance (σ2) was estimated from the slope (b) of the isolation-by-distance relationship described in (Gomez-Uchida et al. 2009) according to 4Dσ2 = 1/b (Rousset 1997). Stepping Stone and Neighborhood meta-
 were ignored for S. alpinus, because we found no indications that an isolation-by-distance model was applicable to this species (Gomez-Uchida et al. 2009). Second, we calculated Interdemic meta-
 ; this model predicts meta-
 can be smaller than the Null estimate when accounting for variable fitness among subpopulations (Nunney 1999). Third, we explored Spatio-temporal meta-
 by Kobayashi and Yamamura (2007), which provides similar expectations to Island meta-
 , but is centered on the average number of contemporary immigrants (Table 2). Finally, we used the empirical ‘bottom-up’ approach of Tufto and Hindar (2003), which combines subpopulation
  s (
s ( calculated previously using ONeSAMP) with unidirectional migration rates (estimated using BIMr) to calculate T&H meta-
 . Here, we minimized the eigen-value of the resulting metapopulation matrix employing an R package (R Development Core Team 2010) developed by J. Tufto (available from http://www.math.ntnu.no/∼jarlet/migration/). Given sample size limitations (see above), meta-
 for S. fontinalis was estimated considering all seven subpopulations and for S.salar, it was estimated over six subpopulations (omitting P7). Salvelinus alpinus was collected in adequate numbers only in three ponds (P2–P4); therefore, meta-
 for this species was limited to those three ponds (see Results).
Table 2.
Models of spatial genetic structure and estimation of effective metapopulation size (meta-Ne) or the size of an idealized population with the same rate of inbreeding observed in the subdivided population under study
| Name | Model* | Expectations | Reference |
|---|---|---|---|
| Island | 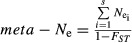 |
meta-Ne >  unless FST = 0; inequality increases with FST (divergence) unless FST = 0; inequality increases with FST (divergence) |
Wright (1943) |
| Stepping stone (circular) | 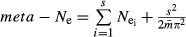 |
meta-Ne >  ; inequality increases with decreasing average immigration rate ( ; inequality increases with decreasing average immigration rate ( ) ) |
Maruyama (1970) |
| Neighborhood (linear) | 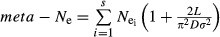 |
meta-Ne >  ; inequality increases with increasing length of the habitat (L), but decreases with increasing population density (D) ; inequality increases with increasing length of the habitat (L), but decreases with increasing population density (D) |
Wright (1946) Maruyama (1971) |
| Interdemic | 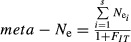 |
meta-Ne <  ; inequality increases with metapopulation inbreeding ; inequality increases with metapopulation inbreeding |
Nunney (1999) |
| Spatiotemporal | 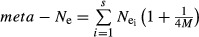 |
meta-Ne >  ; inequality increases with the average number of migrants per generation ; inequality increases with the average number of migrants per generation 
|
Kobayashi and Yamamura (2007) |
Metapopulation parameters: s = number of subpopulations/ponds;  = average subpopulation Ne; FST = global genetic divergence among subpopulations;
  = average immigration rate; D = linear population density (individuals/km); L = length of habitat (km); σ2 = variance of dispersion distance; FIT = coefficient of global (metapopulation) inbreeding.
Statistical analyses and hypothesis testing
We assessed the null hypothesis of no correlation between  and sample size using Kendall's τ correlation coefficient and two-tailed exact probabilities, given the uncertainty as to whether the data were drawn from a bivariate normal distribution or not. Such correlations permitted to evaluate any dependence of
  on sample size using ONeSAMP as LDNE provides unbiased estimates (Waples and Do 2008). To evaluate differences in Ne estimates among species, the null hypothesis of no differences was tested using nonparametric Kruskall–Wallis tests for multiple species comparisons and Mann–Whitney one-tailed tests for pairwise species comparisons. When replicates were available (e.g., ONeSAMP), we compared the harmonic means to minimize the contribution of overly distinct replicates. All tests were implemented using R 2.13.2 (R Development Core Team 2010).
Results
 : Comparisons between estimators and species
 was estimated for 16 species/subpopulation combinations (Fig. 1). While all 16
  values were finite, their magnitude differed across replicates, in some cases considerably so (Fig. 2a–c). For
  , on the other hand, only seven or eight estimates were finite depending on whether immigrants were included or excluded, most of which were concentrated among S. salar subpopulations (Fig. 2d–f). The range of values (box plots) for
  replicates was narrow for S. salar, intermediate for S. fontinalis and wide for S. alpinus (Fig. 2a–c). Two
  replicates exhibited extremely high upper confidence limits (in the millions of individuals). On the other hand, only four upper 95% CIs were finite with LDNE (Fig. 2). Finite
  estimates were generally poorly correlated with sample size (S. salar,
 τ = 0.69, P = 0.06; S. salar,
  τ = −0.10, P = 0.80; S. fontinalis,
  τ = −0.14, P = 0.77; no correlation test was performed with
  for S. fontinalis and no correlation tests were attempted for S. alpinus with only three estimates available). Comparisons of
  harmonic means among the three salmonids indicated significant differences (Kruskal–Wallis χ2 = 8.8, df = 2, P = 0.01); furthermore, one-tailed Mann–Whitney pairwise tests were consistent with a hierarchy of
  values as proposed (S. salar < S. fontinalis: P ≤ 0.05; S. fontinalis < S. alpinus: P ≤ 0.008; S. salar < S. alpinus: P ≤ 0.01). Complete details on sample sizes,
  , and
, and  can be found in Table S1 (Supporting Information).
Figure 2.
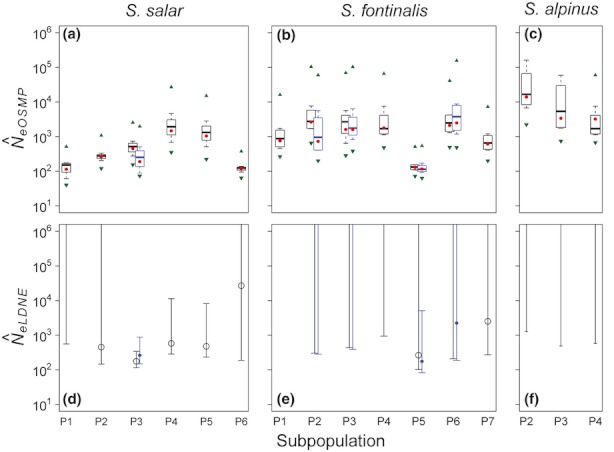
Estimates of effective population size ( ) and their uncertainty for Salmo salar (left column), Salvelinus fontinalis (middle column), and Salvelinus alpinus (right column) using two estimators,
  (top row; boxplots) and
  (second row; empty circles). Blue boxplots or filled circles are estimates of
  following exclusion of immigrant genotypes (see text for details), thus assuming populations open to gene flow. Red dots in boxplots are the harmonic means among four
  replicates, whereas green triangles represent the lowest (inverted triangles) and highest 95% CIs among four
  replicates. Missing or out-of-bound empty or filled symbols, upper 95% CIs, or both, suggest infinitely large values.
Immigrant genotypes and their impact on  and
and  (open subpopulations)
Immigrant genotypes that could be identified ranged between 1 and 3 among subpopulations and across species (Table S1). In four out of five S. fontinalis subpopulations, the likely source of immigrants was either P1 or P7, both ponds found above waterfalls (Fig. 1), whereas all three S. salar individuals identified as immigrants in P3 probably originated from P5 (Table S1). The weak population structure observed in S. alpinus prevented the reliable identification of potential immigrants for this species.
Both estimators –  OSMP and
  LDNE – suggested that the changes in
  after exclusion of immigrants were negligible and non-significant (Fig. 2, Table S1).
Meta- 
Given the generally low precision of  LDNE, the estimates of meta-Ne were based only on
  OSMP. Meta-
 differed across species by up to three orders of magnitude; it was smallest in S. salar, intermediate in S. fontinalis, and largest in S. alpinus. Moreover, these qualitative differences across species were constant regardless of the spatial population model assumed (Fig. 3). Indeed, the differences in meta-
 between estimator models were very small, with one notable exception: the meta-
 obtained with the Tufto and Hindar (2003) model, which were always much smaller than any of the other meta-Ne estimates. In fact, T&H meta-
 for S. salar and S. fontinalis were similar to the
  OSMP estimates obtained for both species in one subpopulation, P1 (Table S1 and Table 3).
Figure 3.
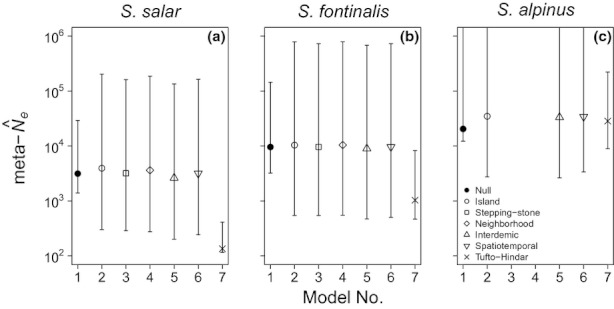
Estimates of meta-
 from the null model (sum of subpopulation Ne's) and six metapopulation models (island, stepping stone, neighborhood, interdemic, spatiotemporal, and Tufto-Hindar: see legend) for (a) Salmo salar, (b) Salvelinus fontinalis, and (c) Salvelinus alpinus. Stepping stone and neighborhood models require the assumption of isolation-by-distance and were therefore omitted for S. alpinus (see text for details).
Discussion
In this study, we estimated the local and metapopulation effective sizes of three salmonid fish species living in sympatry in a spatially fragmented system of seven interconnected subpopulations and exhibiting marked differences in demographic attributes as measured by the FST analysis of Gomez-Uchida et al. (2009). First, putative immigrants had negligible effects on estimates of local effective population size ( ) and the estimates generally fit our expectations based on demography and life history with the local effective size of S. salar < S. fontinalis < S. alpinus. Second, we implemented six approaches to estimate effective metapopulation size (meta-
 ) and compared these estimates with the sum of local
  ∑(
∑( ), a model we defined as Null. The majority of meta-Ne estimators yielded results indistinguishable from the sum of local sizes, despite considerable variation in population structure among the species. This suggests that these analytical models may not fully capture the complexity of natural systems or simply are not well suited for application to empirical data. On the other hand, the estimates obtained with the Tufto and Hindar (2003) approach [T&H meta-Ne] differed substantially from the other models and were strongly influenced by connectivity patterns inferred from the genetic data. The linear property of our system, combined with asymmetric dispersal facilitated by the presence of waterfalls, may thus have resulted in strong reductions in meta-Ne in line with other recent empirical work and theoretical expectations. Below, we review some caveats regarding the methods used to estimate contemporary local
  and discuss how immigration seemed to have negligible impacts on
  ; we then argue how possible differences in life history (migration and abundance) reflect on differences in average local
  s among species. We subsequently consider estimates of meta-
 and the similarities and differences among models within species. We finish by explicitly discussing our results in the context of known species differences in life history (migration as measured by gene flow) and abundance.
ONeSAMP and LDNE: Caveats and patterns across species
The two methods differed in performance within the scope of our study. Firstly, they differed in the number of finite  estimates they provided: all point estimates of effective population size were finite when estimated with ONeSAMP, but only seven or eight (depending on whether immigrants were included or excluded) were finite when estimated with LDNE. As the estimation of contemporary Ne depends largely on the genetic drift signal, which is stronger in smaller populations (Fraser et al. 2007; Palstra and Ruzzante 2008; Waples and Do 2010), it should not be surprising that both approaches provided finite values only for S. salar, the species with the lowest abundance and historical census size (Ryan and Kerekes 1988; Anions 1994).
Secondly, the two methods apply to different time scales: while LDNE uses linkage disequilibrium to estimate the effective size in the parental generation (Waples and Do 2008), ONeSAMP uses several metrics, including linkage disequilibrium (Tallmon et al. 2008) to estimate effective size over the last few, but undefined number of generations (Luikart et al. 2010; see also Skrbinsek et al. 2012). This is the likely cause of the discrepancy of results for S. salar in the headwater pond P1 (Fig. 2 and Table S1): the M-ratio test (Garza and Williamson (2001), which is considered in ONeSAMP, suggests that a bottleneck has occurred in this population (Gomez-Uchida et al. 2009), but this test statistic is not considered in the LDNE method. It should be noted, however, that the removal of first-generation migrants prior to the estimation of effective size does not necessarily completely eliminate the influence of migration if migration took place in previous generations. Such earlier migration could be affecting Ne particularly when estimated with ONeSAMP.
A third caveat regarding our replicated estimates of Ne is that they were all obtained with priors set at Nemin = 10 and Nemax = 2000. For S. salar, only few point estimates (3 out of 24) exceeded 2000 (Table S1), suggesting that the true Nes for this species falls mostly within this range. On the other hand, approximately one-third of the replicates for S. fontinalis, and two-thirds of the replicates for S. alpinus were higher than the Nmax prior (See Table S1). These results suggest that for these two species, and particularly for S. alpinus, the true Ne values may indeed be larger than 2000 and hence the program had difficulty estimating them (David Tallmon, personal communication). Our caveats notwithstanding, Beebee (2009) also found that NeOSMP showed higher precision than Ne LDNE for natterjack toad (Bufo calamita) populations for which N varied between 2 and 500, that is, within the range of the estimates found for S. salar in our study.
Additionally, age-structure and overlapping generations can significantly complicate the estimation of Ne (Palstra et al. 2009). We used samples consisting of different ages, which probably reflect a quantity intermediate between Ne and Nb, the annual number of breeders (Waples 2006). The samples analyzed in this study may include three or four cohorts based on length ranges (S. salar: 78–248 mm; S. fontinalis: 50–230 mm; S. alpinus: 87–157 mm, authors' unpublished results) and length-at-age data from earlier surveys in Gros Morne National Park (Rombough et al. 1978; Barbour et al. 1979; McCairns 2004). The number of cohorts in our samples thus approximates the mean generation length (G) based on estimates of the mean age of reproductive parents in this system (S. salar G = 4.5: (Rombough et al. 1978); S. fontinalis G = 4.5: (McCairns 2004); S. alpinus G = 3.5: (Barbour et al. 1979). Under such sampling conditions, Waples and Do (2010) suggested that Nb ≍ Ne, even though other researchers have opted to report their estimates as Nb (e.g., (Beebee 2009) or apply the correction Ne = GNb (e.g., Ardren and Kapuscinski 2003; see also Robinson and Moyer 2012). Therefore, it may be recommendable to complement single- with two-sample temporal estimates, especially methods tailored to gauge allele frequency shifts between cohorts, which require individual ages (Palstra et al. 2009; Waples and Do 2010).
To summarize, the local effective sizes for the S. alpinus and S. fontinalis populations studied here are likely larger than can reliably be estimated given the sample sizes (S∼ 90–100) and numbers of microsatellite loci (L∼12–13) available, but this limitation appears to be stronger for LDNE than for ONeSAMP. Overall, NeOSMP may therefore appear to be more general than NeLDNE, due to the rationale and flexibility of its methodology (prior specifications, simulation approach). On the other hand, the main drawback of ONeSAMP may be its undefined temporal reference (Luikart et al. 2010; see also Skrbinsek et al. 2012), thereby reducing its utility for genetic monitoring. Ultimate choice of Ne estimator should be guided by the specific aims and goals of each study.
Impacts on  and
and  of accounting for gene flow
We attempted to account for the effect of gene flow among subpopulations by re-estimating effective population sizes after eliminating putative immigrants. This approach was implemented with the two species for which immigrants were identified: S. salar and S. fontinalis. Although in all cases the point estimates of Ne decreased after the removal of putative migrants, these decreases were minor and non-significant (Fig. 2), suggesting that migration may be sustained and at equilibrium between genetically similar sources (Waples and England 2011). We reiterate, however, that the removal of first-generation migrants does not necessarily completely remove the influence of migrants in the estimation of Ne. As linkage disequilibrium between physically unlinked loci decreases by 50% each generation, any LD caused by migration in the grand-parental or great-grand-parental generation would probably still influence the estimation of Ne with either method.
Comparisons of Ne among species
Despite the limitations imposed by the relatively large population sizes for two of our study species, both approaches provided similar insight into putative links between population abundance, life history and Ne. Pairwise comparisons highlighted that S. alpinus probably has higher Ne than the other two species, matching expectations based on its life history and abundance (e.g., high population abundance and connectivity (Gomez-Uchida et al. 2009). Landlocked S. alpinus from Gros Morne National Park aggregate in large numbers in only three subpopulations of the watershed (Gomez-Uchida et al. 2009) and are rare or even absent in other lakes within the system (authors' personal observations). Arctic charr were described as having slow growth, low fecundity, and early age at maturity by previous authors (3 years, Rombough et al. 1978), all likely consequences of intense inter- and intraspecific competition in low-productive acidic lakes (Rombough et al. 1978; Anions 1994). The adult census estimate of N ˜ 13,000 for S. alpinus within one pond (P2) based on mark-recapture (Anions 1994) suggests that Ne for this species should indeed be large, at least in the order of a few thousands, even though imprecision of this effective population size estimate may be an issue. Massive densities of so-called dwarfed or ‘stunted’ S. alpinus populations have also been described in Norwegian oligotrophic lakes (Jansen et al. 2002; Persson et al. 2007). Conversely, the estimated adult census size for S. salar within P2 was N ∼ 1000 (Anions 1994), a number that is consistent with the estimate of effective size obtained for this species within this pond (Fig. 2). We found significant differences in  between S. salar and S. fontinalis, two salmonids that showed a similar range of distribution in the watershed (in all subpopulations but one, P7) and comparable average immigration rates, but a nearly twofold difference in adult population sizes, a finding that is consistent with our hypothesis.
Effective metapopulation size (meta-Ne)
Theory predicts that, under the simplified and restrictive assumptions of the island model, the effective size of a metapopulation will be higher than the sum of subpopulation Ne (reviewed in Wang and Caballero 1999). Unsurprisingly, these predictions are borne out in the analyses that are explicitly underpinned by those assumptions. The difference between ( ) and island model meta-
 was proportional to the degree of fragmentation, with S. salar exhibiting the most pronounced spatial structure (highest FST), and also the largest difference between (
 ) and meta-
 . On the other hand, we find a remarkable consistency across estimates of meta-Ne for the majority of analytical models considered, despite the considerable range of population structuring observed (0.020 ≤ FST ≤ 0.202). Moreover, within species, these models provided highly similar estimates of meta-Ne that did not deviate strongly from ∑(
 ). Although these models make very different assumptions about the metapopulation and consider different genetic parameters, in practice, their meta-Ne estimates can often be reasonably approximated by simply summing individual population Ne estimates. Further testing of these models in different systems and species is naturally required to assess the validity of this observation.
The notable exception to this pattern was the meta-Ne estimate obtained with the empirical method of Tufto and Hindar (2003). This approach provided estimates, which were considerably smaller than ∑( ) as expected under conditions of strongly asymmetric gene flow among metapopulation components (Whitlock and Barton 1997; Nunney 1999). Indeed, the Tufto and Hindar (2003) model makes fewer restrictive assumptions about metapopulation dynamics than the other methods, allowing for consideration of heterogeneity in the size of metapopulation components and gene flow among these components. For instance, in the present study, both S. salar and S. fontinalis were very abundant in one of the headwater ponds or subpopulations (P1), which lie above a waterfall that impedes upstream migration. This is also the case for P7, another headwater subpopulation where S. fontinalis was found in great numbers. Under such conditions, the reproductive contributions among demes may diverge strongly from expectations of equality. Indeed, for both species, meta-
 was very similar to the estimate of local population effective size in the upstream (headwater) population. Hence, genetic diversity in this (linear) system, for at least two study species, may be largely controlled by the diversity that exists in the ‘upstream’ source population. This inference is compatible with Pringle et al. (2011), who suggested that in systems with asymmetric gene flow, the upstream edge can influence genetic diversity throughout the entire species' range. Conversely, in S. alpinus, we documented populations with typically high abundance (Table S1) and relatively high and symmetric migration patterns among populations, and meta-
 was intermediate between the smallest and largest subpopulations
  . Therefore, our results provide further empirical support for the theoretical expectation (Whitlock and Barton 1997) that strong inequality among demes in contribution to the shared gene pool can reduce the effective size of a subdivided population.
To synthesize, in this study, we have estimated local or subpopulation effective sizes, as well as gene flow among them, in three sympatric species of salmonids fishes. We then compared the sum of these local effective sizes ∑( ) to the meta-
 obtained under the Tufto and Hindar (2003) model. The relative magnitude of T&H meta-
 across species was consistent with estimates of relative abundance available for one of the ponds at a different point in time (Ryan and Kerekes 1988; Anions 1994). Moreover, this pattern mirrors the hierarchy and degree of asymmetry in population connectivity described in Gomez-Uchida et al. (2009). As our study species shared a common environment, differential riverscape effects are unlikely to have shaped these patterns. Rather, the apparent relation between connectivity patterns and census population sizes across species which share a common environment, provides further support for the notion that density-dependent dispersal may play an important role in the maintenance of genetic diversity in aquatic systems and in metapopulations in general.
Acknowledgments
We thank D. Tallmon for assistance with the ONeSAMP server (http://genomics.jun.alaska.edu/asp/Default.aspx). We thank Parks Canada's scientist S. Gerrow, and field technicians T. Gallant, T. Hann, R. Reid, and summer students H. Buchanan and L. House, from the Western Newfoundland and Labrador unit for their assistance in the field. Field and laboratory work were supported by a grant from the Parks Canada Ecological Integrity, Innovation and Leadership Fund (PC-EIILF) awarded to TWK and DER and by an NSERC Discovery grant to DER.
Conflict of Interest
None declared.
Supporting Information
Additional Supporting Information may be found in the online version of this article:
Table S1. Brook trout (Salvelinus fontinalis), Atlantic salmon (Salmo salar), and Arctic charr (Salvelinus alpinus) estimates of effective population size per pond (Ne) plus 95% credible limits (CL) or confidence interval (CI) using ONeSAMP and LDNE, respectively.
References
- Anions MFE. Resource Description and Analysis. Halifax: Parks Canada; 1994. The freshwater fish of Gros Morne National Park; p. 69. [Google Scholar]
- Ardren WR, Kapuscinski AR. Demographic and genetic estimates of effective population size (N-e) reveals genetic compensation in steelhead trout. Mol. Ecol. 2003;12:35–49. doi: 10.1046/j.1365-294x.2003.01705.x. [DOI] [PubMed] [Google Scholar]
- Barbour SE, Rombough PJ, Kerekes JJ. Life-history and ecologic study of an isolated population of dwarf Ouanananiche, Salmo salar, from Gros-Morne National Park, Newfoundland. Naturaliste Can. 1979;106:305–311. [Google Scholar]
- Batterson MJ, Catto NR. Topographically-controlled deglacial history of the Humber River Basin, western Newfoundland. Geographie Physique Et Quaternaire. 2001;55:213–228. [Google Scholar]
- Beebee TJC. A comparison of single-sample effective size estimators using empirical toad (Bufo calamita) population data: genetic compensation and population size-genetic diversity correlations. Mol. Ecol. 2009;18:4790–4797. doi: 10.1111/j.1365-294X.2009.04398.x. [DOI] [PubMed] [Google Scholar]
- Frankham R. Conservation genetics. Annu. Rev. Genet. 1995;29:305–327. doi: 10.1146/annurev.ge.29.120195.001513. [DOI] [PubMed] [Google Scholar]
- Fraser DJ, Lippe C, Bernatchez L. Consequences of unequal population size, asymmetric gene flow and sex-biased dispersal on population structure in brook charr (Salvelinus fontinalis) Mol. Ecol. 2004;13:67–80. doi: 10.1046/j.1365-294x.2003.02038.x. [DOI] [PubMed] [Google Scholar]
- Fraser DJ, Hansen MM, Ostergaard S, D, Tessier N, Legault M, Bernatchez L. Comparative estimation of effective population sizes and temporal gene flow in two contrasting population systems. Mol. Ecol. 2007;16:3866–3889. doi: 10.1111/j.1365-294X.2007.03453.x. [DOI] [PubMed] [Google Scholar]
- Garza JC, Williamson EG. Detection of reduction in population size using data from microsatellite loci. Mol. Ecol. 2001;10:305–318. doi: 10.1046/j.1365-294x.2001.01190.x. [DOI] [PubMed] [Google Scholar]
- Gomez-Uchida D, Dunphy KP, O'Connell MF, Ruzzante DE. Genetic divergence between sympatric Arctic charr Salvelinus alpinus morphs in Gander Lake, Newfoundland: roles of migration, mutation and unequal effective population sizes. J. Fish Biol. 2008;73:2040–2057. [Google Scholar]
- Gomez-Uchida D, Knight TW, Ruzzante DE. Interaction of landscape and life history attributes on genetic diversity, neutral divergence and gene flow in a pristine community of salmonids. Mol. Ecol. 2009;18:4854–4869. doi: 10.1111/j.1365-294X.2009.04409.x. [DOI] [PubMed] [Google Scholar]
- Hänfling B, Weetman D. Concordant genetic estimators of migration reveal anthropogenically enhanced source-sink population structure in the River Sculpin, Cottus gobio. Genetics. 2006;173:1487–1501. doi: 10.1534/genetics.105.054296. [DOI] [PMC free article] [PubMed] [Google Scholar]
- Hill WG. Estimation of effective population size from data on linkage disequilibrium. Genet. Res. 1981;38:209–216. [Google Scholar]
- Hoeck PEA, Bollmer JL, Parker PG, Keller LF. Differentiation with drift: a spatio-temporal genetic analysis of Galapagos mockingbird populations (Mimus spp.) Philos. Trans. R Soc. Lond. B Biol. Sci. 2010;365:1127–1138. doi: 10.1098/rstb.2009.0311. [DOI] [PMC free article] [PubMed] [Google Scholar]
- Jansen PA, Finstad AG, Langeland A. The relevance of individual size to management of Arctic charr, Salvelinus alpinus, populations. Environ. Biol. Fishes. 2002;64:313–320. [Google Scholar]
- Kaeuffer R, Coltman DW, Chapuis JL, Reale D, Pontier D. The effects of cyclic dynamics and mating system on the effective size of an island mouflon population. Mol. Ecol. 2007;16:4482–4492. doi: 10.1111/j.1365-294X.2007.03501.x. [DOI] [PubMed] [Google Scholar]
- Kobayashi Y, Yamamura N. How to compute the effective size of spatiotemporally structured populations using separation of time scales. Theor. Popul. Biol. 2007;71:174–181. doi: 10.1016/j.tpb.2006.12.001. [DOI] [PubMed] [Google Scholar]
- Koizumi WE, Yamamoto S, Maekawa K. Decomposed pairwise regression analysis of genetic and geographic distances reveals a metapopulation structure of stream-dwelling Dolly Vardencharr. Mol. Ecol. 2006;15:3175–3189. doi: 10.1111/j.1365-294X.2006.03019.x. [DOI] [PubMed] [Google Scholar]
- Kuparinen A, Tufto J, Consuegra S, Hindar K, Merilä J, Garcia de Leaniz C. Effective size of an Atlantic salmon (Salmo salar L.) metapopulation in Northern Spain. Conserv. Genet. 2010;11:1559–1565. [Google Scholar]
- Lande R. Genetics and demography in Biological Conservation. Science. 1988;241:1455–1460. doi: 10.1126/science.3420403. [DOI] [PubMed] [Google Scholar]
- Luikart G, Ryman N, Tallmon DA, Schwartz MK, Allendorf FW. Estimation of census and effective population sizes: the increasing usefulness of DNA-based approaches. Conserv. Genet. 2010;11:355–373. [Google Scholar]
- Manier MK, Arnold SJ. Population genetic analysis identifies source-sink dynamics for two sympatric garter snake species (Thamnophis elegans and Thamnophis sirtalis) Mol. Ecol. 2005;14:3965–3976. doi: 10.1111/j.1365-294X.2005.02734.x. [DOI] [PubMed] [Google Scholar]
- Manier MK, Arnold SJ. Ecological correlates of population genetic structure: a comparative approach using a vertebrate metacommunity. Philos. Trans. R Soc. B Biol. Sci. 2006;273:3001–3009. doi: 10.1098/rspb.2006.3678. [DOI] [PMC free article] [PubMed] [Google Scholar]
- Maruyama T. Analysis of population structure.7. One-dimensional stepping-stone models of finite length. Ann. Hum. Genet. 1970;34:201. doi: 10.1111/j.1469-1809.1970.tb00235.x. [DOI] [PubMed] [Google Scholar]
- Maruyama T. Analysis of population structure. 2-Dimensional stepping stone models of finite length and other geographically structured populations. Ann. Hum. Genet. 1971;35:179–196. doi: 10.1111/j.1469-1809.1956.tb01391.x. [DOI] [PubMed] [Google Scholar]
- McCairns RJS. Halifax, Nova Scotia, Canada: Dalhousie University; 2004. Adaptive variability in response to differences in seasonality: a study of countergradient variation in the growth of brook trout, Salvelinus fontinalis, from western Newfoundland. [M.Sc. thesis] [Google Scholar]
- Nunney L. The effective size of a hierarchically structured population. Evolution. 1999;53:1–10. doi: 10.1111/j.1558-5646.1999.tb05328.x. [DOI] [PubMed] [Google Scholar]
- Paetkau D, Slade R, Burden M, Estoup A. Genetic assignment methods for the direct, real-time estimation of migration rate: a simulation-based exploration of accuracy and power. Mol. Ecol. 2004;13:55–65. doi: 10.1046/j.1365-294x.2004.02008.x. [DOI] [PubMed] [Google Scholar]
- Palstra F, Ruzzante DE. Genetic estimates of contemporary effective population size: what can they tell us about the importance of genetic stochasticity for wild population persistence? Mol. Ecol. 2008;17:3428–3447. doi: 10.1111/j.1365-294x.2008.03842.x. [DOI] [PubMed] [Google Scholar]
- Palstra FP, Ruzzante DE. Contemporary meta-population effective size: factors influencing its empirical estimation in salmonid fish. Heredity. 2011;107:444–455. doi: 10.1038/hdy.2011.31. [DOI] [PMC free article] [PubMed] [Google Scholar]
- Palstra FP, O'Connell MW, Ruzzante DE. Age structure, demography and effective population size in Atlantic salmon (Salmo salar. Genetics. 2009;182:1233–1249. doi: 10.1534/genetics.109.101972. [DOI] [PMC free article] [PubMed] [Google Scholar]
- Persson L, Amundsen PA, Klemetsen AM, De Roos A, Knudsen R, Primicerio R. Culling prey promotes predator recovery – alternative states in a whole-lake experiment. Science. 2007;316:1743–1746. doi: 10.1126/science.1141412. [DOI] [PubMed] [Google Scholar]
- Piry S, Alapetite A, Cornuet JM, Paetkau D, Baudouin L, Estoup A. GENECLASS2: a software for genetic assignment and first-generation migrant detection. J. Hered. 2004;95:536–539. doi: 10.1093/jhered/esh074. [DOI] [PubMed] [Google Scholar]
- Pringle JM, Blakeslee AMH, Byers JE, Roman J. Asymmetric dispersal allows upstream region to control population structure throughout a species' range. Proc. Natl. Acad. Sci. 2011;108:15288–15293. doi: 10.1073/pnas.1100473108. [DOI] [PMC free article] [PubMed] [Google Scholar]
- R Development Core Team. R: a language and environment for statistical computing. Vienna, Austria: R Foundation for Statistical Computing; 2010. ISBN 3-900051-07-0, Available via http://www.R-project.org. [Google Scholar]
- Rannala B, Mountain JL. Detecting immigration by using multilocus genotypes. Proc. Natl. Acad. Sci. USA. 1997;94:9197–9201. doi: 10.1073/pnas.94.17.9197. [DOI] [PMC free article] [PubMed] [Google Scholar]
- Robinson JD, Moyer GR. Linkage disequilibrium and effective population size when generations overlap. Evol. Appl. 2012 doi: 10.1111/j.1752-4571.2012.00289.x. doi: 10.1111/j.1752-4571.2012.00289.x. [DOI] [PMC free article] [PubMed] [Google Scholar]
- Rombough PJ, Barbour SE, Kerekes JJ. Life history and taxonomic status of an isolated population of Arctic char, Salvelinus alpinus, from Gros Morne National Park, Newfoundland. J. Fish. Res. Board Can. 1978;35:1537–1541. [Google Scholar]
- Rousset F. Genetic differentiation and estimation of gene flow from F-statistics under isolation by distance. Genetics. 1997;145:1219–1228. doi: 10.1093/genetics/145.4.1219. [DOI] [PMC free article] [PubMed] [Google Scholar]
- Ryan PM, Kerekes JJ. Canadian Technical Report of Fisheries and Aquatic Sciences. Newfoundland: St. John's; 1988. Characteristics of sport fish populations in six experimentally fished Salmonid Lakes of Gros Morne National Park, Newfoundland; p. 172. Oceans DoFa. [Google Scholar]
- Shaw J, Piper DJW, Fader GBJ, King EL, Todd BJ, Bell T. A conceptual model of the deglaciation of Atlantic Canada. Quatern. Sci. Rev. 2006;25:2059–2081. [Google Scholar]
- Skrbinsek T, Jelenic M, Waits L, Kos I, Jerina K, Yrontelj P. Monitoring the effective population size of a brown bear (Ursus arctos) population using new single-sample approaches. Mol. Ecol. 2012;21:862–875. doi: 10.1111/j.1365-294X.2011.05423.x. [DOI] [PubMed] [Google Scholar]
- Tallmon DA, Koyuk A, Luikart G, Beaumont MA. ONeSAMP: a program to estimate effective population size using approximate Bayesian computation. Mol. Ecol. Res. 2008;8:299–301. doi: 10.1111/j.1471-8286.2007.01997.x. [DOI] [PubMed] [Google Scholar]
- Tufto J, Hindar K. Effective size in management and conservation of subdivided populations. J. Theor. Biol. 2003;222:273–281. doi: 10.1016/s0022-5193(03)00018-3. [DOI] [PubMed] [Google Scholar]
- Turner TF, Trexler JC, Kuhn DN, Robison HW. Life-history variation and comparative phylogeography of darters (Pisces: Percidae) from the North American central highlands. Evolution. 1996;50:2023–2036. doi: 10.1111/j.1558-5646.1996.tb03589.x. [DOI] [PubMed] [Google Scholar]
- Vitalis R, Couvet D. Estimation of effective population size and migration rate from one- and two-locus identity measures. Genetics. 2001;157:911–925. doi: 10.1093/genetics/157.2.911. [DOI] [PMC free article] [PubMed] [Google Scholar]
- Walter RP, Aykanat T, Kelly DW, Shrimpton JM, Heath DD. Gene flow increases temporal stability of Chinook salmon (Oncorhynchus tshawytscha) populations in the Upper Fraser River, British Columbia, Canada. Can. J. Fish. Aquat. Sci. 2009;66:167–176. [Google Scholar]
- Wang JL. Estimation of effective population sizes from data on genetic markers. Philos. Trans. R Soc. B Biol. Sci. 2005;360:1395–1409. doi: 10.1098/rstb.2005.1682. [DOI] [PMC free article] [PubMed] [Google Scholar]
- Wang JL, Caballero A. Developments in predicting the effective size of subdivided populations. Heredity. 1999;82:212–226. [Google Scholar]
- Wang J, Whitlock M. Estimating effective population size and migration rates from genetic samples over space and time. Genetics. 2003;163:429–446. doi: 10.1093/genetics/163.1.429. [DOI] [PMC free article] [PubMed] [Google Scholar]
- Waples RS. Genetic estimates of contemporary effective population size: to what time periods do the estimates apply? Mol. Ecol. 2005;14:3335–3352. doi: 10.1111/j.1365-294X.2005.02673.x. [DOI] [PubMed] [Google Scholar]
- Waples RS. A bias correction for estimates of effective population size based on linkage disequilibrium at unlinked gene loci. Conserv. Genet. 2006;7:167–184. [Google Scholar]
- Waples RS, Do C. LDNE: a program for estimating effective population size from data on linkage disequilibrium. Mol. Ecol. Res. 2008;8:753–756. doi: 10.1111/j.1755-0998.2007.02061.x. [DOI] [PubMed] [Google Scholar]
- Waples RS, Do C. Linkage disequilibrium estimates of contemporary N-e using highly variable genetic markers: a largely untapped resource for applied conservation and evolution. Evol. Appl. 2010;3:244–262. doi: 10.1111/j.1752-4571.2009.00104.x. [DOI] [PMC free article] [PubMed] [Google Scholar]
- Waples RS, England PR. Estimating contemporary effective population size on the basis of linkage disequilibrium in the face of migration. Genetics. 2011;189:633–644. doi: 10.1534/genetics.111.132233. [DOI] [PMC free article] [PubMed] [Google Scholar]
- Whiteley AR, Spruell P, Allendorf FW. Ecological and life history characteristics predict population genetic divergence of two salmonids in the same landscape. Mol. Ecol. 2004;13:3675–3688. doi: 10.1111/j.1365-294X.2004.02365.x. [DOI] [PubMed] [Google Scholar]
- Whitlock MC, Barton NH. The effective size of a subdivided population. Genetics. 1997;146:427–441. doi: 10.1093/genetics/146.1.427. [DOI] [PMC free article] [PubMed] [Google Scholar]
- Wright S. Evolution in Mendelian populations. Genetics. 1931;16:0097–0159. doi: 10.1093/genetics/16.2.97. [DOI] [PMC free article] [PubMed] [Google Scholar]
- Wright S. Isolation by distance. Genetics. 1943;28:114–138. doi: 10.1093/genetics/28.2.114. [DOI] [PMC free article] [PubMed] [Google Scholar]
- Wright S. Isolation by distance under diverse systems of mating. Genetics. 1946;31:39–59. doi: 10.1093/genetics/31.1.39. [DOI] [PMC free article] [PubMed] [Google Scholar]
- Wright S. The interpretation of population structure by F-statistics with special regard to systems of mating. Evolution. 1965;19:395–420. [Google Scholar]
Associated Data
This section collects any data citations, data availability statements, or supplementary materials included in this article.