

Abstract
Background.
Fat accumulation in muscle may contribute to age-related declines in muscle function and is indicated by reduced attenuation of x-rays by muscle tissue in computed tomography scans. Reduced trunk muscle attenuation is associated with poor physical function, low back pain, and increased hyperkyphosis in older adults. However, variations in trunk muscle attenuation with age, sex and between specific muscles have not been investigated.
Methods.
A cross-sectional examination of trunk muscle attenuation in computed tomography scans was performed in 60 younger (35–50 years) and 60 older (75–87 years) adults randomly selected from participants in the Framingham Heart Study Offspring and Third Generation Multidetector Computed Tomography Study. Computed tomography attenuation of 11 trunk muscles was measured at vertebral levels T8 and L3, and the effects of age, sex, and specific muscle on computed tomography attenuation of trunk muscles were determined.
Results.
Muscle attenuation varied by specific muscle (p < .001), was lower in older adults (p < .001), and was generally lower in women than in men (p < .001), although not in all muscles. Age-related differences in muscle attenuation varied with specific muscle (p < .001), with the largest age differences occurring in the paraspinal and abdominal muscles.
Conclusions.
Trunk muscle attenuation is lower in older adults than in younger adults in both women and men, but such age-related differences vary widely between muscle groups. The reasons that some muscles exhibit larger age-related differences in fat content than others should be further explored to better understand age-related changes in functional capacity and postural stability.
Age-related declines in muscle strength result in the loss of 20%–40% of strength by the seventh and eighth decades of life (1). However, muscle strength declines more rapidly than lean mass or muscle size in older adults, suggesting that an age-related reduction in muscle quality, that is, muscle strength per muscle mass or size (2–4), contributes to lost muscle strength (2,4). One factor that may affect muscle quality is the fat content in skeletal muscle tissue, which is increased in older adults compared with younger adults (5) and is indicated by reduced attenuation of x-rays by muscle tissue in computed tomography scans (6). Muscle attenuation, as an indicator of fat accumulation, is related to muscle strength and physical function. For example, low thigh muscle attenuation is associated with reduced knee extensor strength (3) and reduced lower extremity performance (7) independent of muscle size. Interestingly, reduced thigh muscle attenuation is also associated with increased risk of fractures in older adults, independent of bone mineral density (8,9). Moreover, several studies have associated trunk muscle attenuation with functional outcomes in older adults. In particular, trunk muscle attenuation is more strongly associated with functional capacity in older adults than thigh muscle attenuation (10). In addition, low trunk muscle attenuation in older adults is associated with more low back pain (10) and increased hyperkyphosis (11) and is predictive of a greater loss in functional capacity over time (12). Taken together, these studies suggest that low trunk muscle attenuation indicates impaired physical function and increased risk of disability and injury in older adults.
Although the fat content of muscle has been shown to be higher in older adults than in younger adults using needle biopsy of the quadriceps (5) and intermuscular fat in the thigh has been found to increase with age in older adults (2), no studies to date have examined muscle attenuation in younger adults. Thus, while it is likely that muscle attenuation is lower in older adults than in younger adults, such differences have not been quantified. In addition, many studies examining muscle attenuation have examined only thigh muscles (2,3,6–9,13,14), and there has been little investigation of the differences in attenuation between different muscle groups. Goodpaster and coworkers (3) reported that hamstring attenuation was lower than that of the quadriceps, indicating that muscle attenuation varies between different muscle groups. However, although the trunk has multiple muscle groups with different functional roles, studies examining trunk muscle attenuation have reported attenuation for a limited subset of trunk muscles. Specifically, Hicks and coworkers (10,12) reported average muscle attenuation for combined abdominal, lateral, and paraspinal muscles at the level of the L4–L5 disc, whereas Katzman and coworkers (11) reported attenuation for the paraspinal muscles only at the same level. Thus, variations in trunk muscle attenuation with age and between specific muscles remain unknown.
To address the gaps in knowledge, the purpose of this study was to describe muscle attenuation in the major muscles of the lumbar and thoracic trunk in a community-based sample of adults and investigate how muscle attenuation varies with specific muscle, age, and sex. We hypothesized that muscle attenuation would be lower in older adults than in younger adults, that muscle attenuation would vary between different muscles, and that age-related differences in muscle attenuation would vary between different muscles. We also hypothesized that muscle attenuation would be lower in women than in men, as several previous studies have reported (3,9,10). Explicitly examining both younger and older adults and comparing muscle attenuation between different muscles will provide a better understanding of how fat accumulates in skeletal muscle within the trunk, with implications for physical function, disability, pain, and risk of injury in older adults.
Methods
Participants
An age- and sex-stratified sample of 120 individuals was selected from 3,479 individuals who underwent a computed tomography exam as part of the Framingham Heart Study Offspring and Third Generation Multidetector Computed Tomography Study (15). Effect size estimates from preliminary muscle attenuation measurements in 54 scans indicated that age differences in muscle attenuation should be detectable in all trunk muscles with 27 participants per group, and 30 participants were selected for each age–sex group. The younger age group (30 men, 30 women) was randomly selected from participants aged 35–50 years, whereas the older age group (30 men, 30 women) was randomly selected from participants aged 75 years and older (range of selected individuals 75–87 years). Of the 120 participants originally selected, six participants were excluded due to scoliosis or data errors, and six additional participants were randomly selected to replace them.
Volumetric computed tomography scans were acquired using an eight-slice multidetector scanner (Lightspeed Ultra, General Electric, Milwaukee, WI) and included a chest scan that imaged approximately thoracic vertebral levels T7–T11 and an abdominal scan that imaged approximately vertebral levels L2–L5. Scans had a slice thickness of 2.5mm and a nominal in-plane pixel size of 0.68 × 0.68mm. This study was approved by the institutional review boards of Boston University, Beth Israel Deaconess Medical Center, and Hebrew Rehabilitation Center.
Muscle Measurements
Muscle attenuation was determined in both the thoracic and lumbar regions of the trunk, specifically for six muscles at the T8 vertebral level and eight muscles at the L3 vertebral level as identified in Figure 1. Each computed tomography image was spatially filtered using a sigma filter to reduce noise, and each muscle was contoured at the mid-vertebral slice for T8 and L3 using an image processing program (Analyze, Biomedical Imaging Resource, Mayo Clinic, Rochester, MN) (16). Muscle size was calculated as cross-sectional area (CSA, cm2) within the muscle contour, and attenuation as the mean of voxel attenuation in Houndsfield units (HU) within each muscle, averaging the right and left sides. Attenuation values were standardized based on a hydroxyapatite phantom (Image Analysis, Inc., Lexington, KY) scanned with each patient, and voxels outside the range of −50 to 150 HU were excluded before CSA and attenuation calculations. To evaluate inter and intrareader reliability of the measurements, two readers each performed measurements on a set of scans from 16 participants and repeated these measurements on the same set of scans with a minimum of 2 weeks between repeated measurements.
Figure 1.

Cross-sectional views of the trunk at the levels of the T8 and L3 vertebrae, indicating the muscles measured at each level and their abbreviations. Six muscles on each side were measured at T8 and eight muscles on each side were measured at L3. Three of the muscles examined were present at both levels.
Analysis
Initially, a general linear mixed model analysis of variance was performed at each vertebral level, with muscle attenuation (in HU) as the dependent variable. Independent variables included specific muscle, age group, sex, and interaction terms (muscle × age, muscle × sex, age × sex). Subject was included as a random effect, and possible covariates, including muscle CSA, height, body mass, body mass index (BMI), and physical activity level, were examined and included in subsequent analyses if significant (p < .05). Physical activity level was reported using the physical activity index (PAI), which was designed to evaluate general history of daily activity based on self-report and provide an estimate of overall energy expenditure. In short, a questionnaire is administered by an interviewer to determine the average number of hours per day a participant spends in each of five levels of physical activity (basal, sedentary, slight, moderate, and heavy). The hours for each activity level are multiplied by corresponding weighting factors (1.0, 1.1, 1.5, 2.4, and 5.0 respectively), and the results are summed to determine PAI (17). A single imputation approach was used to replace missing PAI data in two participants.
Following the primary analysis, several subanalyses were performed. To examine differences in attenuation between specific muscles, a Tukey HSD test was performed within each age–sex group. Next, a two-way analysis of variance for age and sex was performed for each individual muscle, including muscle CSA and PAI as covariates. Finally, to compare age differences in muscle attenuation between muscles, linear contrasts were constructed to compare the age difference for each muscle in a level (T8 or L3) with the mean age difference among all other muscles in the level. All analyses were performed in JMP (SAS Institute, Cary, NC) with significance set at α = 0.05.
Results
A summary of subject characteristics by age and sex group is found in Table 1. Men were taller and weighed more than women, and the younger age group was taller than the older group (p < .001 for all). There were no significant differences in BMI or PAI score by age or sex.
Table 1.
Characteristics of Participants by Age–Sex Groups (mean ± SD)
| Characteristic | Younger Men (N = 30) | Older Men (N = 30) | Younger Women (N = 30) | Older Women (N = 30) | ||||
|---|---|---|---|---|---|---|---|---|
| Age (y) | 41.9±4.5 | 78.6±2.7 | 41.9±3.6 | 78.4±3.3 | ||||
| Height (m) | 1.77±0.07 | 1.72±0.05 | 1.65±0.06 | 1.57±0.06 | ||||
| Body mass (kg) | 86.1±11.6 | 83.9±11.0 | 70.6±18.9 | 68.5±15.3 | ||||
| BMI (kg/m2) | 27.4±3.6 | 28.4±4.1 | 26.0±6.4 | 28.0±6.1 | ||||
| PAI score | 36.9±6.5 | 35.3±5.5 | 36.0±4.9 | 35.4±7.2 |
Intrareader intraclass correlation coefficients (ICCs) were greater than .75 for all muscle CSAs and for all muscle attenuations except trapezius in one reader (ICC = .71). Interreader ICCs were greater than .75 for all muscle CSAs except latissimus dorsi in L3 (ICC = .63) and for all muscle attenuations. More than 70% of calculated ICCs were greater than .90, indicating good overall inter and intrareader reliability for muscle CSA and attenuation measurements.
Muscle attenuation measurements averaged 35.1±14.9 HU across all muscles, age groups, and sexes. Overall, muscle attenuation varied by specific muscle (p < .001), was lower in older adults (p < .001), and was higher in men than in women (p < .05) at both T8 and L3 (Table 2). Furthermore, the association with age and sex varied by specific muscle (interaction p < .001 for both). However, age associations were not different in men and women (p > .6 for age × sex interaction at both T8 and L3).
Table 2.
Mean ± SD Muscle Attenuation (HU) and Average Age and Sex Differences for Each Muscle Examined at Vertebral Levels T8 and L3 by Age–Sex Groups
| Muscle | Men | Women | Age Diff. | Sex Diff. | ||||||||
| Younger | Older | Younger | Older | |||||||||
| T8 | ||||||||||||
| Pectoralis major | 44.1±9.8 | 32.1±10.3 | 31.2±10.4 | 15.7±7.2 | 13.8* | 14.7† | ||||||
| Serratus anterior | 46.6±7.8 | 35.1±9.7 | 36.8±8.5 | 21.7±9.4 | 13.3* | 11.6† | ||||||
| Latissimus dorsi | 41.7±7.1 | 30.8±12.0 | 37.1±8.9 | 22.1±9.9 | 12.9* | 6.6† | ||||||
| Trapezius | 52.3±6.4 | 40.5±8.0 | 43.5±7.2 | 33.6±6.7 | 10.8* | 7.9† | ||||||
| Erector spinae | 51.0±6.7 | 31.8±13.9 | 41.7±9.5 | 29.0±11.5 | 15.9* | 6.0† | ||||||
| Transversospinalis | 50.0±12.1 | 27.7±13.7 | 42.6±10.5 | 17.8±13.9 | 23.5* | 8.6† | ||||||
| L3 | ||||||||||||
| Rectus abdominis | 38.1±12.3 | 15.8±10.2 | 33.7±12.9 | 6.7±13.0 | 24.6* | 6.7 | ||||||
| Latissimus dorsi | 34.4±5.7 | 17.7±17.2 | 22.2±13.6 | 10.0±12.8 | 14.5* | 9.9† | ||||||
| External oblique | 39.1±7.4 | 19.7±13.3 | 38.8±8.7 | 23.0±9.8 | 17.6* | −1.5 | ||||||
| Internal oblique | 48.2±5.2 | 39.6±9.6 | 44.6±7.2 | 33.2±8.7 | 10.0* | 5.0† | ||||||
| Erector spinae | 50.3±4.9 | 30.8±11.9 | 45.8±4.1 | 23.5±14.7 | 20.9* | 5.9† | ||||||
| Transversospinalis | 51.6±6.3 | 28.8±12.0 | 45.3±6.4 | 19.4±13.5 | 24.4* | 7.9† | ||||||
| Psoas major | 51.3±4.4 | 42.3±6.4 | 48.0±4.2 | 42.2±6.3 | 7.4* | 1.7 | ||||||
| Quadratus lumborum | 46.9±4.3 | 33.6±10.0 | 41.0±3.9 | 28.9±9.5 | 12.7* | 5.3† | ||||||
*Significant age difference (p < .05) in individual muscle analysis.
†Significant sex difference (p < .05).
Neither height (p > .40) and body mass (p > .15) nor BMI (p > .15) was associated with muscle attenuation values at either T8 or L3. In contrast, muscle attenuation increased with CSA at T8 (p = .002) but not at L3 (p = .202), and muscle attenuation increased with PAI (p < .05 at both levels). Thus, CSA and PAI were included as covariates in subsequent analyses, but height, body mass, and BMI were not. In analyses of age and sex effects for individual muscles, CSA was a significant covariate for pectoralis major at T8 and latissimus dorsi at L3 but not T8 (p < .05), and PAI was a significant covariate for pectoralis major at T8, latissimus dorsi at both L3 and T8, and erector spinae at L3 (p < .05).
Results from Tukey HSD tests highlighting the variation in muscle attenuation within each age–sex group are shown in Figure 2. Whereas differences between muscles varied by age–sex group, there were some differences that were consistent across all groups. Specifically, at T8 the trapezius consistently had high attenuation, which was greater than the attenuation in the pectoralis major. At L3, the psoas major consistently had high attenuation, which was greater than the attenuation in the latissimus dorsi, external oblique, and rectus abdominis. Conversely, the latissimus dorsi and rectus abdominis consistently had low attenuation, which was less than the attenuation in the internal oblique, erector spinae, and quadratus lumborum as well as the psoas major.
Figure 2.
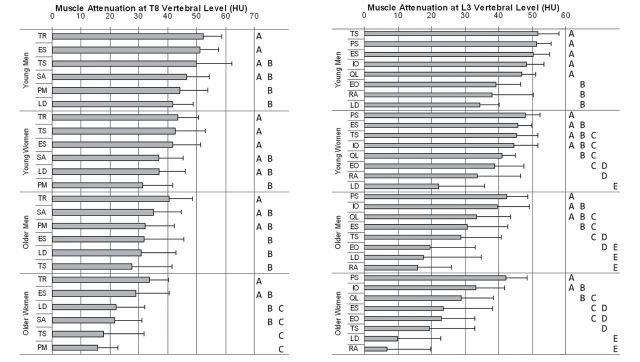
Mean muscle attenuation (Houndsfield units, HU) by muscle within age–sex groups at T8 (left) and L3 (right) levels of the trunk. Muscles are arranged in descending order by attenuation within each age–sex group, and error bars show +1 SD. Within each age–sex group, groups of muscles marked by the same letter do not have significantly different attenuation from each other, and thus muscles not marked by the same letter are significantly different (p < .05). See Figure 1 for definitions of muscle abbreviations.
On average, trunk muscle attenuation values were 6.9 HU lower in women than in men (p < .001) or 0.46 SD lower relative to the overall standard deviation of 14.9 HU. However, sex differences in muscle attenuation varied by muscle (interaction: p < .001) and were not significant for all individual muscles, as shown in Table 2. Specifically men had higher attenuation values for all muscles examined in individual muscle analyses at T8 (p < .01) and for all muscles measured at L3 (p < .05) except rectus abdominis (p = .141), external oblique (p = .532), and psoas major (p = .176).
Muscle attenuation was on average 15.9 HU or 1.07 standard deviations lower in older adults than in younger adults. In individual muscle analyses, age differences were significant for all muscles examined (p < .001). However, age differences in attenuation varied by muscle (interaction: p < .001) as highlighted in Figure 3. The age difference in muscle attenuation was smaller than average for trapezius (10.8 HU, 0.73 SD) compared with other muscles at T8, whereas the age difference for transversospinalis (23.5 HU, 1.58 SD) was larger than average. At L3, three muscles, the internal oblique (10.0 HU, 0.67 SD), psoas major (7.4 HU, 0.50 SD), and quadratus lumborum (12.7 HU, 0.85 SD) had lower than average age differences in attenuation, whereas the rectus abdominus (24.6 HU, 1.65 SD), erector spinae (20.9 HU, 1.41 SD), and transversospinalis (24.4 HU, 1.64 SD) had higher than average age differences in attenuation.
Figure 3.

Age differences (young − older) in mean muscle attenuation by muscle at vertebral levels T8 and L3. The dashed lines show mean age difference among all muscles within each level. *Age difference for muscle is significantly different than mean age difference for all other muscles in level (p < .005 in all cases). See Figure 1 for definitions of muscle abbreviations.
Discussion
In this cross-sectional community-based study, trunk muscle attenuation was lower in older adults than in younger adults in all muscles examined. This finding indicates greater fat accumulation in the muscles of older adults, which is in agreement with previous reports of increasing muscle fat content with age (2,5). Overall, trunk muscle attenuation values were lower in women than in men, which is also in agreement with previous reports indicating higher muscle fat content and lower muscle attenuation in women (3,5,9,10). In our study, women had lower muscle attenuation despite similar physical activity levels and body mass index as men, but sex differences in muscle attenuation were smaller than age differences and were absent in some muscles. Interestingly, there was no significant age × sex interaction, indicating that while muscle fat content is higher in women than in men throughout adult life, men and women experience similar levels of age-related fat accumulation in muscle.
The two covariates included in these analyses, CSA and PAI, were both positively associated with muscle attenuation when significant. For CSA, this indicates that smaller muscles tended to have lower attenuation. Although the reason for this is unclear, it is possible that both smaller muscle size and reduced attenuation can arise from less muscle use, that is, lower physical activity. The positive association between PAI and attenuation indicates that individuals with higher physical activity levels tend to have less fat accumulation in muscle, consistent with reports that strength training in elderly women increases muscle attenuation in the lower leg (14). Other studies have found that BMI is negatively correlated with muscle attenuation in the thigh (3,9), and BMI is negatively associated with physical activity level, but BMI was not a significant covariate in the primary analysis in this study. Finally, it is important to note that physical activity level, as measured by PAI, does not explain age differences in muscle attenuation. Large age-related differences in muscle attenuation remained with PAI included as a covariate, and older adults in this sample did not have significantly lower PAI than younger adults but had much lower muscle attenuation. However, although PAI has been validated and is correlated with measures such as handgrip strength and time to walk 10 ft (17), it is a self-report measure that may overestimate actual physical activity. For example, another self-report questionnaire on physical activity (the International Physical Activity Questionnaire) underreported the time spent sitting and overreported the time spent in physical activity in comparison to objectively measured accelerometry data (18). Furthermore, PAI is a measure of overall physical activity level and is not specific to trunk muscles. Thus, it is possible that more objective measures of physical activity and/or more specific measures of trunk muscle function, strength, or endurance may be more strongly associated with trunk muscle attenuation than PAI. In spite of these limitations, it appears unlikely that differences in physical activity contribute significantly to age-related differences in trunk muscle attenuation.
Muscle attenuation varied significantly among different muscles of the trunk. The psoas major had the highest overall attenuation across all age groups (indicating lowest fat accumulation), whereas the latissimus dorsi had the lowest overall attenuation (indicating highest fat accumulation). However, the differences in attenuation between muscles were not fully consistent between ages and sexes. Goodpaster and coworkers (3) reported that mean quadriceps attenuation in older adults was greater than mean hamstrings attenuation (41.1 vs 28.7 HU). In the current study, mean psoas attenuation in older adults (42.3 HU) was comparable to the previously reported quadriceps attenuation. However, the mean attenuation of rectus abdominis was 11.3 HU in older adults, indicating more variation in attenuation between different muscles in the trunk than has been previously reported in the thigh. The reason for variations in muscle attenuation between different muscles is unclear. Simoneau and coworkers (19) found that fiber-type composition was not directly predictive of muscle attenuation in the quadriceps, but muscle with lower attenuation had reduced oxidative capacity as assessed by enzyme markers of aerobic-oxidative and glycolytic pathways. Thus, it is possible that the capacity for fat oxidation varies between different muscles, leading to different levels of fat accumulation, and that impaired capacity of muscle for fat oxidation could lead to increased fat storage with aging. Further work is clearly needed to determine the factors that contribute to muscle-specific variations in muscle attenuation.
Age differences in muscle attenuation varied significantly between muscles. The muscles with the largest age differences were transversospinalis at both T8 and L3 and the rectus abdominis and erector spinae at L3. This is indicative of more fat accumulation with age in these muscles. As the abdominal and paraspinal muscles are important for stability of the trunk (20,21), large declines in the quality and function of these muscles could directly affect functional abilities and risk of injury in older adults. In fact, low attenuation of the paraspinal muscles is associated with increased hyperkyphosis in older adults (11), and low overall attenuation of the abdominal, lateral, and paraspinal muscles is associated with poor physical function, loss of physical function over time, and low back pain in older adults (10,12).
Because this study was cross-sectional in design, the results do not reflect longitudinal changes in muscle attenuation with aging. Prospective studies have demonstrated an association between low baseline trunk muscle attenuation and loss of physical function (12) and between low baseline thigh muscle attenuation and increased risk of fracture (8,9) in older adults. However, longitudinal investigations of muscle attenuation are needed to evaluate rates of decline in muscle attenuation and whether greater rates of decline are associated with poorer health outcomes. Additionally, the measurements of this study are representative of lean muscle composition and did not examine the amount of adipose tissue present in and around the muscles (ie, intermuscular fat depots) as has previously been done in the thigh (2,3,7). Finally, the racial make-up of the Framingham Study Offspring and Third Generation cohorts is primarily white, and racial differences in trunk muscle attenuation could not be examined, although thigh muscle attenuation has been reported to be lower in black women than in white women (2,3,7). In spite of these limitations, this study has several important strengths. Perhaps most importantly, it draws upon a community-based cohort of individuals. Additionally, it is the first study to examine muscle attenuation in both younger and older adults, and how attenuation varies between different muscles of the trunk.
In conclusion, the results of this study support the hypotheses that trunk muscle attenuation is lower in older adults than in younger adults, lower in women than in men, and variable between trunk muscles and that age-related differences in muscle attenuation vary between specific muscles. Although increased age has a negative effect on muscle attenuation for all muscles, the effect is larger in the paraspinal and abdominal muscles. Future studies are needed to examine how muscle attenuation and fat content varies longitudinally with age, to determine how trunk muscle attenuation is associated with muscle function (ie, strength and endurance), and to examine effects on postural stability, spinal loading, and risk of vertebral fractures.
Funding
This work was supported by the National Institutes of Health (NIH) through National Institute of Arthritis and Musculoskeletal and Skin Diseases (NIAMS) grant R01-AR053986; NIAMS and National Institute on Aging (NIA) grant R01-AR/AG041398; and NIA grant T32-AG023480 and by the National Heart, Lung, and Blood Institute (NHLBI) Framingham Heart Study (NIH/NHLBI Contract N01-HC-25195).
References
- 1. Doherty TJ. Invited review: aging and sarcopenia. J Appl Physiol. 2003;95(4):1717–1727 doi:10.1152/japplphysiol.00347.2003 [DOI] [PubMed] [Google Scholar]
- 2. Delmonico MJ, Harris TB, Visser M, et al. Longitudinal study of muscle strength, quality, and adipose tissue infiltration. Am J Clin Nutr. 2009;90(6):1579–1585 doi:10.3945/ajcn.2009.28047 [DOI] [PMC free article] [PubMed] [Google Scholar]
- 3. Goodpaster BH, Carlson CL, Visser M, et al. Attenuation of skeletal muscle and strength in the elderly: the Health ABC Study. J Appl Physiol. 2001;90(6):2157–2165 [DOI] [PubMed] [Google Scholar]
- 4. Goodpaster BH, Park SW, Harris TB, et al. The loss of skeletal muscle strength, mass, and quality in older adults: the health, aging and body composition study. J Gerontol A Biol Sci Med Sci. 2006;61(10):1059–1064 doi:10.1093/gerona/61.10.1059 [DOI] [PubMed] [Google Scholar]
- 5. Forsberg AM, Nilsson E, Werneman J, Bergstrom J, Hultman E. Muscle composition in relation to age and sex. Clin Sci (Lond). 1991;81(2):249–256 [DOI] [PubMed] [Google Scholar]
- 6. Goodpaster BH, Kelley DE, Thaete FL, He J, Ross R. Skeletal muscle attenuation determined by computed tomography is associated with skeletal muscle lipid content. J Appl Physiol. 2000;89(1):104–110 [DOI] [PubMed] [Google Scholar]
- 7. Visser M, Kritchevsky SB, Goodpaster BH, et al. Leg muscle mass and composition in relation to lower extremity performance in men and women aged 70 to 79: the health, aging and body composition study. J Am Geriatr Soc. 2002;50(5):897–904 doi:10.1046/j.1532-5415.2002.50217.x [DOI] [PubMed] [Google Scholar]
- 8. Lang TF, Cauley J, Tylavsky F, Bauer D, Cummings S, Harris T. Computed tomography measurements of thigh muscle cross-sectional area and attenuation coefficient predict hip fracture: the health, aging and body composition study. J Bone Miner Res. 2010;25(3):513–519 doi:10.1359/jbmr.090807 [DOI] [PMC free article] [PubMed] [Google Scholar]
- 9. Schafer AL, Vittinghoff E, Lang TF, et al. Fat infiltration of muscle, diabetes, and clinical fracture risk in older adults. J Clin Endocrinol Metab. 2010;95(11):E368–E–372 doi:10.1210/jc.2010-0780 [DOI] [PMC free article] [PubMed] [Google Scholar]
- 10. Hicks GE, Simonsick EM, Harris TB, et al. Cross-sectional associations between trunk muscle composition, back pain, and physical function in the health, aging and body composition study. J Gerontol A Biol Sci Med Sci. 2005;60(7):882–887 doi:10.1093/gerona/60.7.882 [DOI] [PubMed] [Google Scholar]
- 11. Katzman W, Cawthon P, Hicks GE, et al. Association of spinal muscle composition and prevalence of hyperkyphosis in healthy community-dwelling older men and women. J Gerontol A Biol Sci Med Sci. 2012;67(2):191–195 doi:10.1093/gerona/glr160 [DOI] [PMC free article] [PubMed] [Google Scholar]
- 12. Hicks GE, Simonsick EM, Harris TB, et al. Trunk muscle composition as a predictor of reduced functional capacity in the health, aging and body composition study: the moderating role of back pain. J Gerontol A Biol Sci Med Sci. 2005;60(11):1420–1424 doi:10.1093/gerona/60.11.1420 [DOI] [PubMed] [Google Scholar]
- 13. Goodpaster BH, Kelley DE, Wing RR, Meier A, Thaete FL. Effects of weight loss on regional fat distribution and insulin sensitivity in obesity. Diabetes. 1999;48(4):839–847 doi:10.2337/diabetes.48.4.839 [DOI] [PubMed] [Google Scholar]
- 14. Sipila S, Suominen H. Effects of strength and endurance training on thigh and leg muscle mass and composition in elderly women. J Appl Physiol. 1995;78(1):334–340 [DOI] [PubMed] [Google Scholar]
- 15. Hoffmann U, Massaro JM, Fox CS, Manders E, O’Donnell CJ. Defining normal distributions of coronary artery calcium in women and men (from the Framingham Heart Study). Am J Cardiol. 2008;102(9):1136–1141 doi:10.1016/j.amjcard.2008.06.038 [DOI] [PMC free article] [PubMed] [Google Scholar]
- 16. Robb RA. The biomedical imaging resource at Mayo Clinic. IEEE Trans Med Imaging. 2001;20(9):854–867 doi:10.1109/42.952724 [DOI] [PubMed] [Google Scholar]
- 17. Young DR, Sharp DS, Petrovitch H, Curb JD. Internal validity of the physical activity index over 26 years in middle-aged and older men. J Am Geriatr Soc. 1995;43(9):999–1006 [DOI] [PubMed] [Google Scholar]
- 18. Grimm EK, Swartz AM, Hart T, Miller NE, Strath SJ. Comparison of the IPAQ-Short Form and accelerometry predictions of physical activity in older adults. J Aging Phys Act. 2012;20(1):64–79 [DOI] [PubMed] [Google Scholar]
- 19. Simoneau JA, Colberg SR, Thaete FL, Kelley DE. Skeletal muscle glycolytic and oxidative enzyme capacities are determinants of insulin sensitivity and muscle composition in obese women. FASEB J. 1995;9(2):273–278 [PubMed] [Google Scholar]
- 20. Crisco JJ, III, Panjabi MM. The intersegmental and multisegmental muscles of the lumbar spine. A biomechanical model comparing lateral stabilizing potential. Spine (Phila Pa 1976). 1991;16(7):793–799 [DOI] [PubMed] [Google Scholar]
- 21. Panjabi MM. The stabilizing system of the spine. Part I. Function, dysfunction, adaptation, and enhancement. J Spinal Disord. 1992;5(4):383–389; discussion 397 [DOI] [PubMed] [Google Scholar]