

Abstract
Isolating high-priority segments of genomes greatly enhances the efficiency of next-generation sequencing (NGS) by allowing researchers to focus on their regions of interest. For the 2010–11 DNA Sequencing Research Group (DSRG) study, we compared outcomes from two leading companies, Agilent Technologies (Santa Clara, CA, USA) and Roche NimbleGen (Madison, WI, USA), which offer custom-targeted genomic enrichment methods. Both companies were provided with the same genomic sample and challenged to capture identical genomic locations for DNA NGS. The target region totaled 3.5 Mb and included 31 individual genes and a 2-Mb contiguous interval. Each company was asked to design its best assay, perform the capture in replicates, and return the captured material to the DSRG-participating laboratories. Sequencing was performed in two different laboratories on Genome Analyzer IIx systems (Illumina, San Diego, CA, USA). Sequencing data were analyzed for sensitivity, specificity, and coverage of the desired regions. The success of the enrichment was highly dependent on the design of the capture probes. Overall, coverage variability was higher for the Agilent samples. As variant discovery is the ultimate goal for a typical targeted sequencing project, we compared samples for their ability to sequence single-nucleotide polymorphisms (SNPs) as a test of the ability to capture both chromosomes from the sample. In the targeted regions, we detected 2546 SNPs with the NimbleGen samples and 2071 with Agilent's. When limited to the regions that both companies included as baits, the number of SNPs was ∼1000 for each, with Agilent and NimbleGen finding a small number of unique SNPs not found by the other.
Keywords: Agilent, NimbleGen, Illumina, targeted capture
INTRODUCTION
In recent years, we have witnessed tremendous advances in next-generation sequencing (NGS) that have dramatically driven down the cost of large-scale DNA sequencing. Nonetheless, the cost of completely sequencing large genomes is still significant.1 Depending on the goal of study, for example, the assessment of genome-wide association studies, whole genome sequencing creates a large amount of additional data that can complicate data processing and analysis. To alleviate these problems, the targeted sequencing of the key portions of genomes is often being used to identify variations implicated in disease. Whereas many studies are designed to identify genetic variation of protein-coding genes in a genome-wide manner (whole exome sequencing), there are also applications where a focus on specific genomic intervals or gene sets is required. For example, in the past year alone, there have been studies identifying variants linked to Meckel syndrome2 and Fanconi's Anemia.3 In clinical settings, where NGS is used to examine specific gene panels, and sample numbers are high, it is more cost-effective and time-efficient to target, capture, and sequence only the genomic regions of interest. To address this need, several companies have developed targeted enrichment methods.
The two most commonly used custom-capture approaches are based on hybridization (either on array or in-solution) or on highly multiplexed PCR. In the array-based hybridization method, high-density microarrays containing probes complementary to the regions of interest are used to bind and purify DNA molecules of interest. In the solution-based method, biotinylated DNA or RNA complementary probes are used to bind to targets, which are then purified using streptavidin-labeled magnetic beads. The in-solution approach has several advantages over the array-based methods; particularly, as it is a highly scalable technique that does not require additional equipment associated with processing microarrays.
For this study, we compared two commercially available in-solution technologies (Agilent SureSelect Target Enrichment System and NimbleGen SeqCap EZ choice) and an array-based capture method (NimbleGen). In all three cases, the same set of genomic regions, totaling ∼3.5 Mb, was targeted using the same genomic sample, in duplicate. The captured material was sequenced on the Illumina Genome Analyzer IIx system in two separate DNA Sequencing Research Group (DSRG) laboratories.
Data resulting from each method were analyzed using a variety of parameters relevant to sequence capture, including: (1) design coverage, the percentage of the targeted bases covered by probes; (2) sensitivity, the percentage of targeted bases covered by sequence reads; (3) specificity, the number of reads that map to the targeted sequence; (4) uniformity, the overall variation in per-base coverage over the targeted region; and (5) reproducibility, the variation between replicates.4 We also compared the number of single-nucleotide polymorphisms (SNPs) found in each sample and looked at the performance of each platform in the individual regions specifically targeted by each company's design.
MATERIALS AND METHODS
Overview
Each company was given a list of desired targeted regions (Table 1) and asked to order the same human DNA sample from the Coriell Institute for Medical Research (Camden, NJ, USA). Companies were challenged to design and perform the best capture for the list of targeted regions. The companies designed their own bait oligonucleotides, performed their own enrichments in duplicate, and prepared Illumina sequencing libraries. Probe summaries and Illumina libraries were delivered to DSRG-participating laboratories and sequenced on Illumina Genome Analyzer IIx systems. The target designs and resulting sequence data were analyzed at Tufts University Core Facility (Boston, MA, USA).
Table 1.
GRCh37/hg19 Regions Chosen for 3.5-Mb Targeted Capture
| Gene name | Ensembl release 55 gene ID | Chromosome | Size of region (bp) | Strand | GC content |
|---|---|---|---|---|---|
| APH1A | ENSG00000117362 | 1 | 3833 | − | 54% |
| BIRC6 | ENSG00000115760 | 2 | 261,967 | + | 38% |
| HOXD11 | ENSG00000128713 | 2 | 2498 | + | 62% |
| RARB | ENSG00000077092 | 3 | 423,700 | + | 40% |
| HAND2 | ENSG00000164107 | 4 | 3826 | − | 56% |
| NPR3 | ENSG00000113389 | 5 | 77,839 | + | 41% |
| KIF3A | ENSG00000131437 | 5 | 45,042 | − | 37% |
| TCOF1 | ENSG00000070814 | 5 | 42,768 | + | 52% |
| TBX18 | ENSG00000112837 | 6 | 30,159 | − | 37% |
| DLL1 | ENSG00000198719 | 6 | 8499 | − | 58% |
| LFNG | ENSG00000106003 | 7 | 16,745 | + | 63% |
| HOXA1 | ENSG00000105991 | 7 | 3109 | − | 47% |
| HOXA2 | ENSG00000105996 | 7 | 2520 | − | 49% |
| SFRP1 | ENSG00000104332 | 8 | 47,609 | − | 49% |
| GDF6 | ENSG00000156466 | 8 | 18,560 | − | 52% |
| NOTCH1 | ENSG00000148400 | 9 | 51,441 | − | 63% |
| DKK1 | ENSG00000107984 | 10 | 3475 | + | 45% |
| SFRP5 | ENSG00000120057 | 10 | 5458 | − | 58% |
| N/A | N/A—2 Mb Contiguous targeted region, chromosome 11 | 11 | 2,000,000 | 39% | |
| ZBTB16 | ENSG00000109906 | 11 | 191,180 | + | 47% |
| GDF3 | ENSG00000184344 | 12 | 6107 | − | 46% |
| PSEN1 | ENSG00000080815 | 14 | 87,355 | + | 43% |
| APH1B | ENSG00000138613 | 15 | 31,675 | + | 40% |
| MESP2 | ENSG00000188095 | 15 | 2486 | + | 60% |
| AXIN1 | ENSG00000103126 | 16 | 65,124 | − | 54% |
| TBX6 | ENSG00000149922 | 16 | 6223 | − | 58% |
| HES7 | ENSG00000179111 | 17 | 3203 | − | 64% |
| RARA | ENSG00000131759 | 17 | 48,549 | + | 57% |
| HOXB1 | ENSG00000120094 | 17 | 1565 | − | 61% |
| HOXB2 | ENSG00000173917 | 17 | 2472 | − | 56% |
| DLL3 | ENSG00000090932 | 19 | 9661 | + | 57% |
| BMP2 | ENSG00000125845 | 20 | 12,265 | + | 43% |
| Total size of targets | 3,516,913 |
For each region, the gene name, Ensembl ID, chromosome, size, and percent guanine-cytosine (GC) content is given. An additional 2-Mb portion of chromosome 11 was also added to the capture.
Sample Source
Each company obtained starting DNA material from the Human Reference Genetic Material Repository of the Coriell Institute for Medical Research (Catalog ID: NS12911). The sample originated from a 62-year-old Caucasian male. Each company performed its enrichments in duplicate.
Target Selection
Thirty-one individual genes were selected, which varied in chromosome location, locus size (1565–423,700 bp), GC content, and alternative transcript number. Capture was requested for the entire gene locus, including exons, introns, and untranslated regions. The gene-set capture regions totaled ∼1.5 Mb. A contiguous 2-Mb region of chromosome 11, containing at least 11 genes, was also selected (Table 1).
Target Design
Genomic locations (hg19 coordinates) for the target regions, totaling ∼3.5 Mb, were provided to both Agilent Technologies and Roche NimbleGen. Each company was asked to design its best probe sets and to capture the designated regions. The genome coverage of designed probe sequences was provided to the DSRG by each vendor in BED format (http://genome.ucsc.edu/FAQ/FAQformat.html#format1).
Brief Description of Enrichment Systems
Agilent SureSelect target enrichment system
At Agilent Technologies, an RNA probe set, complementary to the target regions, was designed using the online tool, eArray (http://genomics.agilent.com/CollectionSubpage.aspx?PageType=Product&SubPageType=ProductDetail&PageID=1455). The in-solution target enrichment was performed according to Agilent's standard protocol for Illumina library preparation. Enrichment was carried out in duplicate. Briefly, sheared DNA was hybridized with RNA probes, and captured fragments were separated using streptavidin-coated magnetic beads and buffers. The selected regions were then PCR-amplified using Illumina PCR primers. Illumina libraries were quantified using the Agilent 2100 Bioanalyzer (Agilent Technologies), and the final products were returned to the DSRG for sequencing.
NimbleGen SeqCap EZ choice system
At NimbleGen, a DNA probe set complementary to the target regions was designed using its proprietary tool. The in-solution target enrichment was performed according to the NimbleGen standard protocol for Illumina library preparation. As with the Agilent samples, enrichment was carried out in duplicate to assess reproducibility of the method. Following PCR, Illumina libraries were quantified using the Agilent 2100 Bioanalyzer and were returned to the DSRG for sequencing.
NimbleGen array capture method
At NimbleGen, target enrichment was also performed using NimbleGen's array-based capture technology. The NimbleGen array method used the same probe design as the NimbleGen in-solution samples. As with the previous two samples, enrichment was carried out twice, libraries were quantified with the Agilent 2100 Bioanalyzer, and the final products were returned to the DSRGfor sequencing.
Sequencing on the Illumina Genome Analyzer IIx
Once samples were received by the DSRG's participating laboratories, sequencing was performed at two different core facilities: Stowers Institute (Kansas City, MO, USA) and the University of Michigan (Ann Arbor, MI, USA). Paired-end cluster generation was performed according to standard protocols from Illumina, using v.4 kits and cBOT instruments. Duplicate libraries of each of the three enrichment methods were all sequenced separately on single lanes on the same paired-end flow cell. Paired-end, 40-bp sequencing was performed on Illumina Genome Analyzer IIx instruments using v.4 kits. Each sample was given its own dedicated lane, totaling six lanes at each sequencing site.
Data Analysis
Sequence data were filtered using the FASTX toolkit (http://hannonlab.cshl.edu/fastx_toolkit/) so that all of the reads had a minimum quality score of 10 at every position. Quality filtering of data reduces the number of error-prone reads, improving alignment results and throughput. The sets were then normalized to account for variability in read counts from Illumina sequencing by randomly sampling so that each sample had the same number of starting reads. Filtered and normalized reads were aligned to the GRCh37/hg19 human genome build assembly using Bowtie, an ultrafast, memory-efficient, short read aligner.5 Alignments were generated in SAM format.6 Reads that mapped equally well to multiple sites in the genome, or “ambiguous” reads, were not analyzed. The percentage of reads mapping to the genome, number of ambiguous reads, number of PCR duplicates (mapped reads with the same 5′ and 3′ coordinates), number of reads mapping to the targeted region, and average computed DNA template sizes was recorded for every sample.
Aligned reads were converted into a coverage map, with every position annotated with a base-coverage level. Coverage maps were created for the 3.5-Mb overall targeted region as well as the intersection of areas covered by the designs of both platforms. As there was a large variability between vendors in the areas covered by the targeted design, we analyzed the intersection of the probe designs for each experiment. Coverage maps were analyzed for sensitivity (number of targeted bases covered), specificity (number of on-target reads), uniformity, and variability using The R Project for Statistical Computing environment (www.r-project.org). Figures were generated using the “ggplot2” library (http://had.co.nz/ggplot2/), and sequence alignments were viewed using GenomeView software (http://genomeview.org).
High-quality (depth≥5; Q-score≥20) SNP reports for every sample were generated using SAMtools and vcfutils (http://samtools.sourceforge.net). At least two reads with alternate bases from the reference were required for a SNP to be called at any position. SNPs were compared with the human SNP database (dbSNP) build 132.7 The concordance between samples as well as the number of on-target and off-target SNPs for each sample were determined.
RESULTS AND DISCUSSION
Bait Design
Targeted capture consists of designing a set of ssRNA or ssDNA “bait” oligonucleotides that hybridize to DNA from desired regions. For various reasons, neither company in this study designed a series of probes that covered the entire targeted region. For example, the default settings used for Agilent's eArray software avoid regions marked as repetitive by RepeatMasker (www.repeatmasker.org). NimbleGen created its design in-house using a proprietary tool. Additionally, companies were permitted to select their own optimal probe densities for any hard-to-capture regions. While we allowed the vendors to create their own designs, it should be noted that customers can choose to be more involved in the design process. For example, Agilent's eArray software can use a variety of options, such that the customer is not limited to the default settings or RepeatMasker.
Differences between designs were readily apparent when comparing the summaries of the bait regions that were provided by each company (see, e.g., Fig. 6). The Agilent probe set design covered <47% (1.63 Mb) of the 3.5-Mb targeted region, whereas the design for the NimbleGen samples covered 80% (2.8 Mb; Table 2). The Agilent probe coverage was distributed across 2759 loci and included 911 coverage gaps (1.44 Mb) of 500 bp or larger. The NimbleGen probe design included 3244 loci and only 219 coverage gaps (280 Kb) of ≥500 bp. The total region in common between the two designs was 1,631,273 bases, of which 99.7% of the bases targeted by Agilent were also included in the NimbleGen design.
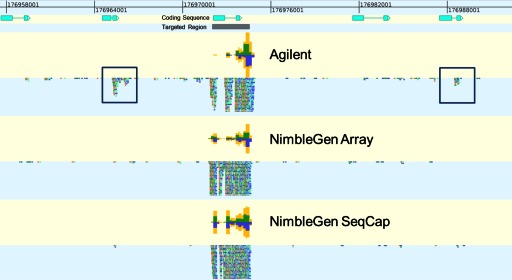
FIGURE 6.

Alignment of reads from each platform near targets bone morphogenetic protein 2 (BMP2), growth differentiation factor 6 (GDF6), and T-box 18 (TBX18). These alignments show GC content of the genomic region, coding sequence, targeted regions, and bait regions for each platform for a given replicate. Percent GC content for the DNA sequence is represented by an orange histogram at the top of the alignment view, ranging from 0 to 100% on the y-axis. The blue track represents the coding sequence for a gene. The gray track represents the targeted region. Red tracks show Agilent-baited regions, and green tracks show the NimbleGen-baited regions. Coverage plots are included for all three targets for each technology, and aligned reads themselves are included for BMP2 and GDF6. Coverage plots are represented by histograms showing the relative per-base coverage for that region on the y-axis. Yellow bars represent the sum of the “+” and “−“ strand coverage; green bars represent the + coverage; and blue bars represent the − strand coverage. For the BMP2 and GDF6 plots, reads aligning to the + strand are in green, and reads aligning to the − strand are in blue. A high GC region is boxed in red, and its effect on the Agilent bait design is circled in blue.
Table 2.
Sensitivity and Target Size
| Vendor | Designed bait region size | Percent of 3.5-Mb targeted region | % Reads mapping to baits | % Bait region covered >1× | % Bait region covered >10× |
|---|---|---|---|---|---|
| Agilent | 1,635,961 | 46.5% | 69.9% | 99.7% | 98.0% |
| NimbleGen microarray | 2,827,999 | 80.4% | 81.4% | 99.9% | 99.7% |
| NimbleGen SeqCap | 2,827,999 | 80.4% | 82.7% | 99.9% | 99.6% |
Each vendor generated a bait design with the goal of capturing the majority of the 3.5-Mb targeted region. Agilent's bait design covered only 1.6 Mb, whereas NimbleGen's covered 2.8 Mb. Each platform had high mapping and coverage rates to their bait regions.
Alignment Rates
All of the 12 sequencing experiments (three enrichments in duplicate, sequenced at each of two sites) generated a minimum of 23,928,746 sequencing reads. For consistency across the analyses, a random subset of 23,928,746 reads was selected. Each sample had a high rate of alignment to the GRCh37/hg19 genome (Table 3). Samples prepared with Agilent's method had a slightly higher alignment rate (95.6%) than NimbleGen array (94.1%) and in-solution (92.8%) methods, largely as a result of having fewer ambiguously mapped reads (2.4%, 4.1%, and 5.0%, respectively). The alignment failure rate was <2.5% for all samples (Fig. 1)
Table 3.
Sequencing and Alignment Statistics
| Product | Center | Normalized read counts | Average insert | Insert sd | Aligned | Failed to align | Suppressed (ambiguous) | Remainder | Potential PCR duplicate | PCR duplicate-free count | Total reduction |
|---|---|---|---|---|---|---|---|---|---|---|---|
| Agilent SureSelect rep 1 | Stowers | 23,928,746 | 205.9 | 62.2 | 95.71% | 2.13% | 2.16% | 22,902,203 | 16.65% | 19,088,986 | 20.23% |
| Agilent SureSelect rep 2 | Stowers | 23,928,746 | 216.2 | 58.2 | 95.53% | 1.85% | 2.63% | 22,859,132 | 13.67% | 19,734,289 | 17.53% |
| Agilent SureSelect rep 1 | Michigan | 23,928,746 | 207.9 | 63.3 | 95.47% | 2.26% | 2.26% | 22,844,780 | 15.87% | 19,219,313 | 19.68% |
| Agilent SureSelect rep 2 | Michigan | 23,928,746 | 217.3 | 58.1 | 95.79% | 1.79% | 2.42% | 22,921,352 | 14.30% | 19,643,599 | 17.91% |
| NimbleGen array rep 1 | Stowers | 23,928,746 | 158.3 | 23.3 | 94.00% | 1.76% | 4.23% | 22,493,023 | 33.79% | 14,892,631 | 37.76% |
| NimbleGen array rep 2 | Stowers | 23,928,746 | 158.3 | 23.3 | 94.05% | 1.73% | 4.23% | 22,504,988 | 31.46% | 15,424,919 | 35.54% |
| NimbleGen array rep 1 | Michigan | 23,928,746 | 158.8 | 23.2 | 94.26% | 1.73% | 4.01% | 22,555,244 | 34.77% | 14,712,785 | 38.51% |
| NimbleGen array rep 2 | Michigan | 23,928,746 | 158.7 | 23.2 | 94.26% | 1.70% | 4.04% | 22,555,244 | 32.16% | 15,301,478 | 36.05% |
| NimbleGen solution rep 1 | Stowers | 23,928,746 | 94.5 | 20.3 | 92.96% | 2.12% | 4.92% | 22,244,166 | 29.28% | 15,731,074 | 34.26% |
| NimbleGen solution rep 2 | Stowers | 23,928,746 | 94.1 | 20.3 | 92.80% | 2.14% | 5.07% | 22,205,881 | 28.92% | 15,783,940 | 34.04% |
| NimbleGen solution rep 1 | Michigan | 23,928,746 | 94.3 | 20.3 | 92.53% | 2.42% | 5.05% | 22,141,278 | 28.49% | 15,833,228 | 33.83% |
| NimbleGen solution rep 2 | Michigan | 23,928,746 | 94.5 | 20.3 | 92.77% | 2.21% | 5.03% | 22,198,708 | 28.61% | 15,847,658 | 33.77% |
For each replicate, various statistics from the alignment were recorded. These included the average DNA template size, the percent alignment, the number of reads suppressed for ambiguity, percent PCR duplicates, and final aligned read counts. Stowers, Stowers Institute for Medical Research; Michigan, University of Michigan.
FIGURE 1.

Alignment results after normalization. These histograms show the percentage of reads that are ambiguous or failed to align to the genome or were PCR duplicates. Ambiguous: reads that aligned to multiple places in the genome. Failed to Align: reads that did not have a valid alignment to any location in the genome. PCR Duplicate: reads that had the same genomic 5′ and 3′ coordinates. There are four bars showing the performance of each replicate for each platform in each category. Each bar is labeled by the sequencing site (S: Stowers Institute for Medical Research; M: University of Michigan) and replicate (1 or 2).
Samples prepared by Agilent had one-half of the number of estimated PCR duplicates (15.1%) or read pairs, where the 5′ and 3′ positions are the same as another pair, than those prepared using both NimbleGen technologies (33.0% for array; 28.8% for in-solution). A small level of variation (∼2%) was observed between duplicates for the Agilent and NimbleGen array enrichments. PCR duplicates are typically noticed in NGS data sets when the depth of sequencing is higher than the complexity of the starting sample; i.e., the number of unique DNA fragments is less than the number of clusters on a flow cell. This often occurs when the amount of starting DNA material is very low, and excess cycles of PCR are used during amplification. Overall, removal of PCR duplicates decreased the mean coverage rate for each platform for the 3.5-Mb region and bait regions in common (Table 4). Variability did not decrease for the entire target region with the removal of PCR duplicates, although variability did decrease for the bait regions in common.
Table 4.
Mean Coverage and sd
| Statistic | 3.5-Mb Targeted region |
Bait regions in common |
||
|---|---|---|---|---|
| All reads | PCR duplicates removed | All reads | PCR duplicates removed | |
| Mean coverage | ||||
| Agilent | 397 | 331 | 745 | 619 |
| NimbleGen array | 439 | 286 | 536 | 348 |
| NimbleGen in-solution | 438 | 297 | 521 | 360 |
| sd | ||||
| Agilent | 365 | 375 | 442 | 354 |
| NimbleGen array | 172 | 174 | 253 | 147 |
| NimbleGen in-solution | 218 | 219 | 351 | 187 |
Statistics for the mean coverage and sd of coverage for each platform are provided for both sets that included PCR duplicates and those without against the entire 3.5-Mb targeted capture and only the bait regions in common.
The insert size distribution or length of sequenced DNA fragments was larger and broader for the Agilent samples (Fig. 2). The insert size was chosen by each vendor during library preparation at the size-selection step, and it should be noted that customers preparing their own libraries can vary the insert size to a desired length. A larger insert is advantageous, as it can help to bridge repetitive regions in the genome (and can thus partially compensate for a more stringent probe selection), and low variability will help a reference assembler pick the best location for each read in a pair. A low SD in insert size will also improve sequence quality, as Illumina's cluster identification and base-calling software expects a fairly uniform cluster size (Illumina). The NimbleGen samples, particularly the SeqCap in-solution samples, had a dramatically reduced template length. Whereas not performed on this run, single-end sequencing of 80–100 bp would likely have produced the same alignment results as a paired read for the NimbleGen SeqCap samples.
FIGURE 2.

Library insert size distribution for each platform. Agilent's mean insert size was ∼200 bp, whereas the mean was ∼150 bp for the NimbleGen array samples and ∼100 bp for the NimbleGen SeqCap samples. For each sample, the upper and lower portions of the boxes represent the 25th and 75th percentiles, respectively; the line in the middle of each box represents the 50th percentile. The whiskers extend to 1.5× the interquartile range. Outliers are plotted as points.
Targeted Capture Sensitivity and Specificity
After removal of PCR duplicates, the total number of reads mapping to the 3.5-Mb targeted regions was higher for the Agilent samples (Fig. 3, left). As the number of removed PCR duplicates for the NimbleGen samples was double that of Agilent, this result was expected (Table 3). The proportion of reads within each library that mapped to the targeted region was higher for NimbleGen (Fig. 3, right). None of the methods achieved 100% coverage, likely as a result of a mixture of ambiguously mapped reads and target design.
FIGURE 3.

Specificity: read counts and percentage mapping to 3.5-Mb targeted region for each platform. This histogram shows the number of reads on target for each platform and for each replicate after the removal of ambiguously mapped reads and PCR duplicates. The proportion of reads shows the number of reads mapping compared with the total number of reads in each set. More PCR duplicate and ambiguous reads were discarded from the NimbleGen alignments, resulting in a lower number of overall reads but with a higher per-sample percentage on target. Each bar is labeled by the sequencing site.
Each platform performed well in covering the baited regions in common (Fig. 4, upper row). Both NimbleGen platforms had superior performance up to ∼180× although the difference was minimal. The drop in the proportion of high-coverage areas by NimbleGen after this point can largely be attributed to the larger NimbleGen design, as the bait region analysis only includes regions that both platforms had in common. Removal of PCR duplicates also reduced the coverage level of all platforms, although much more so for NimbleGen than Agilent (Fig. 4, compare left and right columns). Performance by each platform was lower for the entire 3.5-Mb targeted region, although NimbleGen's performance was superior as a result of its larger bait design (Fig. 4, lower row). Interestingly, the Agilent platform covered nearly 77% of the target at 1×, despite only a bait design that covered 46.5% of the target (Fig. 4, lower left). However, this value quickly dropped to 58% at 100× coverage. Both NimbleGen platforms covered the entire targeted region at nearly 80% at 100× coverage.
FIGURE 4.

Sensitivity: percent coverage of 3.5-Mb targeted region and bait region for each platform. This chart shows how well the targeted region is covered for read depths from 1× to 500×. PCR duplicates were removed for the plots on the left column and retained for the plots on the right right column. The upper row shows coverage for only the baited regions in common between the two platforms, and the lower row shows coverage for the entire 3.5-Mb targeted region.
We then looked at the performance of each platform in areas within 300 bp of its probe set region (Fig. 5). The NimbleGen methods improved slightly from 0 to 100 bp with no further improvement after, whereas Agilent continued to improve up until about 200 bp, consistent with the average insert sizes for each platform described above (Table 3). Whereas the bait region was >98% covered for all three technologies up to 10× Agilent's sensitivity dropped faster than NimbleGen's as the coverage level increased, similar to the results seen for the entire 3.5-Mb region (Fig. 4, compare upper and lower rows).
FIGURE 5.

Reads mapping to regions near baited areas. This chart shows the percentage of reads mapping to regions from 0 to 300 bp away from the baited areas, inclusive of the baited areas themselves. The longer DNA insert size for the Agilent samples appears to be closely linked to the improvement in performance from 0 to 150 bp.
The Agilent samples also had a higher proportion of on-target reads (Fig. 3, right). Some off-target reads are expected, as a hypothetically perfect capture would not be able to identify any variations. The higher number of off-target reads could indicate an ability to find larger variations than SNPs or short insertions and deletions. Additionally, a visual inspection of the alignments revealed locations that did not sequence well. For all technologies, GC-rich segments tended to have lower coverage (Fig. 6). Agilent's samples also had a higher percentage of off-target reads, often in regions with similarity to a target, such as within the HOXB11 cluster (Fig. 7).
FIGURE 7.
Alignment of reads from each platform near target HOXB11. This alignment shows the coverage levels and individual reads for all three technologies at one of the targets in the capture. Off-target reads mapping to similar regions are boxed in blue.
Uniformity and Reproducibility
Uniform sequencing coverage ensures that reads are distributed evenly across a targeted region and greatly helps with variation detection. NGS has many biases, including issues on the Illumina system with sequencing GC-rich regions or preparing AT-rich libraries.8 Within the targeted regions, Agilent had a higher average coverage level than both NimbleGen methods. However, the sd in coverage for the Agilent samples was nearly twice that of the NimbleGen samples, for the targeted region and bait regions in common between both platforms (Table 4). The distribution of per-base coverage in the NimbleGen samples was near-normal, whereas the Agilent samples had nearly the same number of positions with 200× coverage as those with 800× coverage (Fig. 8, lower row). This pattern was observed for most of the targeted regions, although there were minor differences (Fig. 9). The high variation for the Agilent samples in the 3.5-Mb targeted region is a result of areas with low or zero coverage because of the bait design, although the result improves only marginally when limited to the bait regions in common (Fig. 8, compare upper row with lower). Interestingly, GC-rich segments were not well-represented in any sample. This may be attributed to sequencing bias, as well as difficulty in capture. Reproducibility was very high (>0.99) between each replicate (Table 5).
FIGURE 8.

Kernel density plot of entire 3.5-Mb capture and bait regions in common. This chart shows the kernel density function for the three platforms studied. Coverage values for each position of the 3.5-Mb targeted capture were pooled, and the frequency of values at each depth was used to calculate the density function. Plots were generated for the entire 3.5-Mb capture (lower row) and only the bait regions in common (upper row). The effect of the removal of PCR duplicates is shown (compare left column with right).
FIGURE 9.

Kernel density plots of coverage of three selected regions. This chart shows the kernel density function for the three platforms studied over three selected regions: BMP2, GDF6, and TBX18. The plots were generated from a set with PCR duplicates removed.
Table 5.
Pearson Correlation for Replicate Samples
| Set | Agilent 1 | Agilent 2 | NimbleGen array 1 | NimbleGen array 2 | NimbleGen SeqCap 1 | NimbleGen SeqCap 2 |
|---|---|---|---|---|---|---|
| Agilent 1 | 1 | |||||
| Agilent 2 | 0.9942 | 1 | ||||
| NimbleGen array 1 | 0.5427 | 0.5378 | 1 | |||
| NimbleGen array 2 | 0.5453 | 0.5407 | 0.9918 | 1 | ||
| NimbleGen SeqCap 1 | 0.1852 | 0.1833 | 0.5085 | 0.5126 | 1 | |
| NimbleGen SeqCap 2 | 0.1982 | 0.1976 | 0.5327 | 0.5362 | 0.9936 | 1 |
The Pearson correlation value is shown between each replicate.
SNP Detection
One of the major rationales for using targeted capture is to identify SNPs in many samples at a lower cost than using whole genome sequencing. For only a few genes of interest, many samples can be multiplexed into a single Illumina Genome Analyzer IIx, MiSeq, or HiSeq2000 lane.
We performed SNP detection with PCR duplicates removed, as they are generally discarded from sequencing datasets, because they inflate coverage levels and may introduce false SNPs. Found SNPs from all samples had ∼98% agreement with dbSNP. Within the bait region in common, 1016 SNPs were found in common among all three platforms (Fig. 10). Agilent found 36 SNPs not identified by either NimbleGen platform, although there were several unique SNPs also found by each NimbleGen platform.
FIGURE 10.

SNP counts and concordance by platform. These diagrams show the number of SNPs found for each technology, as well as those found in common in only the baited regions in common. The in-solution methods alone are also compared. SNP counts given were generated from a combined alignment of four sets from each company (two replicates at each sequencing site).
Each platform identified more than 2000 SNPs within the entire 3.5-Mb targeted region (Fig. 11). Interestingly, whereas the in-solution methods found nearly twice as many SNPs outside of the target region, the NimbleGen array-based method confined most of its SNPs to within the targeted region. This is consistent with the high-sensitivity and read-mapping rates for the NimbleGen array-based samples.
FIGURE 11.

SNPs found for each platform. This histogram shows the number of SNPs found for each platform in the entire 3.5-Mb targeted region, separated by those on-target and off-target. Reads from replicates for each platform were pooled prior to SNP detection. The variation by replicate is shown by bars at the top of each stacked histogram. The total number of SNPs found is boxed within each histogram. SNP counts given are the average over the four sets for each company (two replicates at each sequencing site).
CONCLUSION
Each platform worked well for its designed probe set. The results overall favored the NimbleGen array and in-solution samples, as Agilent's performance for the targeted region suffered greatly from a default design that covered less than one-half of the 3.5-Mb target and could have been improved significantly with modifications. Variability in the Agilent samples was higher than NimbleGen, although a higher proportion of off-target reads mapping to regions similar to the targets suggests that the Agilent platform may be able to capture larger variations than SNPs or short insertions and deletions. Researchers designing a targeted capture should be aware of the limitations of design to a targeted capture and work with their respective vendors to ensure an effective targeted capture experiment.
ACKNOWLEDGMENTS
We are grateful for the contributions of many individuals. This study could not have been possible without the support of Agilent Technologies, Roche NimbleGen, and Illumina. We thank Fred Ernani, Garick Peters, Katie Weaver, Ken Olinger, and Nick Mapara from Agilent; Dan Burgess, Lance Brown, Michael Frawley, and Xinmin Zhang from NimbleGen; and Jonathan Pinter from Illumina. We are especially thankful to Alexander Wong (Agilent Technologies) and Dan Burgess (Roche NimbleGen) for the probe design and capture. We are also indebted to Christine Brennan, Elizabeth Ketterer, Kendra Walton, Madelaine Gogol, Constance Esposito, and Karen Staehling for their support in the sequencing efforts.
DISCLOSURES
The authors declare no conflicts of interest.
REFERENCES
- 1. Metzker ML. Sequencing technologies—the next generation. Nat Rev Genet 2010;11:31–46 [DOI] [PubMed] [Google Scholar]
- 2. Hopp K, Heyer CM, Hommerding CJ, et al. B9D1 is revealed as a novel Meckel syndrome (MKS) gene by targeted exon enriched next-generation sequencing and deletion analysis. Hum Mol Genet 2011;20:2524–2534 [DOI] [PMC free article] [PubMed] [Google Scholar]
- 3. Tan IB, Cutcutache I, Zang ZJ, et al. Fanconi's anemia in adulthood: chemoradiation-induced bone marrow failure and a novel FANCA mutation identified by targeted deep sequencing. J Clin Oncol 2011;29:e591–e594 [DOI] [PubMed] [Google Scholar]
- 4. Mamanova L, Coffey AJ, Scott CE, et al. Target-enrichment strategies for next-generation sequencing. Nat Methods 2010;7:111–118 [DOI] [PubMed] [Google Scholar]
- 5. Langmead B, Trapnell C, Pop M, Salzberg SL. Ultrafast and memory-efficient alignment of short DNA sequences to the human genome. Genome Biol 2009;10:R25. [DOI] [PMC free article] [PubMed] [Google Scholar]
- 6. Li H, Handsaker B, Wysoker A, et al. The sequence alignment/map format and SAMtools. Bioinformatics 2009;25:2078–2079 [DOI] [PMC free article] [PubMed] [Google Scholar]
- 7. Smigielski EM, Sirotkin K, Ward M, Sherry ST. dbSNP: a database of single nucleotide polymorphisms. Nucleic Acids Res 2000;28:352–355 [DOI] [PMC free article] [PubMed] [Google Scholar]
- 8. Quail MA, Kozarewa I, Smith F, et al. A large genome center's improvements to the Illumina sequencing system. Nat Methods 2008;5:1005–1010 [DOI] [PMC free article] [PubMed] [Google Scholar]