Abstract
Background and Aims
Floral development depends on photosynthetic products delivered by the phloem. Previous work suggested the path to the flower involved either the apoplast or the symplast. The objective of the present work was to determine the path and its mechanism of operation.
Methods
Maize (Zea mays) plants were grown until pollination. For simplicity, florets were harvested before fertilization to ensure that all tissues were of maternal origin. Because sucrose from phloem is hydrolysed to glucose on its way to the floret, the tissues were imaged and analysed for glucose using an enzyme-based assay. Also, carboxyfluorescein diacetate was fed to the stems and similarly imaged and analysed.
Key Results
The images of live sections revealed that phloem contents were released to the pedicel apoplast below the nucellus of the florets. Glucose or carboxyfluorescein were detected and could be washed out. For carboxyfluorescein, the plasma membranes of the phloem parenchyma appeared to control the release. After release, the nucellus absorbed apoplast glucose selectively, rejecting carboxyfluorescein.
Conclusions
Despite the absence of an embryo, the apoplast below the nucellus was a depot for phloem contents, and the strictly symplast path is rejected. Because glucose and carboxyfluorescein were released non-selectively, the path to the floret resembled the one later when an embryo is present. The non-selective release indicates that turgor at phloem termini cannot balance the full osmotic potential of the phloem contents and would create a downward pressure gradient driving bulk flow toward the sink. Such a gradient was previously measured by Fisher and Cash-Clark in wheat. At the same time, selective absorption from the apoplast by the nucellar membranes would support full turgor in this tissue, isolating the embryo sac from the maternal plant. The isolation should continue later when an embryo develops.
Keywords: Apoplast, carboxyfluorescein, floret, glucose, membrane transport, phloem, reflection coefficient, sucrose, symplast, turgor pressure, Zea mays
INTRODUCTION
In order to develop, flowers require sugars delivered by the phloem. The delivery plays a crucial role because if it fails, development may cease (Saini and Westgate, 2000). Failure is especially prevalent during water limitations and diminishes the number or size of fruits which, in grain crops such as maize, decreases productivity (Saini and Westgate, 2000; Boyer and Westgate, 2004; Boyer and McLaughlin, 2007). The failure in maize involves mostly female florets because cross-pollination indicates the pollen is often viable when the female floret is not (Westgate and Boyer, 1986).
The female florets of maize are convenient experimental tools because they are anatomically simple. The pedicel at the base of each floret has a well-defined, cup-shaped phloem terminus resembling a golf tee holding a round nucellus (Fig. 1). At the time of pollination but before fertilization, the florets do not have an embryo and the tissues are entirely maternal, simplifying the genetics. Because of this simplicity, maize florets were used in the present work.
Fig. 1.

Fate of phloem sucrose in developing maize ovaries on the day of pollination but before an embryo exists. (A) Soluble acid invertase (dark stain) is detected in the nucellus (N) above the pedicel (P). Capable of hydrolysing sucrose, the soluble invertase is absent in the pedicel tissues below the nucellus. (B) By contrast, cell-wall acid invertase is detected in the pedicel tissues at the phloem termini below the nucellus. This invertase is outside of the vascular system (dark stain surrounds light vascular strands), and suggests sucrose is released to the cell walls (apoplast). Note that this cell-wall form is absent in the nucellus, and the vascular system does not enter the nucellus. (C) Glucose, one of the products of invertase activity, appears concentrated (red) at the phloem termini where cell-wall invertase is located. A declining glucose gradient extends upward into the nucellus from the concentrated region (red to green to blue). (D) Starch (dark area) is in the pedicel outside of the vascular system (light vascular strands run through the dark area). Starch is absent in the nucellus. Scale bars = 1 mm. Stigma and style have been removed from florets to allow increased resolution. Embryo sac is outside of this plane of section. (A) to (C) from McLaughlin and Boyer (2004a). (D) A.-C. Tang (unpublished data stained according to Zinselmeier et al., 1999).
Sucrose is the main sugar on which female florets depend in maize (Zinselmeier et al., 1995a). When water deficits or shade decrease photosynthetic activity in the plant, the sucrose pool diminishes in the ovary of the floret (Zinselmeier et al., 1999; Hiyane et al., 2010). Feeding sucrose solution to a well in the stems of the intact plants replenishes the sucrose pool in the ovaries and establishes that sucrose is translocated to these structures (Zinselmeier et al., 1999). Labelled sucrose fed to the stems labels the ovaries (Zinselmeier et al., 1999).
The sucrose is hydrolysed to glucose and fructose on its way to the ovaries (Miller and Chourey, 1992; Zinselmeier et al., 1995a, b, 1999; Cheng et al., 1996; McLaughlin and Boyer, 2004a). In water-deficient or shaded plants, ovary glucose can be depleted and leads to abortion. This irreversible cessation of development is largely prevented if sucrose is fed to the stems, maintaining glucose levels in the ovaries (McLaughlin and Boyer, 2004a). This reversal of phenotype, termed functional reversion (Boyer and McLaughlin, 2007), establishes a strict dependence of floral development on carbon delivery by sucrose.
Sucrose is the most abundant solute in the phloem of maize (Ohshima et al., 1990) and many other species (Hayashi and Chino, 1986, 1990; Fisher, 1987; Amiard et al., 2004). It is delivered from the leaves toward sink tissues by phloem sieve elements unloading to a post-sieve element symplasm (Fisher and Oparka, 1996; Patrick, 1997). The flow is driven by a downward pressure gradient and, after unloading to the symplasm, appears to be similarly driven through plasmodesmata of the post-phloem path to many sinks (Fisher and Oparka, 1996; Patrick, 1997). Although the origin of the downward pressure gradient is somewhat obscure (Patrick and Offler, 1995; Fisher and Cash-Clark, 2000), the symplasm appears to provide a direct hydraulic path from the sieve elements to these sinks (Oparka et al., 1994; Fisher and Oparka, 1996; Patrick, 1997).
Developing embryos likewise depend on the delivery of sucrose, but the symplasm path is interrupted by the apoplast at the boundary between the parental and filial tissues. In maize, there is no direct hydraulic connection between these tissues, and the embryo absorbs phloem contents selectively from the apoplast (Shannon, 1972; Shannon and Dougherty, 1972; Porter et al., 1985; Miller and Chourey, 1992; Patrick and Offler, 1995; Cheng et al., 1996). This allows a degree of independence consistent with the differing genomes of the parent and embryo.
In the floret before an embryo is present, an apoplast step also may occur. Acid invertase is abundant in maize florets but the soluble form is in the nucellus (Fig. 1A) while the cell wall-bound form is in the pedicel (Fig. 1B) (for a review, see Ruan et al., 2010). Sucrose may be delivered to the cell wall because the invertase product glucose accumulates in the pedicel tissues (Fig. 1C) and accounts for nearly all the sucrose arriving from the phloem (Mäkelä et al., 2005). The nucellus contains glucose but does not accumulate it (Fig. 1C). This suggests that phloem might deliver sucrose to the pedicel apoplast where it is hydrolysed.
On the other hand, the imaged glucose in Fig. 1C is for the whole tissue that includes both cytoplasm and cell-wall compartments. Starch is abundant in the same tissues that show glucose accumulation (Fig. 1C, D; see also Zinselmeier et al., 1999). The starch breaks down to release glucose when sucrose does not arrive (Zinselmeier et al., 1999; McLaughlin and Boyer, 2004b; Mäkelä et al., 2005). This raises the possibility that glucose might be coming from the starch. But an alternative possibility is that sucrose arrives in the symplast and the glucose is coming from sucrose hydrolysed in the symplast. Could the glucose in Fig. 1C be entirely in the symplast, implying that sucrose and thus glucose move through the symplasm without an apoplast step?
If no apoplast step is involved, there should be little if any glucose in the apoplast. A direct test of this hypothesis would be (1) to image glucose in live cells rather than the frozen-thawed tissue used in Fig. 1C. Because the assay is based on glucose oxidase, the enzyme should not cross the plasma membrane of the live cells and should remain in the apoplast. No glucose should be detected there. This could be further tested by (2) washing live pedicel/floral tissues and determining the glucose content of the wash water. After a brief rinse to remove surface glucose from cut cells, there should be essentially no further release because the remaining glucose would be sequestered behind cell membranes.
The objective of the present work was to use these tests to determine whether the symplast alone accounted for sugar flow to the developing female florets of maize, or whether the apoplast was also involved. The results of both tests showed glucose in the apoplast beneath the nucellus. When the selectivity for glucose was explored with the phloem-mobile dye carboxyfluorescein (CF), the CF also was in the apoplast. This indicated that the membranes releasing sucrose were relatively non-selective and likely to release whatever was in the phloem. However, membranes of the nucellus were highly selective because glucose but not CF was present in these cells. This suggests a mechanism for sugar delivery based on differences in membrane selectivity.
MATERIAL AND METHODS
Plant materials and growth conditions
Maize (Zea mays L. cv. DE2 × H99) plants were grown singly in 22-L pots containing 15·6 kg of oven dried soil mix (1 : 1 : 1 of soil/sand/peat, pH 6·9) in a growth chamber (Environmental Growth Chambers, Chagrin Falls, OH, USA). The chamber was set at a day/night temperature of 30/20 °C, relative humidity of 40/95 % and a photoperiod of 14 h of 800–1000 µmol m−2 s−1 photosynthetically active radiation at the top of the canopy. Planting density was approx. 6 plants m−2, equivalent to field density for this genotype. Nutrient solution was provided twice a week and consisted of 6 mol m−3 Ca(NO3)2.4H2O, 4 mol m−3 KNO3, 2 mol m−3 KH2PO4, 2 mol m−3 MgSO4.7H2O, 25 mmol m−3 H3BO3, 10 mmol m−3 MnSO4.H2O, 2 mmol m−3 ZnSO4.7H2O, 0·5 mmol m−3 CuSO4.5H2O, 0·5 mmol m−3 H2MoO4 and 50 mmol m−3 iron citrate. Additional KNO3 (8 mol m−3) was supplied during rapid stem elongation (21–50 d after planting). All nutrient additions were supplied until drainage at the bottom of the pot and were terminated at tasselling. Thereafter, water was supplied as needed.
Grown this way in previous studies (Boyle et al., 1991; Zinselmeier et al., 1995a, 1999), the plants yielded the equivalent of about 8000 kg ha−1 of grain at maturity. In this study, the plants were not grown to maturity and all measurements were on the 5th day after the stigmas and styles (silks) first emerged. Until that day, the developing ears were covered with bags to prevent pollination, and on the morning of the 5th day, the female florets were at their maximum receptivity, the bags were removed and the florets were hand-pollinated at dawn. Samples of ovaries were taken soon afterwards that day. Because the pollen reached the embryo sac the following day, no embryos were present on the day of sampling.
Analytical theory
To separate apoplast and symplast contents, a protocol was developed for viewing and washing ovary slices (Fig. 2). After briefly rinsing away the contents of cells cut during slicing, the protocol continued with live slices having intact cell membranes. Viewing them for glucose or CF detected apoplast contents, and washing them removed the contents. Afterward, symplast contents remained and were released by freezing the live slices in liquid N2 and thawing to destroy cell membranes. Viewing them for glucose or CF detected symplast contents, and washing them removed the symplast contents.
Fig. 2.
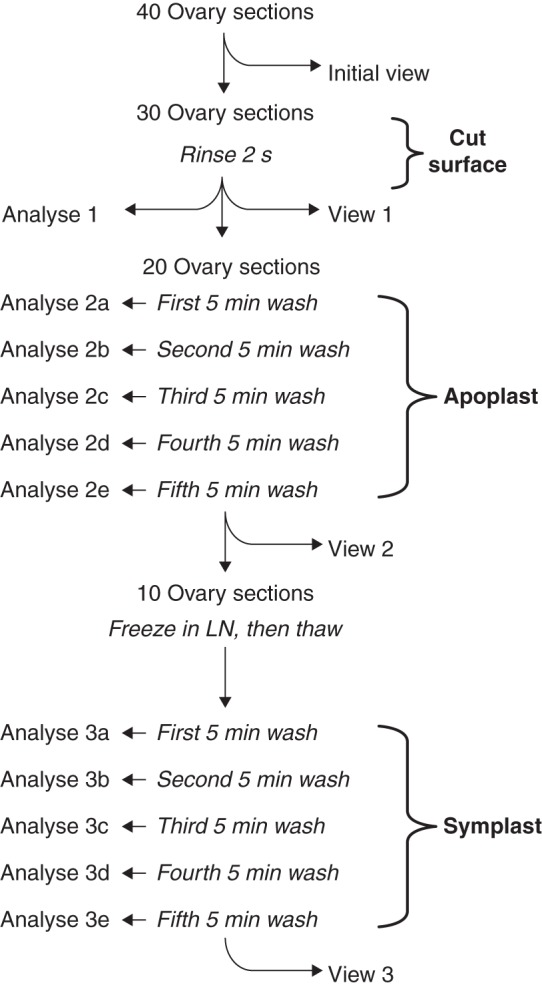
Protocol for locating glucose or CF in the apoplast and symplast of live sections of maize ovaries. The central column shows the rinse and wash-outs of the sections while the left side shows when the wash water was analysed (Analyze 1–3e), and the right side shows when sections were removed for imaging (Initial view and Views 1–3). The rinse removed surface glucose or CF (Cut surface), and the next five washes removed glucose or CF from the apoplast (Apoplast). After freezing in liquid nitrogen (LN) and thawing to break cell membranes, the final five washes removed glucose or CF from the symplast (Symplast). At the end of the protocol, glucose or CF was extracted from the last ten sections (View 3) for a final analysis. The protocol was identical for glucose or CF but used different plants.
Protocol details involved harvesting a young maize ear and removing 40 ovaries from the middle part. Each ovary was sliced by hand with a razor blade oriented perpendicular to the ear axis to give fresh sections 200–250 µm thick. The live sections were held at 4 °C and ten sections were imaged for glucose or CF initially (Fig. 2, Initial view). The remaining 30 sections were rinsed for 2 s in 10 mL of water to remove glucose or CF from the cut surface (Fig. 2, Rinse 2 s). The rinse water was analysed for removed glucose or CF (Fig. 2, Analyze 1) and ten rinsed sections were blotted dry for imaging (Fig. 2, View 1). The remaining 20 rinsed sections were washed with 10 mL of water for 5 min repeated five times to remove glucose or CF from the apoplast. The washes were performed on a stirring plate (Nuova II stir plate, Thermolyne, Dubuque, IA, USA) at 600–700 r.p.m. so that the sections were gently moved while being submerged under the water. The extracts were saved from each wash for analysis (Fig. 2, Analyze 2a–2e). Ten sections were removed to image glucose or CF remaining after washing from the apoplast (Fig. 2, View 2). The last ten washed sections were frozen with liquid N2 and thawed to break membrane integrity (Fig. 2, Freeze then thaw) so that glucose or CF would be released from the symplast. The 5-min washes were repeated five times, and the extracts were saved from each wash for analysis (Fig. 2, Analyze 3a–3e). These ten sections were removed to image glucose or CF remaining after washing from the symplast (Fig. 2, View 3). After viewing, the residual glucose or CF was extracted by grinding the frozen–thawed–washed sections. Homogenates were centrifuged at 10 000 g for 6 min (Sorvall RC-5C, DuPont Co, Wilmington, DE, USA), and glucose or CF was measured in the supernatant as described below.
Analysing sugars
Glucose washed from the ovary sections according to the protocol (Fig. 2) was analysed fluorometrically with AmplexTM Red reagent as described by McLaughlin and Boyer (2004a). Briefly, a 20-μL aliquot of the wash water was placed into 980 µL of Amplex Red assay solution in 1·5-mL Eppendorf tubes. The assay solution was composed of glucose oxidase at a final concentration of 1·8 units mL−1, horseradish peroxidase at a final concentration of 1·5 units mL−1 and Amplex Red Reagent at a final concentration of 200 µm in 50 mm phosphate buffer at pH 7·4. After 30 min at room temperature in the dark, the resulting resorufin was quantified with a Shimadzu RF-1501 spectrofluorophotometer (Shimadzu, Kyoto, Japan) with excitation at 563 nm and emission at 587 nm. The glucose content was determined from the resorufin produced from standard solutions of glucose (Sigma G-8270). Background fluorescence from a no-glucose control was low (around 0·01–0·03 OD units) and was subtracted from each assay determination. The assay was linear from 5 to 45 µm glucose. Glucose contents were expressed as μg per section. To check this assay, reducing sugars also were analysed colorimetrically in the same extracts according to Nelson (1944).
Imaging glucose
Sections for viewing microscopically were removed from the protocol at intervals shown in Fig. 2. All images were made on the same day to enable close comparisons. The live fresh sections were kept at 4 °C and imaged with a gel-based, enzyme-coupled fluorometric assay according to McLaughlin and Boyer (2004a). The AmplexTM Red reaction gel was prepared on a cover glass and stored at room temperature in the dark, then mounted on top of the fresh sections to initiate the reaction. The only glucose that could be detected was outside of the plasma membranes.
In a separate experiment, the sampled sections were immediately frozen in liquid N2, lyophilized and stored at –70 °C. They were moved to the microscope while frozen on a cold Al block (approx. –20 °C) in a covered Petri dish to prevent condensation, mounted on the reaction gel on the microscope, and allowed to warm to initiate the reaction. Although the glucose had been immobilized by the freezing and lyophilizing, the lack of intact membranes during warming allowed the glucose to diffuse out and contact the assay solution but not diffuse more than about 200 µm (McLaughlin and Boyer, 2004a), thus imaging total glucose in the section.
For both types of experiments, the fluorescent reaction product resorufin was imaged after 90 s at room temperature on an epifluorescence microscope (Olympus BX51, Tokyo, Japan) with a Cy3 filter (excitation at 545–575 nm and emission at 610–685 nm). All images were taken at the same exposure time (30 ms) using an attached RT slider CCD camera (Diagnostic Instruments, Inc., Sterling Heights, MI, USA). The images were quantified with Image-Pro Plus software (Media Cybernetics, North Reading, MA, USA). The greyscale image was converted to colour with red being the highest concentration and blue the lowest.
Analytical protocol for CF
Phloem unloading was investigated with CF in a separate set of plants. Five mg of carboxyfluorescein diacetate (CFDA; Molecular Probes Inc., Eugene, OR, USA), a phloem-mobile fluorescent dye, was infused into the stem as described by Mäkelä et al. (2005). When fed to the stem, the dye was completely taken up within 1 h by the transpiring plants during the photoperiod. After delivery to the leaves, the dye was loaded into the phloem where endogenous esterase cleaved off the diacetate, leaving the fluorescent CF trapped inside the phloem (Goodall and Johnson, 1982). One infusion per plant was made at the ear internode 1 d before pollination (4th day after silks first emerged). Control plants were infused with deionized water. Experiments to localize and analyse the CF were begun 1 d later (5th day after silks first emerged).
Analysing CF
In plants fed CFDA to the stems, CF was washed from the ovary sections according to the protocol in Fig. 2 and quantified fluorometrically with a Shimadzu RF 1501 spectrofluorophotometer (Kyoto, Japan) in 10 mm phosphate buffer (pH 8·0) with excitation at 492 nm and emission at 515 nm. CF contents were expressed as ng per section after calibration with a series of standard CF solutions prepared in 10 mm phosphate buffer (pH 8·0).
Imaging CF
Sections from the protocol (Fig. 2, Initial view and Views 1–3) were frozen in liquid N2, lyophilized then imaged using a Zeiss LSM510 laser confocal microscope (Carl Zeiss, Jena, Germany). Photos from four or more sections at each treatment were taken with a 2·5× Plan Neofluar objective (NA 0·075) using an HeNe laser with 488-nm excitation and 505–550-nm emission filter.
Co-localizing CF and sieve elements
Hand sections from fresh maize ovaries of CF-fed plants were processed as in Fig. 2 until View 2 to remove CF from the apoplast, then stained with aniline blue (0·01 % in 150 mm phosphate buffer, pH 8·2) for 1 h to reveal callose in the sieve plates of sieve elements. Both CF and sieve elements were simultaneously imaged in situ with a Zeiss LSM510 NLO laser confocal microscope (Carl Zeiss). CF was imaged as above, and callose–aniline blue complex with UV excitation and 560-nm longpass emission filter. Original yellow fluorescence from callose–aniline blue complex was false-coloured as white. Secondary walls of xylem elements auto-fluoresced as white in these conditions.
Statistics
All treatments were repeated in three or more plants. Analysis results were expressed as the mean and standard deviation of glucose, reducing sugars or CF contents. More than three sections were imaged in each treatment, and one representative glucose or CF image was shown.
RESULTS
In live tissues, glucose was detected in the pedicel around the phloem terminus (Fig. 3A). Auto-fluorescence indicated that the glucose was outside the terminus (Fig. 3B). There was a declining concentration gradient of glucose extending from the pedicel into the nucellus.
Fig. 3.
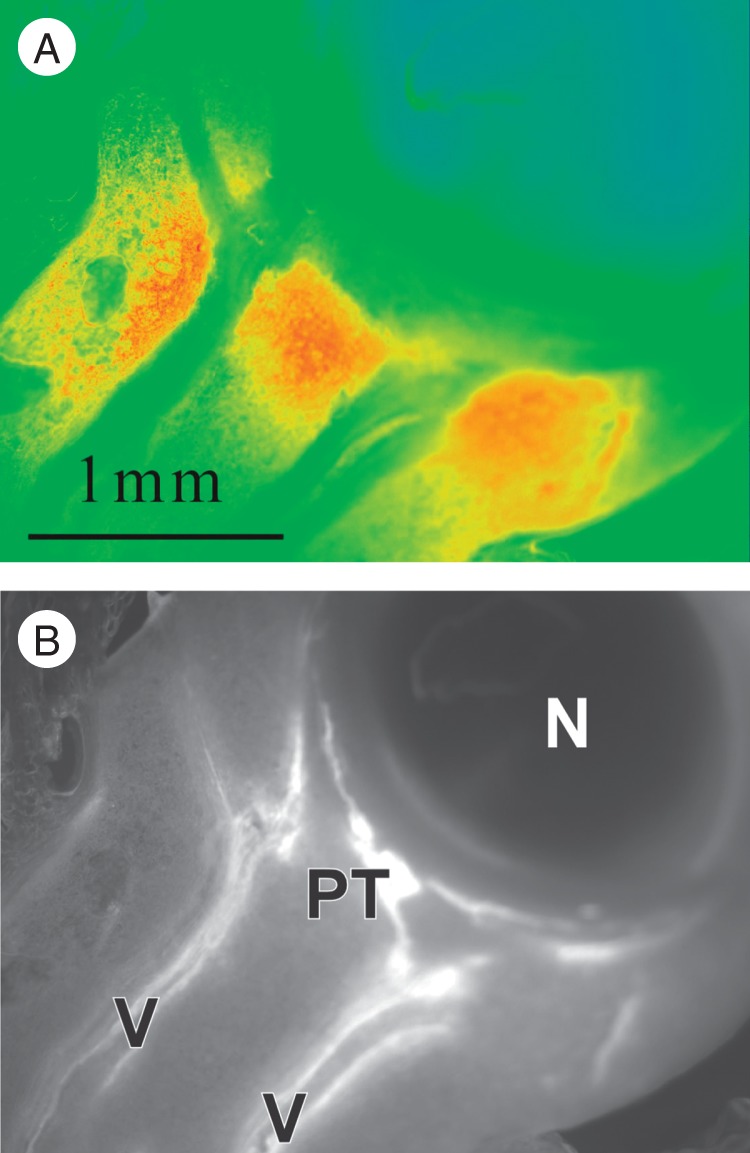
Apoplast glucose in a live maize ovary on the day of pollination, after a 2-s rinse to remove glucose from cut cells in the section. Because the enzymes for the glucose assay could not enter the live cells, only apoplast glucose is visible. (A) Glucose (red) is abundant in the upper tissues of the pedicel. (B) UV autofluorescence of the vascular system (V) and phloem termini (PT) of the section in (A) shows no vascular bundles enter the nucellus (N).
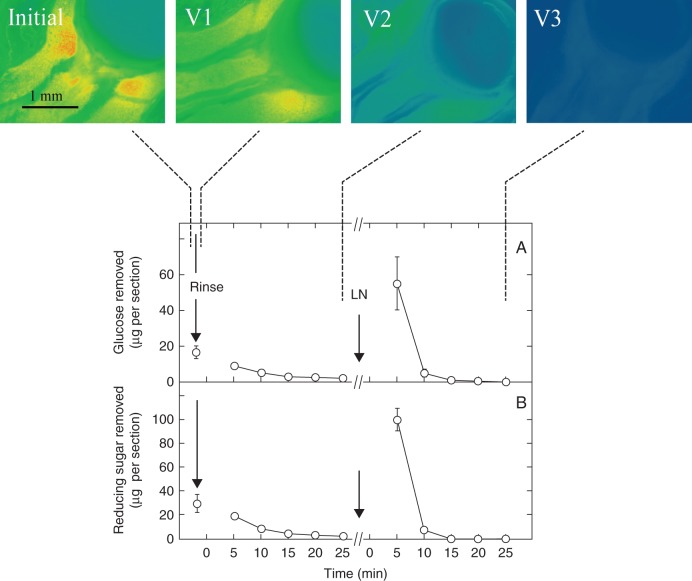
The glucose could be washed out of the live pedicel tissues (Fig. 4, Initial, V1 and V2). After five washes, glucose was scarcely detectable (V2). This was confirmed by analyses of the wash water. After five washes, most of the glucose had been removed (Fig. 4A at 25 min). If the sections were then frozen and thawed to break cell membranes (LN), subsequent washing removed more glucose (Fig. 4A) after which the sections again appeared depleted (V3).
Fig. 4.
Sugar in live sections of maize ovaries on the day of pollination, sampled as in the protocol in Fig. 2. Sections remained alive during imaging except after freezing and thawing in liquid nitrogen (LN) to disrupt cell membranes. Glucose images were made initially (Initial) and after a 2-s rinse (V1) and five washing steps (V2). After V2, sections were frozen and thawed, then washed five more times and imaged (V3). Graphs show analysis of wash water and indicate the amount of glucose (A) or reducing sugars (B) removed from the sections. Washes between Rinse and LN removed sugars from the apoplast. Washes between LN and the end of the protocol removed sugars from the symplast. Ovaries from at least three replicate plants were imaged for each view, and a typical image is shown. Data are means ± s.d. from three plants. Standard deviation was sometimes smaller than the data point.
To check these results, reducing sugars were analysed in the wash water (Fig. 4B). Sugar content was nearly double that for glucose probably because fructose also contributed to the content. Except for this difference, the washout results for reducing sugars were like those for glucose (cf. Fig. 4A, B).
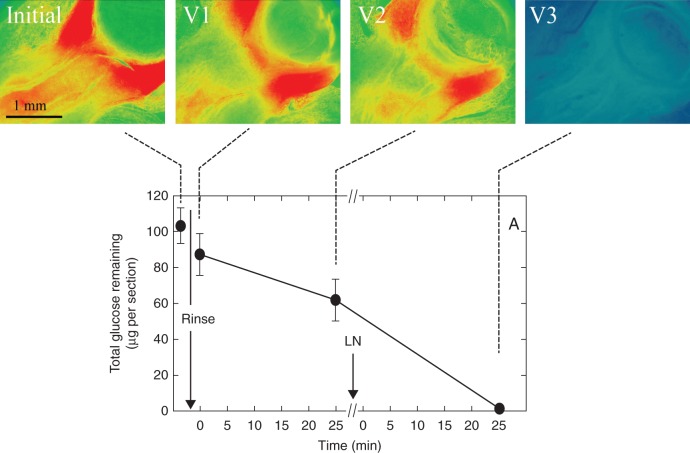
The large amount of glucose washed out of the sections after they had been frozen and thawed suggested that considerable glucose was present within the cells. To test this hypothesis, another series of live sections sampled in the protocol were immediately frozen in liquid N2 and lyophilized to allow their total glucose to be viewed (apoplast plus symplast).
More glucose was visible in the frozen/lyophilized sections (Initial, Fig. 5) than was detected in the live sections (Initial, Fig. 4). The total content was about 104 µg per section in the frozen/lyophilized sections (Initial, Fig. 5A), and rinsing for 2 s to remove surface glucose decreased the total to 90 µg per section (V1 and Fig. 5A). Subsequent washes removed further glucose and after five of them, the total remaining glucose was 64 µg per section (V2 and Fig. 5A). If the live sections were then frozen and thawed to break the cell membranes (Fig. 5A, LN), subsequent washes completely removed the remaining glucose, which was confirmed by the glucose image (V3 and Fig. 5A).
Fig. 5.
Total glucose in live maize ovaries on the day of pollination, sampled as in the protocol of Fig. 2. Note the glucose in the nucellus. (A) Total glucose remaining in the sections, obtained by summing the amounts removed in the wash water plus the residual amount at the end. Sections for imaging were immediately frozen then lyophilized. V1 contains both apoplast and symplast glucose after the rinse, V2 contains only symplast glucose, and V3 contains the residual glucose after all washes. Ovaries from at least three replicate plants were imaged for each view, and a typical image is shown. Data in graphs are means ± s.d. from three plants. Standard deviation was sometimes smaller than the data point.
When CFDA was fed to the stems of the plants, CF was detected 24 h later in ovary sections (Fig. 6). The CF appeared in or near the vascular system but also in the surrounding tissues. No CF was in the nucellus.
Fig. 6.
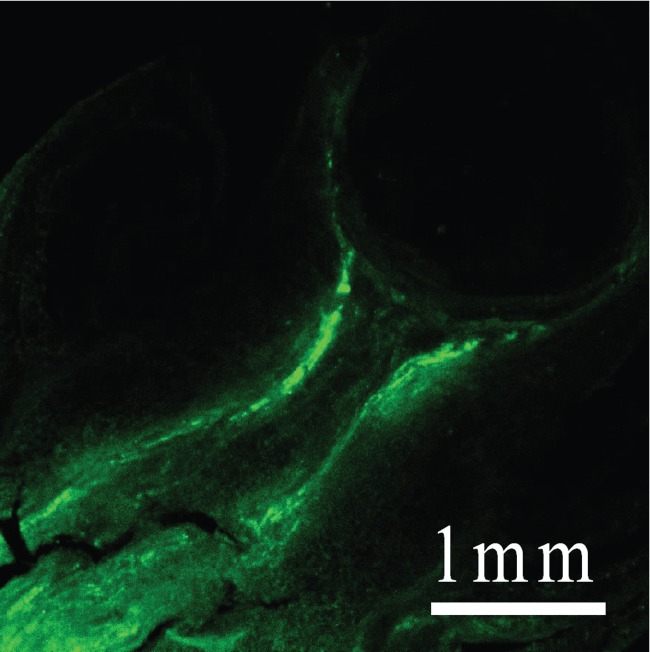
Carboxyfluorescein (CF) in a live maize ovary on the day of pollination 24 h after feeding the dye to the stem of the plant. The section was rinsed for 2 s to remove CF from cut cells, then frozen and lyophilized to prevent further movement of the dye. Note absence of CF in the nucellus.
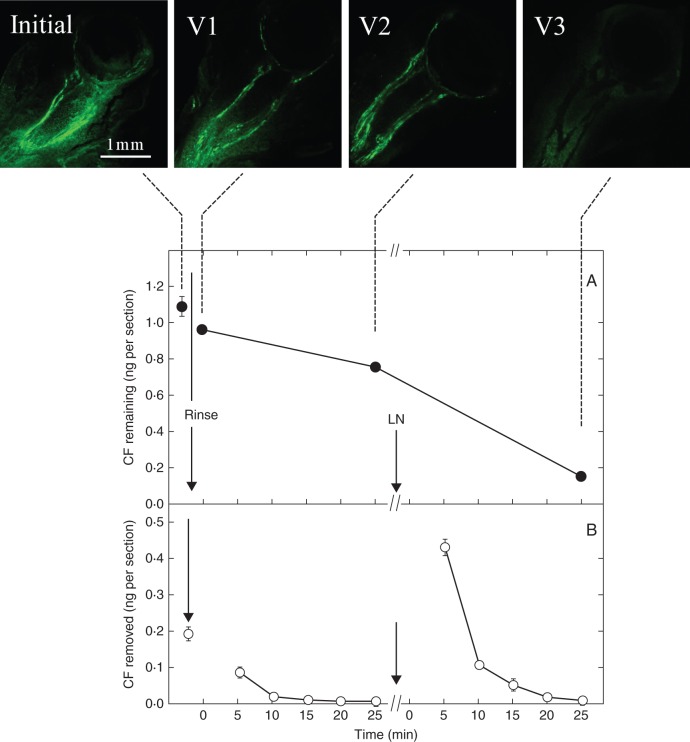
Initially, the live ovary sections contained a total of about 1·09 ng of CF per section (Fig. 7A). Rinsing the sections removed surface CF and decreased the content to 0·96 ng per section. After washing five times, the content had fallen to 0·77 ng per section. Each wash removed less CF (Fig. 7B). Images confirmed that CF was being removed mostly from the tissues surrounding the vascular system in the pedicel (Fig. 7, Initial, V1 and V2). After freezing and thawing the sections to break the cell membranes, the next wash released a large amount of CF (about 0·44 ng per section, Fig. 7B). Further washes removed most of the remaining CF, which was confirmed by the CF image (Fig. 7, V3).
Fig. 7.
Carboxyfluorescein (CF) in the apoplast and symplast of live sections of maize ovaries on the day of pollination, sampled as in the protocol in Fig. 2. CF images (Initial, V1–V3) above graphs show appearance of sections initially and after rinse and washing steps. (A) Amount of CF remaining in the sections obtained from the sum of the washes plus the small amount extracted from the V3 sections at the end. (B) Amount removed from the sections during the rinse and subsequent washes. Washes between Rinse and LN removed CF from the apoplast. At LN, the sections were frozen in liquid nitrogen and thawed to disrupt cell membranes. Washes between LN and the end of the protocol removed CF from the symplast. Ovaries from at least three replicate plants were imaged for each view, and a typical image is shown. Data in graphs are means ± s.d. of three plants. Standard deviation was sometimes smaller than the data point.
To determine the cellular location of CF after the live sections had been washed five times (Fig. 7, V2), the sections were stained with aniline blue to reveal sieve plates in the sieve elements. Figure 8 indicates that most CF had been unloaded from the sieve elements to nearby companion cells or parenchyma, which held the remaining CF. After the sections were frozen in liquid N2 and washed a further five times, most of the CF was released by these cells.
Fig. 8.
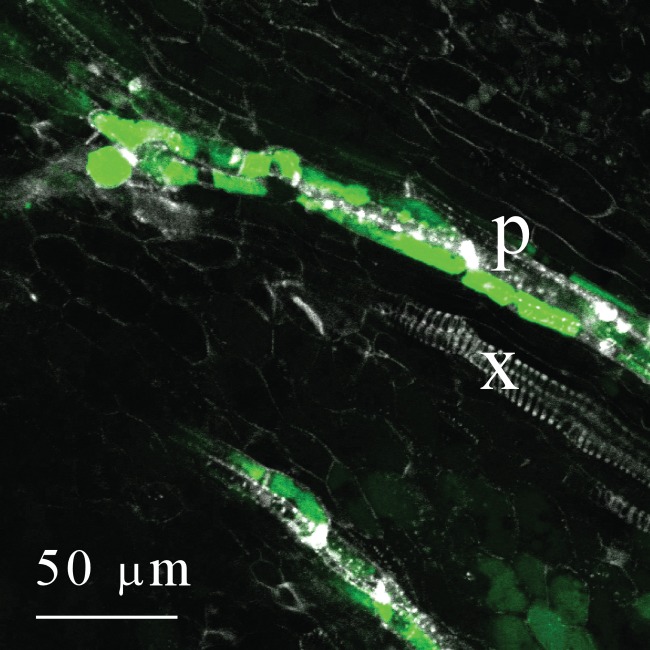
Co-localiztion of carboxyfluorescein (CF, green), phloem sieve plates (white) and xylem (white) in a live section of a maize ovary on the day of pollination. After washing five times to remove CF from the apoplast, the remaining CF is mostly in the companion cells or parenchyma alongside the sieve elements. Large white sieve plates and smaller pits show phloem sieve elements (p), which contain little if any CF. Autofluorescence of xylem (x) shows a series of white spirals or circular wall thickenings.
DISCUSSION
Translocation path for sucrose
The path of sucrose to developing maize florets included an apoplast step, demonstrated with images of glucose derived from sucrose. The enzymes for the images could not enter the live cells, so any visible glucose had to be in the apoplast. Substantial glucose was undeniable in these images and could be washed out. After five washes of the live sections, the apoplast glucose was depleted. The strictly symplasm path is thus rejected for sucrose transport.
These results were confirmed with CF showing a substantial amount of CF washing out of the pedicel. The CF is normally held tightly along the phloem axis in maize (Mäkelä et al., 2005). Sucrose likewise tends to be tightly held along the phloem axis because sucrose symporters act to retrieve most escaping sucrose (Weschke et al., 2000; Vaughn et al., 2002; Aoki et al., 2004; Scofield et al., 2007). The release of CF and sucrose by the phloem termini is thus noteworthy. Because the chemical structure of these compounds differs, and CF is not naturally in the phloem, the release must have been non-selective. Thus, the membranes of the phloem axis prevented release while those at the termini allowed release, apparently under control of the phloem parenchyma near the phloem termini (shown by CF in these cells, and also see Fisher and Oparka, 1996; Patrick, 1997; Roberts et al., 1997).
Despite the similar path and release of CF and sucrose to the pedicel apoplast, their paths diverged afterward. Glucose entered the nucellus but CF did not. The absence of CF implies that plasmodesmata did not connect the pedicel to the nucellus. Instead, glucose had to be selectively absorbed from the apoplast by the nucellar membranes. In effect, the membranes on the pedicel side of the apoplast were non-selective while those on the nucellar side were highly selective.
Symplast biochemistry in the pedicel
Although sucrose was released to the apoplast of the pedicel where it was hydrolysed to glucose (and fructose), the symplasm also contained a pool of glucose. The glucose was visible in live sections that had been washed to deplete the apoplast and subsequently frozen in liquid N2 and thawed to break cell membranes. Substantial glucose could be seen and, without functioning membranes, subsequently washed out. The presence of this symplast pool was confirmed when total glucose was determined (apoplast plus symplast). The total was always greater than in the apoplast alone.
It is unlikely that the symplast glucose arose from direct transport of sucrose. For this to occur, sucrose synthase or soluble invertase or both would be required in the pedicel symplasm (Alonso et al., 2005). No activity was found for sucrose synthase (Zinselmeier et al., 1995b), although Wittich and Vreugdenhil (1998) found slight amounts in the antipodal cells of the embryo sac and in the integuments. No soluble invertase was found in the pedicel (McLaughlin and Boyer, 2004a; Mäkelä et al., 2005). Neutral invertase had only very low activity (Zinselmeier et al., 1995b). These missing biochemical steps for sugar metabolism in the pedicel (red in Fig. 9) would prevent sucrose from being hydrolysed in the symplasm. The missing steps are unlikely to be an artefact. For example, soluble invertase found in the nucellus would probably have been detected in the pedicel if present (Fig. 1A; McLaughlin and Boyer, 2004a). Its absence thus forced glucose in the symplasm to be imported from the apoplast (black in Fig. 9).
Fig. 9.
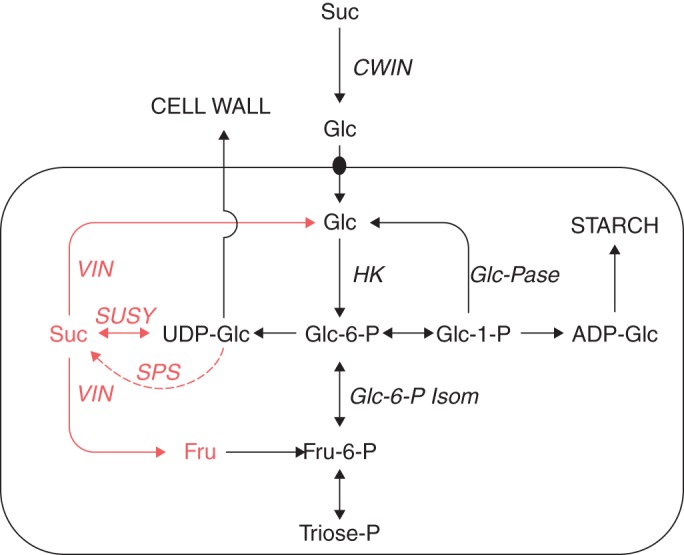
Likely sugar metabolism of the maize pedicel. In the cells around the vascular system of the pedicel (enclosed reactions), steps in red appear to be absent while those in black operate (see text). Phloem termini of the pedicel deliver sucrose to the apoplast (i.e. CELL WALL) where it appears to be hydrolysed by invertase (CWIN). The resulting glucose is imported by cells surrounding the vascular system in the pedicel, which convert some of it to starch (STARCH). Key: sucrose (Suc), glucose (Glc), fructose (Fru), cell-wall invertase (CWIN), soluble invertase (VIN), sucrose synthase (SUSY), hexokinase (HK), glucose phosphatase (Glc-Pase), glucose-6-P isomerase (Glc-6-P Isom), sucrose phosphate synthase (SPS). Metabolic scheme is for the maize root according to Alonso et al. (2005), but showing modifications in red for the maize pedicel. Copyright American Society of Plant Biologists (www.plantphysiol.org).
The import of glucose might be mediated by hexose/proton symporters co-expressed with cell-wall invertases (Bush, 1993; Weschke et al., 2003). These play a role in embryo absorption of hexoses in legumes and barley (Hordeum vulgare), and have homologues in maize and rice (Oriza sativa). Also, porters recently found in plant cell membranes (Chen et al., 2010) were coded by SWEET genes. The protein from SWEET1 is a uniporter in the plasma membrane and moves glucose into the cytoplasm in a concentration-dependent manner. There are 17 SWEET genes in Arabidopsis (Arabidopsis thaliana) and 21 in rice targeting various organelle membranes. If some of these porters are active, glucose might be absorbed from the apoplast of maize florets for synthesizing starch in the pedicel symplast (Fig. 1D), and similarly absorbed by the nucellus for biosynthesis.
Membrane selectivity
So far efflux carriers at phloem termini have not been identified for sucrose (Kühn and Grof, 2010), although Zhang et al. (2007) list several candidates (non-selective channels, sucrose/H+ antiporters, sucrose/H+ symporters, H+-ATPases, sucrose facilitators, aquaporins, and pulsing Cl− channels). SWEET11 and SWEET12 were recently added to this list (Chen et al., 2012). From the present results, it seems that sucrose-specific candidates can be eliminated, leaving non-selective channels, aquaporins and H+-ATPases as remaining candidates. There is evidence that aquaporins allow water and certain carbohydrates to be co-released, among them sugars (Chen et al., 2001; Maurel et al., 2008). In the present work, the release was not caused by a general loss of membrane integrity because the nucellus of the same live sections absorbed glucose and not CF. The nucellar membranes thus displayed a selectivity expected for most healthy plant membranes.
These results suggest the model of Fig. 10 showing that phloem sieve elements operate with selective membranes along the axis but unload phloem contents to parenchyma cells at the terminus (grey, Fig. 10). The terminus membranes in turn release the sucrose to the apoplast non-selectively (red, Fig. 10). In the apoplast, sucrose is hydrolysed to glucose and fructose, and the glucose is absorbed selectively by the nucellus and the pedicel cells around the vascular system. The apoplast of the pedicel thus serves as a depot for released carbon similar to that between maternal and filial tissues (Patrick and Offler, 1995, 1996), but without the filial tissues.
Fig. 10.
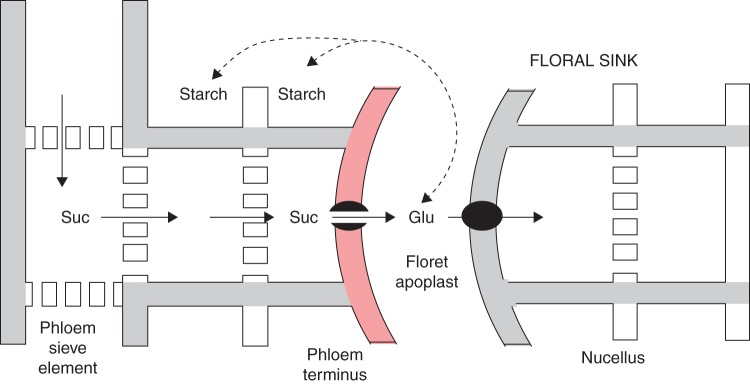
Summary of sucrose transport in developing female florets before an embryo is present in maize. Phloem contents including sucrose (Suc) are moved to phloem terminus where they are released non-selectively through the red plasma membrane (black dot with channel). In the apoplast, the sucrose is hydrolysed to glucose (Glu) and fructose. The nucellus selectively absorbs glucose (black dot), and the pedicel tissues around the phloem termini also absorb glucose but convert it to starch (dashed arrow). Although the embryo is absent, this scheme is similar to that when an embryo is present, according to Patrick and Offler (1995, 1996).
Driving force for phloem tranport
The release of sucrose and CF at the phloem termini should alter the osmotic properties of the phloem according to the membrane concepts of Staverman (1951, 1952), Dainty (1963) and Slatyer (1967) and summarized by the following equation:
| (1) |
where J is the volume flux through the membrane (m3 s−1 m−2 of membrane area), Lp is the hydraulic conductivity of the membrane (m3 s−1 m−2 MPa−1), Ψs is the osmotic potential (MPa, negative), P is the pressure (positive for turgor pressure, negative for tension), and subscripts i and o are the two sides of the membrane, inner and outer, respectively. The reflection coefficient σ indicates the ability of the membrane to discriminate between solutes and water. Varying between 1 (fully discriminating) and zero (unable to discriminate), most membranes of plant cells have σ of about 1 for metabolites (Kramer and Boyer, 1995). In the present work, however, the co-release of sucrose and CF indicates that the phloem terminus has membranes with low selectivity, suggesting σ less than 1.
At these termini, volume flux is low because it is restricted mostly to the volume growth of the sink (transpiration is minimal). In eqn (1), as J approaches zero σ approaches the ratio:
| (2) |
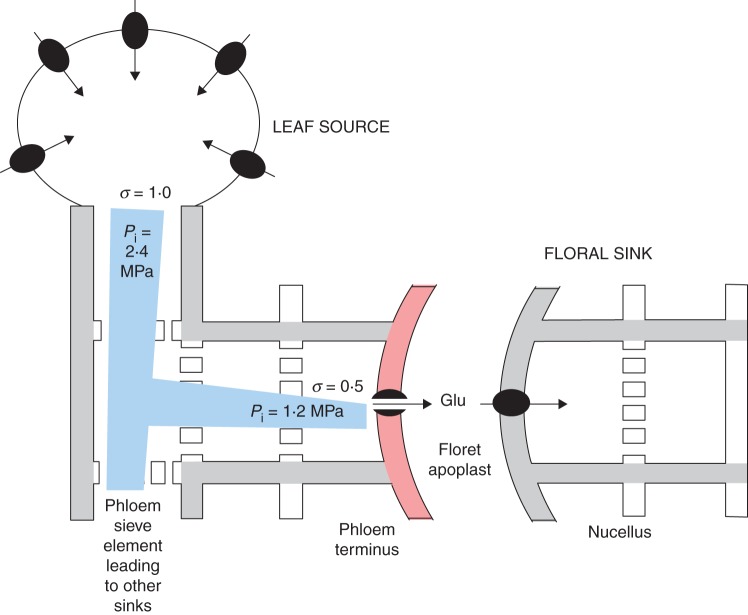
and the pressure differential is decreased in proportion to σ. With σ less than 1 at the phloem termini in maize, –(Po – Pi) should be less than (Ψs,o – Ψs,i). Fisher and Cash-Clark (2000, table 1) conducted painstaking measurements using aphid stylets for Pi and Ψs,i along the phloem in wheat (Triticum aestivum). Despite a Pi of about 2·4 MPa along the axis, Pi was only 1·2 MPa at the termini while Ψs,i remained about –2·5 MPa. Po in the endosperm cavity was negligible. Assuming that sucrose was converted to glucose in the apoplast, Ψs,o for sucrose would be negligible. Placing these values in eqn (2), σ was 1·2/2·5 or about 0·5 in wheat, which would generate a pressure gradient if applied to maize florets in this work. The proposed maize gradient in Fig. 11 then arises from the non-selective release by the membranes of the vascular parenchyma at the phloem terminus and the hydrolysis of sucrose in the apoplast.
Fig. 11.
Consequence of sucrose release to apoplast in maize florets of this study. At the leaf end of the phloem and along the phloem axis (Leaf Source and grey regions on the left), sucrose is a major osmotic constituent in the phloem and is loaded across membranes with σ equalling 1. Assuming phloem conditions in wheat (Fisher and Cash-Clark, 2000), Pi of 2·4 MPa in maize would nearly balance Ψs,i of –2·5 MPa in the sieve elements. At the phloem termini (red), however, sucrose is released non-selectively and hydrolysed by cell-wall invertase. This would decrease σ below 1 and reduce Pi (eqn 2). Applying conditions in wheat, Pi would be 1·2 MPa despite Ψs,i remaining at –2·5 MPa. In this fashion, a Pi gradient (blue) would be established along the phloem that drives phloem contents toward the sink by bulk flow (Münch, 1930).
Alternative interpretations
Although this theory proposes that floret membranes normally release phloem solute to the apoplast at phloem termini, it is important to explore other interpretations. Indeed, another study (Boyer et al., 2008) reported cell contents released to the apoplast when leaf sections of water-deficient wheat (Triticum aestivum) and barley (Hordeum vulgare) were floated on water. The release was caused by unusually high turgor developed as the sections absorbed water because solute had accumulated during the water deficit. If the plants were not water deficient, the solute was not accumulated and the release did not occur.
In the present work, this type of release is unlikely. Although the floret tissues were washed in water, glucose was in the apoplast before washing occurred (Fig. 4, Initial view and V1). The sections were alive, indicating the glucose was in the apoplast of the intact plant. Moreover, the plants were not water deficient. Ovary water potentials were –0·3 to –0·4 MPa (Fig. 12) indicating the ovaries were regularly exposed to dilute solutions in the intact plants. Washing in water would increase turgor only slightly.
Fig. 12.
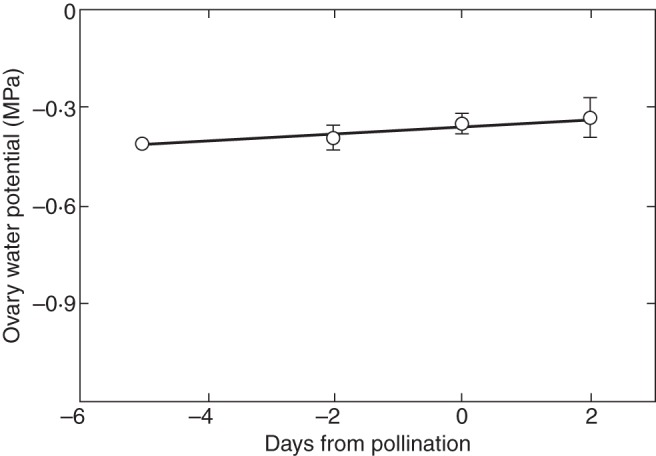
Apoplast water potential of maize florets before, during and after pollination when plants were supplied with adequate water. Florets contained pedicel and nucellus but lacked stigma and style, which had been removed. Measurements were made by isopiestic thermocouple psychrometry, which detects vapour pressure of the evaporating surfaces of the cell walls in equilibrium with the water potential of the cells (Boyer, 1995). This gives a direct measure of apoplast conditions averaged over the floret. Adapted from Zinselmeier et al. (1999). Copyright American Society of Plant Biologists (www.plantphysiol.org).
It is possible that sucrose continued to be released to the apoplast after the ovaries were sampled, thus over-estimating the sugar content in the apoplast of the intact plant. However, this would involve only the normal release mechanisms rather than artefacts caused by washing.
Another possibility is that tissue slicing caused solutes to move to the apoplast. Slicing certainly released solute from the cut cells, but this solute was removed in the 2-s rinse. Removal of the remaining solute required long washes as though the solute was deep in the tissue. While glucose could be seen in the pedicel apoplast of the live sections, CF also could be seen there. By contrast, no apoplast CF could be seen in images made the same way along the phloem axis at the base of the ear (Fig. 13). If CF had been erroneously released to the apoplast by cutting, it should have been released along the axis at the base of the ear. Similarly in the florets, cutting should have released CF in tissues around the nucellus and contaminated those tissues. However, no CF was in the nucellus.
Fig. 13.
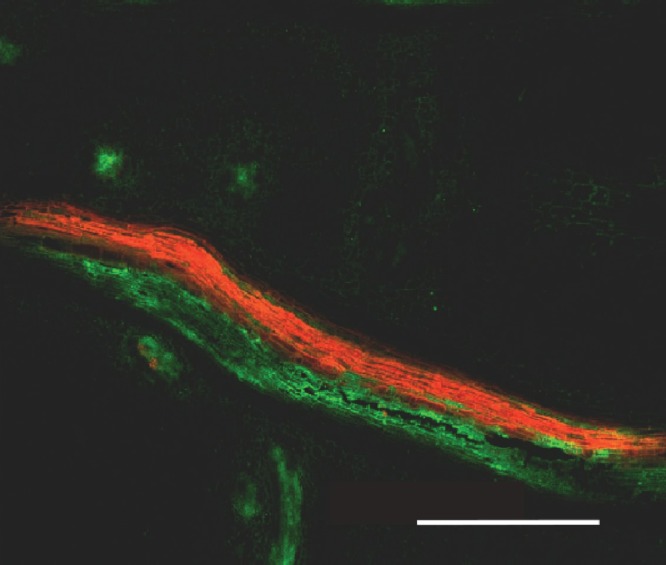
Vascular strands at the base of a maize ear around the time of pollination. Phloem strand contains carboxyfluorescein (green) and xylem strand contains safranin (red), each with 30–60 vascular elements. The large number of vascular elements presumably feed approx. 500 florets in the ear, each with a phloem terminus. The dyes were fed simultaneously to the stem 24 h earlier. Note the absence of green fluorescence in tissues surrounding the strands, indicating that the phloem axis did not release carboxyfluorescein to the apoplast. Scale bar = 1 mm. From Mäkelä et al. (2005).
These results indicate that solutes did not leak from phloem termini because of washing or cutting procedures. But if sucrose was released to the pedicel apoplast and hydrolysed there by invertase, why was invertase also present in the nucellus? Maize ovaries are important sinks for carbon, gaining about 0·7–1 mg of dry mass every day at pollination (Zinselmeier et al., 1999; Mäkelä et al., 2005). Assuming the arriving dry mass was mostly sucrose some of which was respired, the ovaries probably hydrolysed as much as 1 mg of sucrose each day. As shown by Zinselmeier et al. (1999), the acid invertase in the apoplast was capable of hydrolysing 0·86 mg of sucrose per day or nearly all of the incoming sucrose. Therefore, only a small amount of sucrose was likely to escape from the apoplast, but that remnant would be hydrolysed by the soluble invertase in the nucellus, which may be the reason for its presence in the nucellus.
The invertases and sucrose synthases are the only known enzymes for sucrose breakdown in plants (Sturm and Tang, 1999). Although the invertases appeared to dominate sucrose hydrolysis in maize ovaries (McLaughlin and Boyer, 2004a), Wittich and Vreugdenhil (1998) reported small amounts of sucrose synthase activity. McLaughlin and Boyer (2004b) detected gene expression for both forms of the enzyme. A product of the reaction mediated by sucrose synthases, UDPglucose, was found in nanomole quantities in the ovaries by Zinselmeier et al. (1999). Consequently, before an embryo is present, it seems possible that slight amounts of sucrose could be broken down by sucrose synthase in addition to the large amounts hydrolysed by invertases. Later when endosperm is deposited in the kernel, the sucrose synthases become dominant in the upper endosperm and invertases in the lower endosperm (Doehlert et al., 1988).
Conclusions
It seems safe to conclude that, despite the absence of an embryo, an apoplast is part of the path delivering phloem contents to the female floret of maize. Along the phloem axis, the phloem contents are retained but at the termini they are released to the apoplast non-selectively. Apparently, the release is controlled by plasma membranes of the parenchyma around the phloem termini in the pedicel. The non-selectivity of the release may be the reason pressure is low in the sieve cells at the termini, driving bulk flow toward the sink. The system involves sucrose hydrolysis in the apoplast, causing glucose to accumulate there. The nucellus absorbs the released compounds selectively and supplies them to the embryo sac and later to an embryo.
ACKNOWLEDGEMENTS
This work is dedicated to Professor Donald B. Fisher whose careful measurements have given deep insight into phloem function.
LITERATURE CITED
- Alonso AP, Vigeolas H, Raymond P, Rolin D, Dieuaide-Noubhani M. A new substrate cycle in plants. Evidence for a high glucose-phosphate-to-glucose turnover from in vivo steady-state and pulse-labeling experiments with [13C]glucose and [14C]glucose. Plant Physiology. 2005;138:2220–2232. doi: 10.1104/pp.105.062083. [DOI] [PMC free article] [PubMed] [Google Scholar]
- Amiard V, Morvan-Bertrand A, Cliquet J-B, et al. Carbohydrate and amino acid composition in phloem sap of Lolium perenne L. before and after defoliation. Canadian Journal of Botany. 2004;82:1594–1601. [Google Scholar]
- Aoki N, Scofield GN, Wang X-D, Patrick JW, Offler CE, Furbank RT. Expression and localisation analysis of the wheat sucrose transporter TaSUT1 in vegetative tissues. Planta. 2004;219:176–184. doi: 10.1007/s00425-004-1232-7. [DOI] [PubMed] [Google Scholar]
- Boyer JS. Measuring the water status of plants and soils. San Diego: Academic Press; 1995. [Google Scholar]
- Boyer JS, McLaughlin JE. Functional reversion to identify controlling genes in multigenic responses: analysis of floral abortion. Journal of Experimental Botany. 2007;58:267–277. doi: 10.1093/jxb/erl177. [DOI] [PubMed] [Google Scholar]
- Boyer JS, Westgate ME. Grain yields with limited water. Journal of Experimental Botany. 2004;55:2385–2394. doi: 10.1093/jxb/erh219. [DOI] [PubMed] [Google Scholar]
- Boyer JS, James RA, Munns R, Condon AG, Passioura JB. Osmotic adjustment leads to anomalously low estimates of relative water content in wheat and barley. Functional Plant Biology. 2008;35:1172–1182. doi: 10.1071/FP08157. [DOI] [PubMed] [Google Scholar]
- Boyle MG, Boyer JS, Morgan PW. Stem infusion of liquid culture medium prevents reproductive failure of maize at low water potential. Crop Science. 1991;31:1246–1252. [Google Scholar]
- Bush DR. Proton-coupled sugar and amino acid transporters in plants. Annual Review of Plant Physiology and Plant Molecular Biology. 1993;44:513–542. [Google Scholar]
- Chen GP, Wilson ID, Kim SH, Grierson D. Inhibiting expression of a tomato ripening-associated membrane protein increases organic acids and reduces sugar levels of fruit. Planta. 2001;212:799–807. doi: 10.1007/s004250000431. [DOI] [PubMed] [Google Scholar]
- Chen L-Q, Hou B-H, Lalonde S, et al. Sugar transporters for intercellular exchange and nutrition of pathogens. Nature. 2010;468:527–534. doi: 10.1038/nature09606. [DOI] [PMC free article] [PubMed] [Google Scholar]
- Chen L-Q, Qu X-Q, Hou B-H, et al. Sucrose efflux mediated by SWEET proteins as a key step for phloem transport. Science. 2012;335:207–211. doi: 10.1126/science.1213351. [DOI] [PubMed] [Google Scholar]
- Cheng W-H, Taliercio EW, Chourey PS. The Miniature1 seed locus of maize encodes a cell wall invertase required for normal development of endosperm and maternal cells in the pedicel. Plant Cell. 1996;8:971–983. doi: 10.1105/tpc.8.6.971. [DOI] [PMC free article] [PubMed] [Google Scholar]
- Dainty J. Water relations of plant cells. Advances in Botanical Research. 1963;1:279–326. [Google Scholar]
- Doehlert DC, Kuo TM, Felker FC. Enzymes of sucrose and hexose metabolism in developing kernels of two inbreds of maize. Plant Physiology. 1988;86:1013–1019. doi: 10.1104/pp.86.4.1013. [DOI] [PMC free article] [PubMed] [Google Scholar]
- Fisher DB. Changes in the concentration and composition of peduncle sieve tube sap during grain filling in normal and phosphate-deficient wheat plants. Australian Journal of Plant Physiology. 1987;14:147–156. [Google Scholar]
- Fisher DB, Cash-Clark CE. Gradients in water potential and turgor pressure along the translocation pathway during grain filling in normally watered and water-stressed wheat plants. Plant Physiology. 2000;123:139–147. doi: 10.1104/pp.123.1.139. [DOI] [PMC free article] [PubMed] [Google Scholar]
- Fisher DB, Oparka KJ. Post-phloem transport: principles and problems. Journal of Experimental Botany. 1996;47:1141–1154. doi: 10.1093/jxb/47.Special_Issue.1141. [DOI] [PubMed] [Google Scholar]
- Goodall H, Johnson MH. Use of carboxyfluorescein diacetate to study formation of permeable channels between mouse blastomeres. Nature. 1982;295:524–526. doi: 10.1038/295524a0. [DOI] [PubMed] [Google Scholar]
- Hayashi H, Chino M. Collection of pure phloem sap from wheat and its chemical composition. Plant and Cell Physiology. 1986;27:1387–1394. [Google Scholar]
- Hayashi H, Chino M. Chemical composition of phloem sap from the uppermost internode of the rice plant. Plant and Cell Physiology. 1990;31:247–251. [Google Scholar]
- Hiyane R, Hiyane S, Tang A.-C, Boyer JS. Sucrose feeding reverses shade-induced kernel losses in maize. Annals of Botany. 2010;106:395–403. doi: 10.1093/aob/mcq132. [DOI] [PMC free article] [PubMed] [Google Scholar]
- Kramer PJ, Boyer JS. Water relations of plants and soils. San Diego: Academic Press; 1995. [Google Scholar]
- Kühn C, Grof CP. Sucrose transporters of higher plants. Current Opinion in Plant Biology. 2010;13:288–298. doi: 10.1016/j.pbi.2010.02.001. [DOI] [PubMed] [Google Scholar]
- Mäkelä P, McLaughlin JE, Boyer JS. Imaging and quantifying carbohydrate transport to the developing ovaries of maize. Annals of Botany. 2005;96:939–949. doi: 10.1093/aob/mci246. [DOI] [PMC free article] [PubMed] [Google Scholar]
- Maurel C, Verdoucq L, Luu D-T, Santoni V. Plant aquaporins: membrane channels with multiple integrated functions. Annual Review of Plant Biology. 2008;59:595–624. doi: 10.1146/annurev.arplant.59.032607.092734. [DOI] [PubMed] [Google Scholar]
- McLaughlin JE, Boyer JS. Glucose localization in maize ovaries when kernel number decreases at low water potential and sucrose is fed to the stems. Annals of Botany. 2004a;94:75–86. doi: 10.1093/aob/mch123. [DOI] [PMC free article] [PubMed] [Google Scholar]
- McLaughlin JE, Boyer JS. Sugar-responsive gene expression, invertase activity, and senescence in aborting maize ovaries at low water potentials. Annals of Botany. 2004b;94:675–689. doi: 10.1093/aob/mch193. [DOI] [PMC free article] [PubMed] [Google Scholar]
- Miller ME, Chourey PS. The maize invertase-deficient miniature-1 seed mutation is associated with aberrant pedicel and endosperm development. The Plant Cell. 1992;4:297–305. doi: 10.1105/tpc.4.3.297. [DOI] [PMC free article] [PubMed] [Google Scholar]
- Münch E. Die Stoffbewegungen in der Pflanze. Jena: Fischer; 1930. [Google Scholar]
- Nelson N. A photometric adaptation of the Somogyi method for the determination of glucose. Journal of Biological Chemistry. 1944;153:375–380. [Google Scholar]
- Ohshima T, Hayashi H, Chino M. Collection and chemical composition of pure phloem sap from Zea mays L. Plant and Cell Physiology. 1990;31:735–737. [Google Scholar]
- Oparka KJ, Duckett CM, Prior DAM, Fisher DB. Real-time imaging of phloem unloading in the root tip of Arabidopsis. The Plant Journal. 1994;6:759–766. [Google Scholar]
- Patrick JW. Phloem unloading: sieve element unloading and post-sieve element transport. Annual Review of Plant Physiology and Plant Molecular Biology. 1997;48:191–222. doi: 10.1146/annurev.arplant.48.1.191. [DOI] [PubMed] [Google Scholar]
- Patrick JW, Offler CE. Post-sieve element transport of sucrose in developing seeds. Australian Journal of Plant Physiology. 1995;22:681–702. [Google Scholar]
- Patrick JW, Offler CE. Post-sieve element transport of photoassimilates in sink regions. Journal of Experimental Botany. 1996;47:1165–1177. doi: 10.1093/jxb/47.Special_Issue.1165. [DOI] [PubMed] [Google Scholar]
- Porter GA, Knievel DP, Shannon JC. Sugar efflux from maize (Zea mays L.) pedicel tissue. Plant Physiology. 1985;77:524–531. doi: 10.1104/pp.77.3.524. [DOI] [PMC free article] [PubMed] [Google Scholar]
- Roberts AG, Santa Cruz S, Roberts IM, Prior DAM, Turgeon R, Oparka KJ. Phloem unloading in sink leaves of Nicotiana benthamiana: comparison of a fluorescent solute with a fluorescent virus. The Plant Cell. 1997;9:1381–1396. doi: 10.1105/tpc.9.8.1381. [DOI] [PMC free article] [PubMed] [Google Scholar]
- Ruan Y-L, Jin Y, Yang Y-J, Li G-J, Boyer JS. Sugar input, metabolism, and signaling mediated by invertase: roles in development, yield potential, and response to drought and heat. Molecular Plant. 2010;3:942–955. doi: 10.1093/mp/ssq044. [DOI] [PubMed] [Google Scholar]
- Saini HS, Westgate ME. Reproductive development in grain crops during drought. Advances in Agronomy. 2000;68:59–96. [Google Scholar]
- Scofield GN, Hirose T, Aoki N, Furbank RT. Involvement of the sucrose transporter, OsSUT1, in the long-distance pathway for assimilate transport in rice. Journal of Experimental Botany. 2007;58:3155–3169. doi: 10.1093/jxb/erm153. [DOI] [PubMed] [Google Scholar]
- Shannon JC. Movement of 14C-labeled assimilates into kernels of Zea mays L. I. Pattern and rate of sugar movement. Plant Physiology. 1972;49:198–202. doi: 10.1104/pp.49.2.198. [DOI] [PMC free article] [PubMed] [Google Scholar]
- Shannon JC, Dougherty CT. Movement of l4C-labeled assimilates into kernels of Zea mays L. II. Invertase activity of the pedicel and plancento-chalazal tissues. Plant Physiology. 1972;49:203–206. doi: 10.1104/pp.49.2.203. [DOI] [PMC free article] [PubMed] [Google Scholar]
- Slatyer RO. Plant water relationships. New York: Academic Press; 1967. [Google Scholar]
- Staverman AJ. The theory of measurement of osmotic pressure. Recueil des Travaux Chimiques des Pays-Bas. 1951;70:344–352. [Google Scholar]
- Staverman AJ. Apparent osmotic pressure of solutions of heterodisperse polymers. Recueil des Travaux Chimiques des Pays-Bas. 1952;71:623–633. [Google Scholar]
- Sturm A, Tang G-Q. The sucrose-cleaving enzymes of plants are crucial for development, growth and carbon partitioning. Trends in Plant Science. 1999;4:401–407. doi: 10.1016/s1360-1385(99)01470-3. [DOI] [PubMed] [Google Scholar]
- Vaughn MW, Harrington GN, Bush DR. Sucrose-mediated transcriptional regulation of sucrose symporter activity in the phloem. Proceedings of the National Academy of Sciences USA. 2002;99:10876–10880. doi: 10.1073/pnas.172198599. [DOI] [PMC free article] [PubMed] [Google Scholar]
- Weschke W, Panitz R, Sauer N, Wang Q, Neubohn B, Weber H. Sucrose transport into barley seeds: molecular characterization of two transporters and implications for seed development and starch accumulation. The Plant Journal. 2000;21:455–467. doi: 10.1046/j.1365-313x.2000.00695.x. [DOI] [PubMed] [Google Scholar]
- Weschke W, Panitz R, Gubatz S, et al. The role of invertases and hexose transporters in controlling sugar ratios in maternal and filial tissues of barley caryopses during early development. The Plant Journal. 2003;33:395–411. doi: 10.1046/j.1365-313x.2003.01633.x. [DOI] [PubMed] [Google Scholar]
- Westgate ME, Boyer JS. Reproduction at low silk and pollen water potentials in maize. Crop Science. 1986;26:951–956. [Google Scholar]
- Wittich PE, Vreugdenhil D. Localization of sucrose synthase activity in developing maize kernels by in situ enzyme histochemistry. Journal of Experimental Botany. 1998;49:1163–1171. [Google Scholar]
- Zhang W-H, Zhou Y, Dibley KE, Tyerman SD, Furbank RT, Patrick JW. Nutrient loading of developing seeds. Functional Plant Biology. 2007;34:314–331. doi: 10.1071/FP06271. [DOI] [PubMed] [Google Scholar]
- Zinselmeier C, Lauer MJ, Boyer JS. Reversing drought-induced losses in grain yield: sucrose maintains embryo growth in maize. Crop Science. 1995a;35:1390–1400. [Google Scholar]
- Zinselmeier C, Westgate ME, Schussler JR, Jones RJ. Low water potential disrupts carbohydrate metabolism in maize (Zea mays L.) ovaries. Plant Physiology. 1995b;107:385–391. doi: 10.1104/pp.107.2.385. [DOI] [PMC free article] [PubMed] [Google Scholar]
- Zinselmeier C, Jeong B-R, Boyer JS. Starch and the control of kernel development in maize at low water potentials. Plant Physiology. 1999;121:25–35. doi: 10.1104/pp.121.1.25. [DOI] [PMC free article] [PubMed] [Google Scholar]


