Abstract
Ritonavir is a HIV protease inhibitor that also potently inactivates cytochrome P450 3A4 (CYP3A4), a major human drug-metabolizing enzyme. To better understand the mechanism of ligand binding and to find strategies for improvement of the inhibitory potency of ritonavir, currently administered to enhance pharmacokinetics of other anti-HIV drugs that are quickly metabolized by CYP3A4, we compared the manner of CYP3A4 interaction with the drug and two analogs lacking either the hemeligating thiazole nitrogen or the entire thiazole group. Based on the kinetic, mutagenesis and structural data, we conclude that: (i) the active site residue Arg212 assists binding of all investigated compounds and, thus, may play a more prominent role in metabolic transformation of xenobiotics than previously thought, (ii) peripheral binding of ritonavir limits the heme coordination rate and complicates the binding kinetics, (iii) association of ritonavir-like type II ligands is driven by heme coordination whereas hydrophobic forces define the binding mode, and (iv) substitution of one phenyl group in ritonavir with a smaller hydrophobic moiety could prevent steric clashing and, hence, increase the affinity and inhibitory potency of the drug.
Keywords: Cytochrome P450 3A4, Ritonavir analogs, Enzyme inhibition, Crystal structure
Introduction
Cytochrome P450 (CYP)1 enzymes are monooxygenases that participate in the metabolism of xenobiotics and synthesis of biologically important compounds such as steroids and fatty acids. In humans, cytochrome P450 3A4 (CYP3A4) is the major drug-metabolizing enzyme responsible for metabolic clearance of a large variety of prescribed therapeutics including antibiotics, immunosuppressants, and protease inhibitors. Some drugs can act as inhibitors of CYP3A4 and affect its ability to metabolize other compounds (reviewed in [1]). Such drug-drug interactions may be critical in vivo because CYP3A4 inactivators could significantly increase plasma levels of co-administered drugs which, in turn, could lead to serious adverse complications or, when the CYP3A4 inhibition is properly controlled, improve clinical efficacy of therapeutics.
One example of beneficial CYP3A4 inactivation is in the treatment of HIV infection [2]. The most potent CYP3A4 inactivator, ritonavir (Fig. 1A), is a peptidomimetic drug originally designed to inhibit a HIV protease [3]. Currently, ritonavir is administered as a booster for the enhancement of pharmacokinetics of other anti-HIV drugs that otherwise are quickly metabolized by CYP3A4. The inhibitory potency of a series of ritonavir analogs was tested on microsomal CYPs [2]. This helped to identify features critical for P450 binding and inactivation, such as (i) an unhindered thiazolyl nitrogen atom, through which the inhibitor binds to the heme iron; (ii) hydrophobic segments, providing interactions with the active site; and (iii) the ability to inhibit the P450 catalysis. Based on these findings, a number of structurally less complex and more soluble inhibitors of the CYP3A family of enzymes were designed [4–6].
Fig. 1.
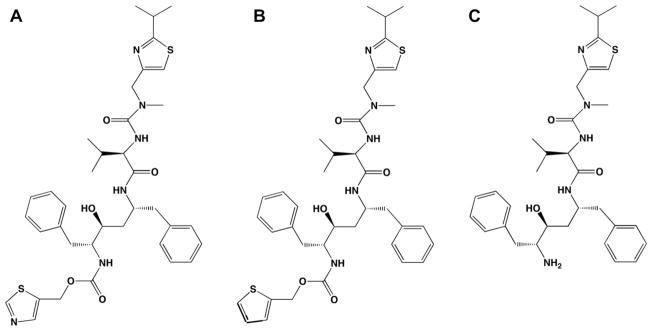
Structures of ritonavir (A), DAR (B), and DTMCR (C).
Our group investigated the CYP3A4-ritonavir interaction on a molecular level [7]. Based on the kinetics and equilibrium binding of ritonavir to recombinant human CYP3A4 as well as changes in the redox properties of the protein, we concluded that the drug is a high affinity type II ligand that inhibits CYP3A4 via strong ligation and lowering the redox potential of the heme which, in turn, precludes acceptance of electrons from the redox partner, cytochrome P450 reductase (CPR). In general, the azole compounds act as reversible and competitive CYP inhibitors that can dissociate from the protein or be replaced by stronger ligands. The ritonavir binding to CYP3A4, however, is essentially irreversible due to strong nitrogen coordination and near complementary protein–ligand contacts. The X-ray structure of the CYP3A4-ritonavir complex indicated that the drug potently inhibits CYP3A4 because it fits well into the active site cavity, establishes extensive hydrophobic interactions through its side chains, and is fully sequestered from solvent [7]. Thus, our previous work clarified the mechanism of ritonavir inhibition and provided a structural basis for designing drug molecules that specifically and more effectively target CYP3A4.
Although the major structural features required for potent CYP3A4 inhibition have been identified [2,7], the relative importance of non-bonded interactions provided by the side chain phenyls in ritonavir remain to be elucidated. Since other inhibitors that are not as potent as ritonavir also form a N–Fe bond, it is reasonable to hypothesize that non-bonded interactions significantly contribute to the tight binding of ritonavir-like compounds. To test this idea, we have studied the interaction of CYP3A4 with two ritonavir analogs: deaza-ritonavir (DAR, Fig. 1B) and desthiazolylmethyloxycarbonyl ritonavir (DTMCR, Fig. 1C). DAR is missing only the thiazole nitrogen that coordinates the iron atom, whereas DTMCR lacks the entire thiazole group with the remainder of the molecule the same as in ritonavir. Comparison of the binding abilities of ritonavir, DAR and DTMCR not only helped us to clarify the relative importance of heme coordination and non-bonded interactions during reaction with CYP3A4 but also suggested a strategy for further improvement of the affinity of ritonavir.
In addition, we have further explored the mechanism of CYP3A4 interaction with ritonavir in order to reconcile some previous puzzling results. For instance, it remained unclear why the CYP3A4-ritonavir binding reaction was biphasic and why there was a large difference between the equilibrium and kinetic dissociation constants (50 and 840 nM, respectively) [7]. Although some explanations were provided (e.g. an elongated shape of the ritonavir molecule and the ability of both thiazole and isopropyl-thiazole groups to enter the active site, P450–P450 interactions, and the possibility of peripheral ritonavir binding), further investigations were necessary to elucidate the precise mechanism. In this study, we reexamined the ritonavir binding kinetics using a wider range of the inhibitor:CYP3A4 ratios and analyzed the effect of the R212A mutation on the ritonavir and its analogs’ ligation to the heme. Our previous study indicated that the active site residue Arg212, part of the F–F′ loop, is actively involved in association of bromoergocryptine (BEC), a large and high-affinity substrate of CYP3A4 [8]. Therefore, it was of interest to test whether the modulating role of Arg212 is limited to BEC or more widespread.
Materials and methods
Protein expression and purification
His-tagged wild type (WT) and the R212A mutant of CYP 3A4Δ3-22 were produced in Escherichia coli and purified as previously described [7,8]. P450 concentration was determined according to Omura and Sato [9]. All CYP3A4 preparations used in the study had a A417/280 nm ratio >1.6.
Spectral binding titrations
Ligand binding to CYP3A4 was monitored spectrophotometrically. The WT and mutant hemoproteins were titrated with small aliquots of dimethyl sulfoxide solutions of DAR (Gilead Sciences), DTMCR or ritonavir (Toronto Research Chemicals) in 50 mM phosphate, pH 7.5, 20% glycerol, and 1 mM dithiothreitol (buffer A). The final solvent concentration did not exceed 1%. Spectral dissociation constants (Ks) were determined as described elsewhere [7].
Kinetics of ligand binding
Kinetics of ligand binding to CYP3A4 was monitored at room temperature in a SX.18MV stopped flow apparatus (Applied Photophysics, UK). Protein solutions (2–6 μM) were mixed with various concentrations of DAR, DTMCR or ritonavir in 50 mM phosphate, pH 7.5, and absorbance changes were followed at 417 or 426 nm. Owing to low solubility of ritonavir and its analogs in aqueous solutions, their maximal concentration before mixing was 36 μM. Kinetic data were analyzed using the program IgorPro (WaveMetrics, Inc).
Inhibitory potency assays
The inhibitory potency of DTMCR and ritonavir on the 7-benzyl-oxy-4-(trifluoromethyl)coumarin (BFC) hydroxylase activity of CYP3A4 was evaluated fluorimetrically in a reconstituted system with CPR. The reaction was carried out at room temperature in 25 mM phosphate buffer, pH 7.5, containing 3 mM MgCl2. CYP3A4 (0.4 μM final concentration) was incubated with the inhibitors for 5 min and then mixed with 0.8 μM rat CPR, 50 μM BFC, and 100 μM NADPH. Formation of 7-hydroxy-4-trifluoromethylcoumarin was followed in a Hitachi F100 fluorimeter with λex = 430 nm and λem = 500 nm. A concentration required for half-maximal inactivation (IC50) was derived from the [% activity] vs. [inhibitor] plots.
Crystallization and determination of the X-ray structure of the CYP3A4-DTMCR complex
DTMCR-bound CYP3A4 was crystallized by a microbatch method under oil. The DTMCR-bound protein (0.6 μl; 60 mg/ml) in buffer A, 100 mM NaCl and 1 mM EDTA was mixed with 0.6 μl of the crystallization solution containing 80 mM sodium malonate, pH 6.4, and 10% polyethylene glycol 3350, and covered with 10 μl of paraffin oil. Crystals appeared and grew at room temperature within a day. X-ray diffraction data were collected at the Stanford Synchrotron Radiation Laboratory beamline 7-1. Parotone-N was used as a cryoprotectant. The structure was solved to 2.25 Å resolution by molecular replacement using PHASER [10] and ritonavir-bound CYP3A4 (PDB ID code 3NXU) as a search model, and contained one molecule per asymmetric unit. The initial model was rebuilt and refined with COOT [11] and REFMAC [10] to R and Rfree of 23.1 and 29.7, respectively. In the final model, the N- and C-terminal fragments as well as residues 212–218, 263–266 and 281–288 are missing due to conformational disorder. Data collection and refinement statistics are summarized in Table 1. The atomic coordinates and structure factors have been deposited in the Protein Data Bank with the ID code 3TJS.
Table 1.
Data collection and refinement statistics.
| Data statistics | |
| Space group | I222 |
| Unit cell parameters | a = 79 Å, b = 99 Å, c = 125 Å α, β, γ = 90° |
| Resolution range | 38.4–2.25 (2.37–2.25)a |
| Total reflections | 150,202 |
| Unique reflections | 23,181 |
| Redundancy | 6.5 (6.3) |
| Completeness | 98.8 (99.7) |
| Average I/rI | 11.0 (3.2) |
| Rmerge | 0.074 (0.43) |
| Refinement statistics | |
| Molecules per asymmetric unit | 1 |
| R/Rfreeb | 23.1/29.7 |
| Average B-factor, Å2 | 39.7 |
| r.m.s. deviations | |
| Bond lengths, Å | 0.02 |
| Bond angles, ° | 1.9 |
Values in brackets are for the highest resolution shell.
Rfree was calculated from a subset of 5% of the data that were excluded during refinement.
Results
DAR induces type I spectral changes in CYP3A4
To determine how removal of the coordinating thiazole nitrogen in ritonavir affects interaction with CYP3A4, equilibrium titrations of the hemoprotein with DAR were performed. As seen from Fig. 2, addition of DAR causes a partial 416 to 395 nm absorbance shift (type I spectral changes), indicative of displacement of the distal water ligand and conversion of the heme iron to the high spin state (~44% at saturating DAR). The calculated spectral dissociation constant (Ks) was 0.51 ± 0.06 μM, which is an order of magnitude higher than that for ritonavir (Table 2). Thus, removal of the thiazole nitrogen converts ritonavir to a type I ligand that binds to CYP3A4 with a considerably lower affinity. Replacement of the active site residue Arg212 with alanine lowers both the binding affinity of DAR (Ks of 2.2 ± 0.2 μM) and the extent of the high spin shift (~28% at saturating DAR, Fig. 2).
Fig. 2.
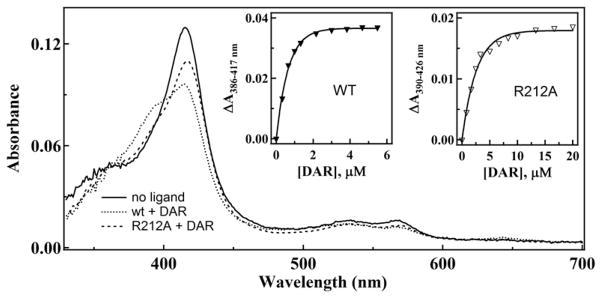
Spectra of ligand-free and DAR-bound WT and R212A CYP3A4. Absorbance spectra of 1.2 μM CYP3A4 were recorded in the absence and presence of 6 μM DAR. Insets a and b, plots of absorbance changes observed during equilibrium titrations of WT and R212A CYP3A4, respectively, vs. DAR concentration. Ks values derived from the plots are given in Table 2.
Table 2.
Equilibrium and kinetic parameters for the binding reaction of WT and R212A CYP3A4 with ritonavir and its analogs.
| DAR
|
DTMCR
|
Ritonavir
|
||||
|---|---|---|---|---|---|---|
| WT | R212A | WT | R212A | WT | R212A | |
| Ksa, μM | 0.5 ± 0.1 | 2.2 ± 0.2 | 3.6 ± 0.2 | 6.6 ± 0.4 | 0.05 ± 0.01b | 0.064 ± 0.008 |
| Kdc, μM | –d | – | 0.16 ± 0.04 | – | – | – |
| kfaste, s−1 | 0.29 ± 0.03 | 0.15 ± 0.02 | 1.0 ± 0.1 | 0.70 ± 0.03 | 1.4 ± 0.2 | 1.1 ± 0.2 |
| kslowf, s−1 | 0.07 ± 0.01 | 0.030 ± 0.002 | 0.13 ± 0.02 | 0.07 ± 0.01 | 0.19 ± 0.03 | 0.22 ± 0.02 |
Spectroscopic dissociation constant.
Determined previously [7].
Kinetic dissociation constants.
Kd cannot be determined because of non-hyperbolic binding kinetics.
Rate constants in the fast and slow phases, respectively, determined at a maximal ligand concentration (18 μM).
Kinetic measurements showed (Fig. 3) that the DAR-dependent spin conversion in CYP3A4 is biphasic, and the rate constant for the fast phase (kfast) decreases with an increase in DAR concentration (Fig. 3C). At sub-equimolar DAR concentrations, kfast was 4-fold higher than at saturating DAR. The rate constant for the slow phase (kslow), on the other hand, decreased until the DAR:CYP3A4 ratio reached ~1.5 and then increased to the initial level (Fig. 3D). The declining dependence of kfast on [DAR] suggests that there is a rate-limiting event that precedes heme ligation, and that this event becomes more dominant at high DAR concentrations.
Fig. 3.
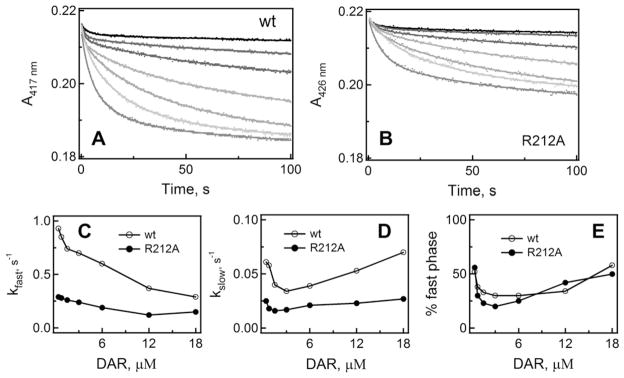
Kinetics of DAR binding to the WT and R212A mutant of CYP3A4. (A and B) interaction of 0.38, 0.75, 1.5, 3, 6, 12 and 18 μM DAR (top to bottom traces, respectively) with 1 μM CYP3A4 was monitored in a stopped flow spectrophotometer at 417 or 426 nm for the WT and the R212A mutant, respectively. The observed rate constants were calculated from biexponential fits to kinetic traces (solid lines) and plotted vs. DAR concentration (panels C and D). The rate constants for the fast (kfast) and slow (kslow) phases calculated at a maximal DAR concentration are given in Table 2.
For the R212A variant of CYP3A4, the DAR binding reaction was also biphasic but the amplitude of the absorbance change was 30% smaller, and kfast and kslow were 40–60% lower than the respective values for the WT (Fig. 3B–D). The general trend in the change of rate constants, however, remained the same. A substantial decrease in the amplitude and rates of spectral changes indicates that Arg212 plays an active role in DAR association. To determine the binding mode of DAR, we attempted to crystallize the CYP3A4-DAR complex. Unfortunately, although DAR promotes crystallization of CYP3A4, neither of the two crystal forms obtained had the ligand bound to the active site or anywhere else.
DTMCR is a type II ligand that binds to CYP3A4 70-fold weaker than ritonavir
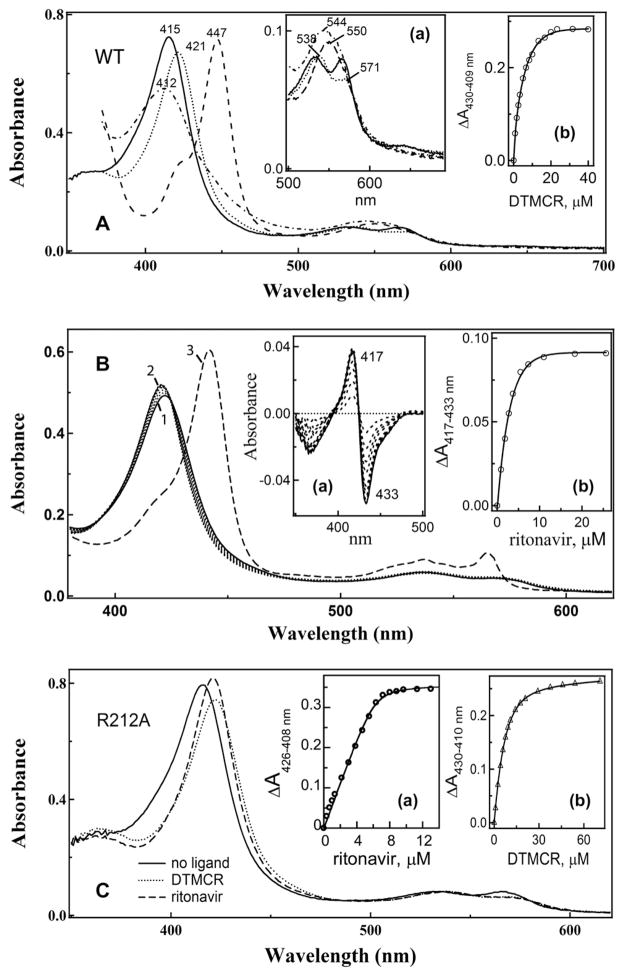
Although DTMCR lacks the entire thiazole head group, it still induces type II spectral changes in CYP3A4 (Fig. 4A). The red-shifted Soret and α-bands (421 and 538 nm, respectively) indicate that DTMCR directly coordinates to the heme iron via nitrogen. The reduced CYP3A4-DTMCR complex absorbs at 412 nm, which differs from the 442 nm absorption maximum of the ferrous ritonavir-bound species [7]. This dissimilarity and the lower amplitude of the 421 nm absorption peak of the oxidized CYP3A4-DTMCR complex suggest that the primary amine serves as a heme ligand.
Fig. 4.
DTMC-induced spectral changes in CYP3A4. (A) absorbance spectra of ferric ligand-free (___), DTMCR-bound (. . . ..), ferrous DTMCR-bound (-.-.-.), and ferrous CO-adduct (----) of CYP3A4. Inset a, a magnified view of the long wavelength region. Inset b, a plot of absorbance changes observed during titration of CYP3A4 vs. DTMCR concentration. (B) ritonavir can displace DTMCR from the active site of CYP3A4. DTMCR-bound CYP3A4 (5 μM, spectrum 1) was titrated with ritonavir until saturation (spectrum 2). To confirm that ritonavir replaces DTMCR as a heme ligand, at the end of titration the protein was reduced with sodium dithionite. Under these conditions, the ritonavir-bound form has an absorption maximum at 442 nm (spectrum 3) whereas the DTMCR-bound species absorb at 412 nm (panel A). Insets a and b, spectral changes observed during titration of DTMCR-bound CYP3A4 with ritonavir and a plot of absorbance changes vs. ritonavir concentration, respectively. (C) absorbance spectra of ligand-free, DTMCR- and ritonavir-bound CYP3A4 R212A. Insets a and b, plots of absorbance changes vs. ritonavir and DTMCR concentration, respectively. Ks values calculated from the plots in panels A–C are listed in Table 2.
Another distinctive feature is that DTMCR binds to CYP3A4 reversibly and 70-fold weaker than ritonavir (Table 2). DTMCR dissociates from CYP3A4 during repetitive dilution/concentration cycles and in the presence of ritonavir (Fig. 4B). A relatively high affinity of ritonavir for the CYP3A4-DTMCR complex (Ks of 0.43 ± 0.5 μM) indicates that the drug can effectively substitute not only type I [7] but also type II ligands. Finally, the equilibrium titration experiments showed that the R212A mutation only marginally affects the binding affinity of ritonavir but increases Ks for DTMCR by 2-fold (Fig. 4C, Table 2).
Differences in the ritonavir and DTMCR binding kinetics
Previously, ritonavir binding kinetics were investigated under conditions with the ligand:CYP3A4 ratios ≥ 1 [7]. To better understand the reasons for the biphasic character of the ritonavir ligation reaction and a large difference between the spectral and kinetic dissociation constants [7], we reexamined CYP3A4-ritonavir binding kinetics at a wider range of inhibitor concentrations to include both sub- and supra-equimolar ligand:protein ratios. This approach has proven to be useful for analyzing the manner of CYP3A4 interaction with high affinity ligands [8].
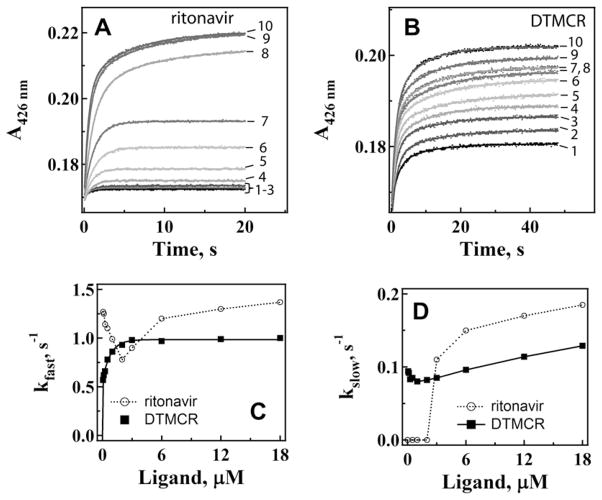
When CYP3A4 was present in excess, the ritonavir binding kinetics were monophasic and the reaction rate decelerated with an increase in ritonavir concentration until the inhibitor:CYP3A4 ratio reached unity (Fig. 5A,C, and D). After that, the reaction became biphasic and the rate constants for the fast and slow phases increased with increasing ritonavir concentrations. In sharp contrast, the DTMCR binding reaction was biphasic within the entire concentration range and the kfast vs. [DTMCR] dependence was hyperbolic (Fig. 5B,C, and D). kslow changed only slightly at low DTMCR concentrations and then gradually increased. The kfast and kslow values calculated at saturating DTMCR and ritonavir concentrations are compared in Table 2.
Fig. 5.
Kinetics of ritonavir (A) and DTMCR (B) binding to WT CYP3A4. Ligation of 0.067, 0.125, 0.25, 0.5, 1, 2, 4, 6, 12 and 18 μM inhibitors (traces 1–10, respectively) to 3 μM CYP3A4 was monitored in a stopped flow spectrophotometer at 426 nm. The observed rate constants were calculated from mono- or biexponential fits (solid lines) to kinetic traces and plotted vs. ligand concentration (panels C and D). The kfast and kslow values calculated at maximal ligand concentrations are given in Table 2.
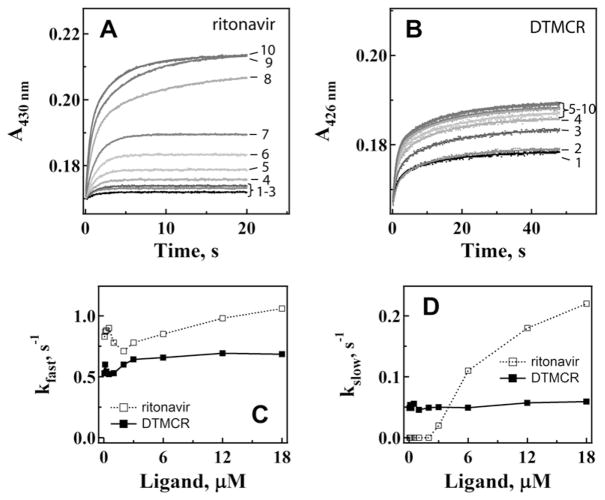
The R212A substitution had no significant effect on the amplitude of spectral changes induced by ritonavir or the shape of the kfast/slow vs. [ritonavir] plots (Fig. 6A,C, and D). However, the mutation decreased the limiting kfast value by ~20%, whereas kslow remained virtually unchanged (Table 2). In contrast, the amplitude of the DTMCR-induced spectral changes in CYP3A4 R212A was almost 2-fold lower than in WT (compare Figs. 5B and 6B). Furthermore, elimination of Arg212 led to a 30–50% decrease in the limiting kfast and kslow values (Table 2) and, most importantly, changed the kfast vs. [DTMCR] plot from hyperbolic to V-shaped (Fig. 6C). In accord with the titration experiments, this suggests that the R212A mutation lowers affinity and the manner of DTMCR binding to CYP3A4 but only weakly affects association of ritonavir.
Fig. 6.
Kinetics of ritonavir (A) and DTMCR (B) binding to CYP3A4 R212A. Ligation of 0.067, 0.125, 0.25, 0.5, 1, 2, 4, 6, 12 and 18 μM inhibitors (traces 1–10, respectively) to 3 μM CYP3A4 was monitored in a stopped flow spectrophotometer at 426 nm. The observed rate constants were calculated from mono- or biexponential fits (solid lines) to kinetic traces and plotted vs. ligand concentration (panels C and D). The kfast and kslow values calculated at maximal ligand concentrations are shown in Table 2.
Comparison of the inhibitory potency of ritonavir and DTMCR
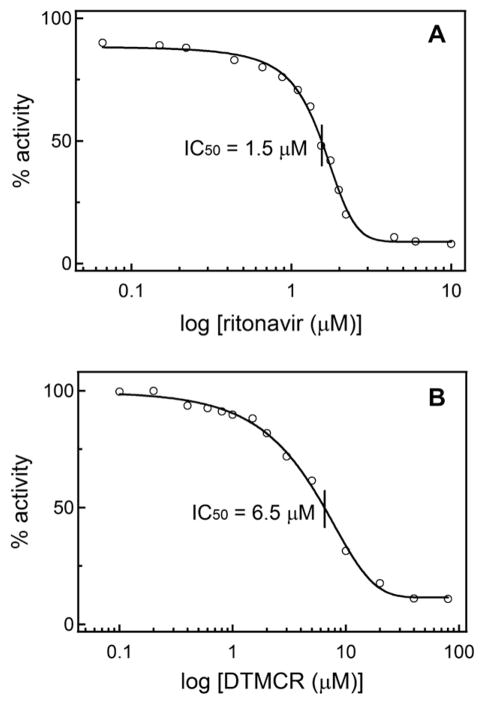
To relate the affinity of ritonavir and DTMCR to inhibitory potency, we determined how the two compounds affect the BFC hydroxylase activity of CYP3A4 in a reconstituted system with CPR. Formation of 7-hydroxy-4-(trifluoromethyl)coumarin was monitored fluoroscopically, and the percentage of the activity remained was plotted vs. ritonavir or DTMCR concentration. As seen from Fig. 7, the inhibitory potency (concentration required for half-maximal inactivation, IC50) correlates with the compounds’ affinity for CYP3A4. However, the difference in IC50 values was considerably smaller than the difference between the spectral dissociation constants (4- vs. 70-fold, Table 2). This was quite surprising because DTMCR lowers the redox potential of CYP3A4 to the same extent as ritonavir (from −330 to −350 mV) and, compared to the ritonavir-bound species, a larger portion of the DTMCR-bound CYP3A4 can be reduced by CPR (~5% vs. 40%, respectively). Some insights into the relatively high inhibitory ability of DTMCR were provided by the crystal structure of the CYP3A4-DTMCR complex.
Fig. 7.
Inhibitory potency of ritonavir (A) and DTMCR (B) on the BFC hydroxylase activity of CYP3A4. Experiments were conducted as described in the ‘‘Materials and methods’’ section. Concentrations required for half-maximal CYP3A4 inactivation (IC50) are indicated.
Crystal structure of the CYP3A4-DTMCR complex
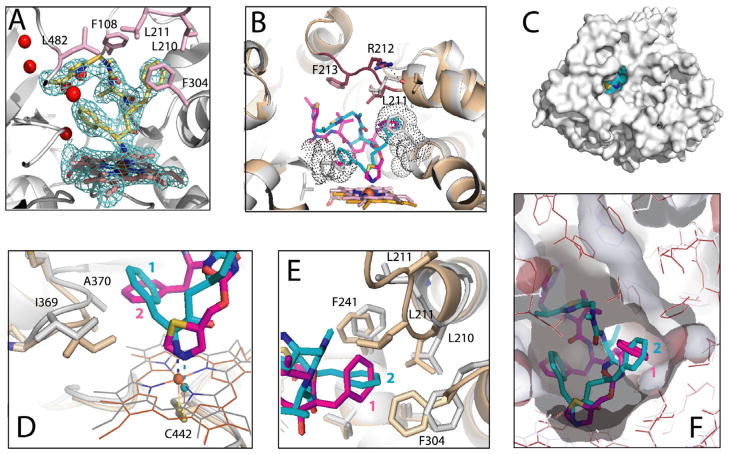
The X-ray structure of the DTMCR-bound CYP3A4 was solved to 2.25 Å resolution (Table 1) and was most similar to the ritonavir-bound structure (PDB ID 3NXU; Cα r.m.s.d. of 0.62 Å). The electron density for DTMCR was well-defined and allowed unambiguous fitting. As spectral data predicted, DTMCR is ligated to the heme via the amino group (Fig. 8A). The remainder of the inhibitor interacts with the protein quite differently than ritonavir. Being shorter, DTMCR occupies a smaller volume in the active site and establishes fewer hydrophobic and no specific polar contacts. Relative to ritonavir, DTMCR rotates by 180° in order to place the phenyl groups into hydrophobic pockets (Fig. 8B). The phenyl ring closest to the amino group (phenyl 1) is directed toward the 369–370 peptide but protrudes into the cavity ~2 Å less deep than phenyl 2 of ritonavir (Fig. 8D). This may weaken hydrophobic interactions but, because phenyl 1 of DTMCR is positioned further from Ala370, there is no steric clashing, and the 369–370 peptide and the heme plane are not displaced, as observed in the ritonavir-bound structure. As a result, the N-Fe bond in the CYP3A4-DTMCR complex is shorter (2.1 vs. 2.2–2.3 Å in 3NXU). Although the overall coordinate error (~0.3 Å for both structures) is similar to the difference in N–Fe bond length, the coordinating N and Fe atoms are very well defined and have the thermal (B) factors lower than average, so the slightly shorter N–Fe bond in DTMCR is very likely significant. This may partially compensate for the weakness of the amino group ligation and increase affinity. The second phenyl group of DTMCR is inserted into the hydrophobic pocket lined by Leu210, Phe241, Ile301 and Phe304 similar to phenyl 1 of ritonavir, and establishes the majority of non-bonded and hydrophobic contacts (Fig. 8E). However, phenyl 2 of DTMCR is oriented differently and is not engulfed by the surrounding residues as tightly as phenyl 1 of ritonavir (Fig. 8F). Lining the upper wall of the pocket Leu211, for example, is within the Van der Waals distance from phenyl 1 in the ritonavir-bound structure but positioned remotely in the DTMCR-bound CYP3A4 (Fig. 8E).
Fig. 8.
Crystal structure of the CYP3A4-DTMCR complex. (A) DTMCR (shown in yellow and stick representation) ligates to the heme iron via the primary amino group. 2Fo–Fc electron density for DTMCR is contoured at 1.0 σ. Residues involved in hydrophobic interactions with DTMCR are shown in pink and labeled. Red spheres are water molecules present in the active site. (B) Comparison of the DTMCR- and ritonavir-bound structures of CYP3A4 (shown in gray/cyan and beige/magenta, respectively). The 212–218 peptide is disordered in the CYP3A4-DTMCR complex but is well defined in the ritonavir-bound form (rendered in brown). A hydrogen bond between Arg212 and the carbonyl oxygen of Lys208 observed in the CYP3A4-ritonavir complex is indicated as a dashed line. DTMCR rotates by ~180° relative to ritonavir to place phenyl groups in hydrophobic pockets (depicted as dotted spheres). (C) Owing to disorder in the 212–218 peptide, the active site cavity in the CYP3A4-DTMCR complex is solvent accessible. DTMCR is shown in cyan and cpk representation. (D) Steric clashing between phenyl 2 of ritonavir and Ala370 causes displacement of the 369–370 peptide and the heme cofactor, which move downwards by 2.0 and 0.6 Å, respectively. As a result, the N–Fe bond in the CYP3A4-DTMCR complex is 01.–0.2 Å shorter than in the ritonavir-bound form). (E and F) Phenyl 2 of DTMCR forms the majority of hydrophobic interactions but is not engulfed by the surrounding residues as tightly as phenyl 1 of ritonavir. Semitransparent surface of the cavities in the DTMCR- and ritonavir-bound structures are colored in gray and dark red, respectively. (For interpretation of the references to colour in this figure legend, the reader is referred to the web version of this article.)
The main reason for a more open and solvated active site is that the isopropylthiazole group of DTMCR is too far from Glu374 to form a water-mediated hydrogen bond and, therefore, cannot participate in connecting to a cluster of charged residues that shield ritonavir from solvent [7]. Additionally, there are no hydrophobic contacts between DTMCR and Phe213 (Fig. 8B), which weakens interactions with the F–F′ loop. As a result, residues 212–218 become disordered and the C-terminal β-loop shifts aside by 2 Å, leaving the active site cavity open to the solvent (Fig. 8C and E). Thus, in accord with the biochemical findings, the structural data suggest that although DTMCR binds to CYP3A4 weaker than ritonavir, its overall affinity and inhibition potency may be elevated because of the ability to form a shorter N–Fe bond and anchor through phenyl moieties without spatial constraints. Owing to conformational disorder in the F–F′ loop, it was not possible to establish whether Arg212 plays any specific structural role in the DTMCR binding.
Discussion
Inactivation of drug-metabolizing CYP3A4 could lead to important clinical consequences such as drug–drug interactions and toxicity (reviewed in [12]) or, when properly controlled, may be beneficial as it can improve clinical efficacy of co-administered therapeutics. One area significantly affected by the metabolic transformations catalyzed by CYP3A4 is in the treatment of HIV infection. Our previous study provided the first functional and structural insights into the interaction of CYP3A4 with ritonavir [7], an HIV protease inhibitor routinely prescribed to enhance pharmacokinetics of other anti-HIV drugs.
This work was undertaken to further investigate the mechanism of CYP3A4 inhibition and, in particular, test the role of non-bonding interactions by comparing the binding manner of ritonavir and its two analogs. We also investigated whether interaction of CYP3A4 with the ritonavir-like molecules is modulated by Arg212. This active site residue is part of the F–F′ loop (residues 210–214), one of the substrate recognition regions, and undergoes a large conformational change during binding of bulky molecules such as ritonavir, ketoconazole and erythromycin [7,13]. In the ritonavir-bound CYP3A4, for instance, the 212–218 peptide is displaced from the active site but remains well-defined because its conformation is stabilized by a hydrogen bond formed between the guanidinium group of Arg212 and carbonyl oxygen of Lys208 (Fig. 8B). In contrast, only a minor rearrangement takes place during binding of the large BEC substrate molecule, where Arg212 occupies a different rotamer with no changes in the associated peptide backbone [8]. This seemingly insubstantial conformational change allows the tripeptide moiety of BEC to approach the heme atom and thereby defines the extent and rate of the high spin shift.
The present study once again confirms the notion on the remarkable adaptability of CYP3A4 [13–15], whose structurally flexible active site ‘‘molds’’ around exactly the same chemical groups in ritonavir and DTMCR by adopting different conformations.
Although the 212–218 peptide is disordered in the CYP3A4-DTMCR structure, elimination of Arg212 has a more pronounced effect on the binding of DTMCR than ritonavir. The overall kinetic changes caused by the R212A mutation are not very dramatic but, nevertheless, they are indicative of some mechanistic differences in the two type II ligands’ binding. Owing to the large size of ritonavir, it is highly unlikely that the active site of CYP3A4 can accommodate two or more molecules of the drug. The V-shaped kfast vs. [ritonavir] dependence, therefore, cannot be explained by the allosteric cooperative binding but may rather arise from the ability of ritonavir to bind outside the active site pocket. The existence of a peripheral substrate binding site in CYP3A4 was suggested based on the kinetics of spectral and fluorescent changes induced by BEC and fluorol-FGA [8,16,17], as well as the X-ray data showing that progesterone binds on the surface 17 Å away from the heme [18]. The progesterone molecule is hydrogen-bonded to Asp214 from the F–F′ loop and forms close contacts with the nearby Phe219 and Phe220, part of the phenylalanine cluster. The progesterone-binding site is thought to be functionally relevant and serve as an initial recognition site for the substrate or effector molecules [17,18]. Ritonavir may dock there as well and, when the site is saturated, translocates to the active site and interacts with the heme. Such a mechanism would contribute to the biphasicity of the reaction and explain the V-shaped kfast vs. [ritonavir] plot, breaking at near equimolar ritonavir:CYP3A4 ratios (Fig. 5C). The latter non-hyperbolic dependence may also explain a large difference between the spectral and kinetic dissociation constants reported previously (50 and 840 nM, respectively) [7], as the Kd value cannot be accurately estimated based on the kinetic data measured only at supra-equimolar ritonavir concentrations.
The typical hyperbolic dependence of kfast on [DTMCR] observed for WT CYP3A4, in turn, suggests that the shorter DTMCR molecule binds directly to the active site and that the thiazole group, missing in DTMCR, may promote association with the peripheral site. Further, since the R212A mutation transforms the aforementioned dependence to V-shaped (Fig. 6C), it can be concluded that Arg212 facilitates direct binding and ligation of DTMCR to the heme. Unlike the thiazole nitrogen, the primary amine in DTMCR is protonated at neutral pH and must be deprotonated prior to binding to the heme. Therefore, one way Arg212 could modulate DTMCR ligation is facilitation of its amino group deprotonation. This possibility would also explain why the mutational effect on kfast for the ritonavir binding is less pronounced. Alternatively, the flexible thiazole group might have better access and ligate to the heme with less interference from Arg212. Since, for the both type II ligands, elimination of Arg212 mostly perturbed kslow, the slow phase of the DTMCR and ritonavir binding reactions likely reflects the Arg212-dependent adjustments in the heme spin shift. Another important factor that could contribute to the biphasicity and complicate the overall ligand binding reaction is flexibility and conformational heterogeneity of the ritonavir-like molecules and CYP3A4 itself.
During DAR binding, a decrease in kfast was observed within the entire ligand concentration range (Fig. 3A), which cannot be solely explained by DAR association to a peripheral site. Another notable difference is that both rate constants for the DAR binding reaction were equally and most significantly affected by the R212A mutation (40–60% decrease; Table 2). It is unclear at the moment whether the terminal deaza-group interacts differently with the P450 surface or there are multiple peripheral binding sites and/or increasing interference between the DAR molecules. In either case, although Arg212 plays no significant role in the metabolism of small sterol compounds [19,20], this and the previous study on CYP3A4-BEC interaction [8] suggest that the active site arginine may be important for binding and catalytic transformation of large substrate molecules.
Unfortunately, it was not possible to co-crystallize CYP3A4 with DAR and compare the binding modes of the three compounds. Nonetheless, our study sheds light on the relative importance of heme coordination and non-bonded interactions. If non-bonded contacts dominate, then DAR would adopt a ritonavir-like conformation and establish the same non-bonded contacts but without heme coordination. We found just the opposite. DAR binds to CYP3A4 with a 10-fold lower affinity, only partially converts CYP3A4 to a high spin form, and does not remain in the active site during crystallization. A shorter DTMCR molecule, on the other hand, coordinates the heme with the amino group, which forces the remainder of the molecule to bind in a mode substantially different from that of ritonavir. These findings imply that heme coordination is a major driving force for the binding of ritonavir-like molecules.
The weaker association of DTMCR is undoubtedly due to a combination of a weaker nitrogen ligation, fewer specific active site residue interactions, less extensive non-bonded contacts, and a more solvated active site. Even so, the CYP3A4-DTMCR complex is still fairly tight (Ks = 3.6 μM). In part, this could result from the ability of DTMCR to establish nearly the same hydrophobic interactions via phenyl groups as ritonavir does. A 180° rotation enables DTMCR to place both phenyls into hydrophobic pockets, which stabilizes the conformation, optimizes the amino group position and strengthens the N–Fe bond. Thus, non-bonded interactions provided by the side chains of ritonavir-like molecules are important and could define the binding mode.
Although ritonavir fits well into the CYP3A4 active site and is fully shielded from solvent, its binding mode is not perfect and can be further improved. In particular, there is notable steric clashing between phenyl 2 and Ala370 (Fig. 8D), due to which the 369–370 peptide and the heme plane shift downwards by 2.0 and 0.6 Å, respectively. This conformational constraint and the heme movement affect the N–Fe bond, which is slightly longer than in the CYP3A4-DTMCR complex (by 0.1–0.2 Å). One way of improving ritonavir’s spatial fitting into the CYP3A4 active site would be substitution of its phenyl 2 with a smaller hydrophobic moiety. Elimination of close non-bonded contacts with Ala370 will enable formation of a tighter N-Fe bond and, hence, may further increase the ligand’s affinity and inhibitory potency.
In conclusion, comparison of the binding affinities and kinetics of ritonavir and its analogs’ ligation to the wild type and R212A mutant of CYP3A4, as well as structural determination of the DTMCR binding mode helped us to demonstrate the relative importance of non-bonded interactions and the modulating role of Arg212 during ligand binding, reconcile previous puzzling results, and suggest how the affinity and inhibition potency of ritonavir could be further increased.
Acknowledgments
This work was supported by National Institutes of Health Grant GM33688, Gilead Sciences, Inc. and the California Center for Antiviral Drug Discovery, and involves research carried out at the Stanford Synchrotron Radiation Laboratory, a national user facility operated by Stanford University on behalf of the US Department of Energy, Office of Basic Energy Sciences. The SSRL Structural Molecular Biology Program is supported by the Department of Energy, Office of Biological and Environmental Research, and by the National Institutes of Health, National Center for Research Resources, Biomedical Technology Program, and the National Institute of General Medical Sciences.
Role of the funding sources
The contents of this manuscript do not represent the views of the United States Government, Gilead Sciences, Inc. or the California Center for Antiviral Drug Discovery.
Footnotes
Abbreviations used: CYP, cytochrome P450; CYP3A4, 3A4 isoform of cytochrome P450; CPR, cytochrome P450 reductase; DAR, deaza-ritonavir; DTMCR, desthiazolylmethyloxycarbonyl ritonavir; WT, wild type; BEC, bromoergocryptine.
Disclosure statement
The authors declare no actual or potential conflict of interests including any financial, personal or other relationships with other people or organizations within 3 years of beginning the work submitted that could inappropriately influence our work.
References
- 1.Zhou S, Chan E, Lim LY, Boelsterli UA, Li SC, Wang J, Zhang Q, Huang M, Xu A. Curr Drug Metab. 2004;5:415–442. doi: 10.2174/1389200043335450. [DOI] [PubMed] [Google Scholar]
- 2.Kempf DJ, Marsh KC, Kumar G, Rodrigues AD, Denissen JF, McDonald E, Kukulka MJ, Hsu A, Granneman GR, Baroldi PA, Sun E, Pizzuti D, Plattner JJ, Norbeck DW, Leonard JM. Antimicrob Agents Chemother. 1997;41:654–660. doi: 10.1128/aac.41.3.654. [DOI] [PMC free article] [PubMed] [Google Scholar]
- 3.Kempf DJ, Marsh KC, Denissen JF, McDonald E, Vasavanonda S, Flentge CA, Green BE, Fino L, Park CH, Kong XP, et al. Proc Natl Acad Sci USA. 1995;92:2484–2488. doi: 10.1073/pnas.92.7.2484. [DOI] [PMC free article] [PubMed] [Google Scholar]
- 4.Flentge CA, Randolph JT, Huang PP, Klein LL, Marsh KC, Harlan JE, Kempf DJ. Bioorg Med Chem Lett. 2009;19:5444–5448. doi: 10.1016/j.bmcl.2009.07.118. [DOI] [PubMed] [Google Scholar]
- 5.Xu L, Desai MC. Curr Opin Invest Drugs. 2009;10:775–786. [PubMed] [Google Scholar]
- 6.Xu L, Liu H, Murray B, Callebaut C, Lee MS, Hong A, Strickley RG, Tsai LK, Stray KM, Wang Y, Rhodes GR, Desai MC. ACS Med Chem Lett. 2010;1:209–213. doi: 10.1021/ml1000257. [DOI] [PMC free article] [PubMed] [Google Scholar]
- 7.Sevrioukova IF, Poulos TL. Proc Natl Acad Sci USA. 2010;107:18422–18427. doi: 10.1073/pnas.1010693107. [DOI] [PMC free article] [PubMed] [Google Scholar]
- 8.Sevrioukova IF, Poulos TL. J Biol Chem. 2012;287:3510–3517. doi: 10.1074/jbc.M111.317081. [DOI] [PMC free article] [PubMed] [Google Scholar]
- 9.Omura T, Sato R. J Biol Chem. 1964;239:2379–2385. [PubMed] [Google Scholar]
- 10.CCP4. Acta Crystallogr Section D. 1994;50:760–763. doi: 10.1107/S0907444994003112. [DOI] [PubMed] [Google Scholar]
- 11.Emsley P, Cowtan K. Acta Crystallogr Section D. 2004;60:2126–2132. doi: 10.1107/S0907444904019158. [DOI] [PubMed] [Google Scholar]
- 12.Zhou SF. Curr Pharm Des. 2008;14:990–1000. doi: 10.2174/138161208784139738. [DOI] [PubMed] [Google Scholar]
- 13.Ekroos M, Sjogren T. Proc Natl Acad Sci USA. 2006;103:13682–13687. doi: 10.1073/pnas.0603236103. [DOI] [PMC free article] [PubMed] [Google Scholar]
- 14.Scott EE, Halpert JR. Trends Biochem Sci. 2005;30:5–7. doi: 10.1016/j.tibs.2004.11.004. [DOI] [PubMed] [Google Scholar]
- 15.Ohkura K, Kawaguchi Y, Watanabe Y, Masubuchi Y, Shinohara Y, Hori H. Anticancer Res. 2009;29:935–942. [PubMed] [Google Scholar]
- 16.Isin EM, Guengerich FP. J Biol Chem. 2006;281:9127–9136. doi: 10.1074/jbc.M511375200. [DOI] [PubMed] [Google Scholar]
- 17.Davydov DR, Rumfeld JAO, Sineva EV, Fernando H, Davydova NY, Halpert JR. J Biol Chem. 2012;287:6797–6809. doi: 10.1074/jbc.M111.325654. [DOI] [PMC free article] [PubMed] [Google Scholar]
- 18.Williams PA, Cosme J, Vinkovic DM, Ward A, Angove HC, Day PJ, Vonrhein C, Tickle IJ, Jhoti H. Science. 2004;305:683–686. doi: 10.1126/science.1099736. [DOI] [PubMed] [Google Scholar]
- 19.Harlow GR, Halpert JR. J Biol Chem. 1997;272:5396–5402. doi: 10.1074/jbc.272.9.5396. [DOI] [PubMed] [Google Scholar]
- 20.Harlow GR, Halpert JR. Proc Natl Acad Sci USA. 1998;95:6636–6641. doi: 10.1073/pnas.95.12.6636. [DOI] [PMC free article] [PubMed] [Google Scholar]


