

Abstract
Policy makers in developing countries need to assess how public health programmes function across both public and private sectors. We propose an evaluation framework to assist in simultaneously tracking performance on efficiency, quality and access by the poor in family planning services. We apply this framework to field data from family planning programmes in Ethiopia and Pakistan, comparing (1) independent private sector providers; (2) social franchises of private providers; (3) non-government organization (NGO) providers; and (4) government providers on these three factors. Franchised private clinics have higher quality than non-franchised private clinics in both countries. In Pakistan, the costs per client and the proportion of poorest clients showed no differences between franchised and non-franchised private clinics, whereas in Ethiopia, franchised clinics had higher costs and fewer clients from the poorest quintile. Our results highlight that there are trade-offs between access, cost and quality of care that must be balanced as competing priorities. The relative programme performance of various service arrangements on each metric will be context specific.
Keywords: Franchise, private sector, reproductive health, family planning, Ethiopia, Pakistan, equity, quality
KEY MESSAGES.
We present a framework and graphical tool for family planning programme evaluation.
A balanced approach to programme evaluation accounts for programme quality, equity of service provision and efficiency.
Franchised systems of private family planning providers were found to greatly improve the quality of care in family planning in both Pakistan and Ethiopia. Effects on access varied between the countries.
Introduction
Family planning services in low-income settings are provided through a variety of outlets involving various private venues and government posts. In order to improve services, policy makers need to assess how each of these outlets performs. Policy makers have traditionally invested more heavily in public options, but recently there has been a growing recognition that well-placed investments in private provider networks can have practical advantages. The private sector is already in place and widely used by both rich and poor. If there are strategies that can efficiently improve the performance of the private sector in guarding service quality and improving access for disadvantaged groups, then these approaches may offer a practical alternative to focusing solely on improving public sector facilities. If a score could be kept of how various institutions perform across an array of public objectives, then resources could be devoted towards the service delivery platform that offered the best return on investment across multiple objectives. Better ways to measure multiple desired outcomes, including quality, access for the poor and efficiency, would be important for appropriate distribution of public resources and programme evaluation. This paper proposes a method of multi-pronged programme evaluation demonstrated with applications to public and private family planning clinics in Ethiopia and Pakistan.
Background
Family planning programmes in developing countries have achieved great success in lowering barriers to services and improving the survival and health of children and mothers. However, there are still over 100 million women in the developing world who want to avoid or postpone childbearing but are not using any family planning method (Ross 1995; Population Reference Bureau 2002). These women are considered to have ‘unmet need’ for family planning. Estimates of unmet need from 58 developing countries found that in 12 countries, total unmet need exceeds 30% among married women, and in a further 19 countries, it exceeds 20% (Westoff 2006). Additionally, disparities exist among different population groups indicating inequitable access to family planning services.
The socio-economic inequality associated with family planning is profound. An analysis of unwanted fertility by Gillespie et al. found persistent inequities in access to family planning services and modern contraceptive use by wealth quintile: the poorest women have less access and use family planning services less than wealthier women (Gillespie et al. 2007). Gakidou and Vayena examined Demographic and Health Survey (DHS) data from 55 developing countries and found countries with large economic inequalities also have large inequities in modern contraceptive use (Gakidou and Vayena 2007). Disparities in access to family planning are also associated with other socio-economic characteristics such as rural residence, education, religion and racial groups (Devi 1996; Ashford 2003).
The quality of family planning is a major barrier for women who would otherwise seek these services. Concerns frequently raised by women include providers who lack knowledge of contraception, low availability of a variety of contraceptive methods and provider unresponsiveness to women's questions about health concerns (Bruce 1994; Bhushan 1997; Sedgh et al. 2007). These barriers could be mitigated by capital investments and by training workers to provide better services, i.e. appropriate counselling given to clients, greater method choice and improved technical competence of health professionals. Studies in Bangladesh, Tanzania and Peru reported a significant positive relationship between quality of family planning services and use of contraceptives (Mensch et al. 1996; Koenig et al. 1997; Arends-Kuenning and Kessy 2007). Conversely, an analysis of data from 15 countries found that within a year of starting use of a method, between 7–27% of women cease to practise contraception for reasons related to the quality of the service environment (Blanc et al. 2002).
Given the consensus on the importance of quality of care in family planning delivery, it is essential to assess the quality of family planning services with reliable measurements. One approach to assessing quality is Donabedian's three-dimension quality framework, which distinguishes structure, process and outcome to assess the quality care (Donabedian 1988). Judith Bruce's quality framework is specific to family planning, focusing on the actual process of service provision instead of service output, and highlighting client perspectives and experiences (Strobino et al. 2000). Bruce's framework consists of six elements: choice of methods, provision of information to clients, technical competence of providers, provider–client interpersonal relations, mechanisms for encouraging continuity and follow up, and appropriate constellation of services (Bruce 1990). Based upon this framework, a list of quality indicators reflecting each dimension was developed by the EVALUATION Project working group (Bertrand et al. 1994). Assessment of indicators requires client recall and administrative data, but does not rely on direct observation or patient re-assessment.
An essential component of assessing the provision of family planning/reproductive health services is its efficiency. From a health systems standpoint, efficiency is increased when more service is provided for every dollar spent. Measuring efficiency typically involves dividing dollars spent by a measurement of the outcomes achieved with these dollars. Various denominators have been used for standardization, including couple years of protection (CYP), number of births averted and number of clients served (Cakir et al. 1996; Barberis and Harvey 1997; Routh and Barkat-e-Khuda 2000). CYP has been a favourite of family planning/reproductive health practitioners, however CYP costs are not comparable across other interventions in the health sector, nor do they value benefits received by a woman who may seek non-contraceptive reproductive health services from a facility. In this study, the denominator used for standardization is number of clients served.
Cost of care is positively related to both quality of services and access to them by the poor, as increasing either quality or social equity can lead to increased cost (Bishai et al. 2008a). For example, a highly successful door-to-door community-based maternal and child health programme in Bangladesh offered exceptional social equity, but due to its high cost, the programme was judged unsustainable (Routh and Barkat-e-Khuda 2000). Costs of delivery can generally be reduced when delivery sites are fixed, however fixed sites can reduce access for remote populations (Levin et al. 2001).
The tradeoff between quality and cost is even more complex. Some studies have suggested that even though the cost of quality improvements may be passed on to the client, contraceptive use rises with greater method choice and improvements in quality (Mroz et al. 1999). Furthermore, the net effect of quality improvements, increased facility costs and increased client charges may be financially beneficial for facilities—the impact of quality improvements on volume is great (Matheny 2004). To date, very few studies have examined the relationship of increasing family planning access or service quality on the cost to the facility, choosing instead to focus on the relationship to client burden (see for example Schuler et al. 2002). As developing country governments shoulder a greater proportion of the burden of family planning/reproductive health service costs, understanding the relationship between cost, quality and appropriate access to services will be crucial to meeting the family planning needs of their citizens.
While other studies have measured cost, quality and access in health services, they are seldom measured together. An exception is the balanced scorecard methodology set forth by Kaplan and Norton which was translated for health sector use by Peters et al. in Afghanistan (Kaplan and Norton 1996; Peters et al. 2007). The balanced scorecard system is intended to provide an overall assessment of a health facility or group of facilities, as well as comparison across facilities on individual indicators. The scorecard requires extensive information. Programme evaluation based on multiple indicators has typically examined each indicator separately, and the relationships between indicators as well as their relative importance have been unclear.
We present a new framework and graphical tool for evaluating health services. Our example focuses on family planning services, for which there is continued unmet need; however, applications to other service domains are easily envisioned. The two examples use data from Ethiopia and Pakistan, and compare four different types of facilities: government, private non-franchised, private-franchised and non-profit.
Conceptual framework
The conceptual framework for our programme evaluation focuses on balancing costs, quality and access. The perspective is that of a public sector decision-maker who must attend to costs as a public steward. A public sector perspective also narrows the focus of concern to those aspects of the health system where private markets fail, chiefly in guaranteeing quality and access for vulnerable groups. In the absence of public oversight, private providers have insufficient incentives to maintain quality services or serve the poor. These market failures in health care occur because of asymmetric information between patients and providers (Arrow 1963).
Since cost, quality and access all matter in public stewardship, a policy maker must achieve a balance among these goals. We envision the need for balance between policy objectives as similar to balancing the legs of a three-legged stool.
Figure 1.

Three-legged stool, representing the balance among three essential components of programme evaluation in our framework
Methods
Data
The study used the data collected in a franchising impact evaluation project—Alternative Business Models (ABM)—conducted by the Carolina Population Center (CPC). The CPC-ABM study was originally designed to evaluate the impact of social franchising models to promote family planning in three countries: Pakistan, Ethiopia and India. For the most comparable data analysis, we focused on Pakistan and Ethiopia only.
The Pakistani franchise, Green Star, was launched in 1997 by Social Marketing Pakistan and concentrated in urban areas. The purpose of Green Star was to improve the access, quality and sustainability of the family planning services. Green Star clinics agree to deliver high-quality service at an affordable price to low-income populations and pay a nominal franchise fee. The franchiser, SMP, in return provided quality contraceptive products to clinics in the network at wholesale prices. At the time of the study in 2004, the network covered 11 000 health providers, offering an estimated 20% of total CYP for the country (Stephenson et al. 2004).
In Ethiopia, the private franchise network, Biruh Tesfa (or ‘Ray of Hope’), was supported by Pathfinder International, present in Ethiopia since 2000. Service providers including clinics, community health agents, birth attendants and market or workplace-based health providers in three regions (Addis Ababa, Oromia and Amhara) were recruited to participate in training on service delivery (i.e. family planning, sexually transmitted disease prevention, HIV/AIDS counselling and post-abortion care as well as referral procedures) and facility management (i.e. financial management, procurement supports and supervision).
Two waves of data collection were carried out in 2001 and 2004 using similar sampling strategies and standardized questionnaires to allow comparability of the data. Multistage cluster sampling was used to select health facilities, their health staff and clients in each country. In Pakistan, the 2001 baseline survey first drew a sample of cities with Green Star programmes using probability proportional to size (PPS). In the second step, a systematic sample of facilities was selected within sampled cities. Four types of facilities: governmental, non-governmental (NGO), private non-franchising and private franchising were included. Within each clinic, all family planning staff were interviewed if present and eight clients per clinic presenting on the day of the facility survey were selected systemically after random start (Stephenson et al. 2004).
In Ethiopia, the sample design was different between Addis Ababa and the other two regions. In Addis, all network facilities were first stratified into hospital, health centre, clinic and pharmacy, and then randomly sampled. In the other two regions, all hospitals in main zonal areas were selected. Two other major towns close to the main zonal town were selected and all health facilities were sampled to reach a target sample size. In all three regions, staff and clients were sampled with similar selection procedures as those in Pakistan but with only four clients per facility.
A social franchise uses a co-ordinating agency (e.g. Green Star or Biruh Tesfa) to form partnerships with individual private providers, monitor aspects of their performance, and offer assistance in the form of training, supervision or branding. Private non-franchised providers included in this study are formal facilities providing allopathic treatment and/or family planning, such as a hospital, clinic or chemist shop.
Three types of questionnaires were administered in the survey: health facility, provider and client exit questionnaires. The facility questionnaire collected information on service provision and franchise participation. The provider questionnaire focused on training experience, quality and referral. The client exit questionnaire gathered information on clients' service-receiving experience, satisfaction with services and knowledge on franchising participation. Data from the two survey rounds were pooled for these analyses.
Measurements of quality of care
Bruce's six-domain quality framework guided the compilation of quality variables from three sources of data: clients, health providers and health facilities. For each country, we examined the potential quality variables for consistency, skipping patterns and missingness. Some variables were grouped into indices. For example, clients were asked if the health provider presented any of a series of family planning methods. This was aggregated into a new variable describing the total number of methods discussed. As the final analysis is health facility based, client and provider data were collapsed such that within each facility, we created one mean value for each quality indicator. Finally, variables were entered into a factor analysis to find a parsimonious indicator of quality requiring fewer than the 13–19 possible quality variables gathered in the survey.
Strict rules were used in our factor analytic models to determine which variables to include in the quality scale. All variables were entered into a principal components model, and the resulting eigenvalues were graphed. We decided the number of factors based on this scree plot, selecting items with eigenvalues >1. We then iteratively conducted factor analysis using a maximum likelihood method with varimax rotation, excluding variables with a uniqueness greater than 0.80, and assigning variables to a factor when loading exceeded 0.40.
Six quality domains were defined in Ethiopia and five in Pakistan. These were provider training in abortion, choice of methods, information given to the clients, client satisfaction, range of services provided and, in Ethiopia, technical competence of providers. Cronbach's alpha was also examined within each factor to check the reliability of measurements. A quality index was generated for each domain, by summing the inclusion variables. These indices were assessed by ANOVA to verify that no statistical differences existed based upon the year data were collected, allowing us to include all facilities in which providers and clients were interviewed.
Finally, one overall quality variable was created for each country by adding up the scores for all six quality domains assuming equal weights for each domain. The decision to weight each domain equally was taken after conducting a series of three expert consultations with groups of international family planning professionals. These professionals were gathered at Johns Hopkins School of Public Health for a series of mid-career workshops and their experience level ranged from former national directors of family planning to clinical specialists in family planning. They were asked how they would allocate a fixed sum of US$5000 across improving each of the six domains. We tallied the amount allocated as an indicator of the relative weight of each domain for the decision maker. In three separate groups, three different weighting schemes were derived. We concluded that different national backgrounds and cadres of experience would alter the relative priority of the different domains of quality. Since no consistent weighting scheme for the six domains could be derived empirically, we chose to treat each domain as equal.
Cost of care
Facility cost comprised total salary and facility rent. Commodity costs were not included. Total salary was determined by the reported salary level of each employee position, and the number of full-time equivalents occupying that position. Missing salary levels were imputed using the average salary level, by facility type, for each position (i.e. clerk, general practitioner, pharmacist). Seven per cent of salary data in Ethiopia and 25% in Pakistan were missing and replaced by imputed values. Facility rent was reported as actual rent, or market value if the facility did not pay rent. Missing values of rent were imputed by performing a linear regression of the natural log of rent on physical facility area and facility type, and taking the anti-log of the predicted values. Because not every respondent was knowledgeable about local rental prices, 38% of rent costs in Ethiopia and 9% in Pakistan were missing. We conducted statistical real estate appraisal by predicting missing rental costs based on available data from the facility on square footage and location. The time horizon for cost is one year. All costs are reported in their respective national currencies as of 2004. Costs were not converted to international currencies because the goal is intra-national, not international comparisons of facility types.
Poverty
In Ethiopia, clients were asked about the household possession of TV, radio, sewing machine, bike, car and animals. A wealth index was computed by using the first principal component analysis to assign weights to each of these asset indicators (Filmer and Pritchett 2001). In Pakistan, there was no information about the household assets; we relied on reported household monthly income to measure poverty. Participants reported their family income in several categories from Rs. 3000 or less to Rs. 30 000 or more. Quintiles of the asset principal component in Ethiopia or monthly income in Pakistan were used to measure the relative economic status of family planning clients at each facility.
Three measures tracked at each facility
For each type of facility (franchise, government, private non-franchise and non-profit), three variables were defined. The efficiency of a facility type was calculated as the total number of clients seen divided by the total cost of care. The accessibility to the poor of each facility type was calculated as the proportion of clients, at each facility type, which come from the poorest quintile. A facility that had more than 20% of its clients from the poorest quintile would be better than average. Average quality for the facility type was determined by summing the values of the six domains of quality for each facility, and dividing by the number of facilities. Finally, the facility type value for each of the three variables was normalized against the mean.
Analysis
Total cost per client and family planning cost per family planning client were compared between franchised clinics and the other three clinic types using Wilcoxon rank-sum tests. The Wilcoxon test examines the hypothesis of equal medians and is appropriate for data with skewed distributions such as cost data. The proportion of clients in the poorest quintile was compared between franchises and the other three clinic types using Z-tests of proportions. Finally, the total quality score was compared between franchised clinics and the other three clinic types using t-tests. Standard errors in all three tests for significance adjusted for non-independence within the sample due to facilities surveyed in both rounds of data collection.
Results
Table 1 shows a descriptive summary of the data used in the analysis. Results from 2352 facility-years, 3441 provider-years and 16 920 clients informed our analyses. Table 2 summarizes the results of the balanced evaluation of the different approaches to family planning. It reports the mean score for total quality, number of total and family planning clients served per dollar, and access for the poor by country and facility type. Rank sum tests showed that in Ethiopia, franchised private clinics’ cost per client was statistically significantly higher than for all other facility types, whereas franchised private clinics’ cost was not significantly different than private or government facilities in Pakistan. Meanwhile, for Ethiopian clinics access for the poor was significantly higher for government and private clinics compared with franchised facilities. Comparing total quality of care in Ethiopia and Pakistan showed that private franchised clinics had statistically significantly higher quality of care than private independent clinics.
Table 1.
Data informing radar diagrams
| 2001 |
2004 |
|||||
|---|---|---|---|---|---|---|
| Facility type | Facilities | Providers | Clients | Facilities | Providers | Clients |
| Ethiopia | ||||||
| Franchise | 37 | 64 | 170 | 102 | 116 | 467 |
| Government | 78 | 143 | 310 | 88 | 108 | 435 |
| Private | 213 | 263 | 847 | 214 | 222 | 1004 |
| NGO | 18 | 26 | 72 | 19 | 22 | 95 |
| Total | 346 | 496 | 1399 | 423 | 468 | 2001 |
| Pakistan | ||||||
| Franchise | 398 | 571 | 3010 | 372 | 599 | 3585 |
| Government | 136 | 251 | 1019 | 131 | 302 | 1361 |
| Private | 194 | 234 | 1442 | 216 | 323 | 2106 |
| NGO | 25 | 39 | 197 | 111 | 158 | 800 |
| Total | 753 | 1095 | 5668 | 830 | 1382 | 7852 |
| Total | 1099 | 1591 | 7067 | 1253 | 1850 | 9853 |
Table 2.
Summary of equity, access and quality results
| Facility type | Cost/FP client Median (IQR)a | Cost/clients Median (IQR)a | Access to poor (95% CI)b | Total quality (SD)c | |
|---|---|---|---|---|---|
| Ethiopia | |||||
| Franchise | 58 (16–190) | 13 (4–31) | 15.2 (11.1–19.4) | 37.9 (17) | |
| Government | 29 (13–60)*** | 7 (4–14)*** | 29.8 (24.6–35.0)*** | 43 (19.3)** | |
| Private | 31 (12–84)*** | 5 (2–16)*** | 20.3 (17.9–22.8)** | 22.8 (16.3)*** | |
| NGO | 23 (7–56)*** | 5 (1–15)** | 16.2 (9.0–23.3) | 43.2 (20.1) | |
| Pakistan | |||||
| Franchise | 229 (88–601) | 31 (16–75) | 20.1 (18.2–22.1) | 23.5 (11.3) | |
| Government | 72 (35–174)*** | 39 (20–74) | 31.0 (26.9–35.2)*** | 26.1 (8.3)*** | |
| Private | 445 (138–1295)*** | 30 (15–76) | 21.5 (19.0–24.1) | 15.1 (9.4)*** | |
| NGO | 238 (94–646) | 24 (12–48)** | 23.7 (19.0–28.3) | 16.8 (10.1)*** | |
Notes:
aCosts for Ethiopia and Pakistan reported in Birr and Rupees, respectively, circa 2004. Wilcoxon rank-sum tests for equality of medians applied to cost data. Results shown as *P < 0.10, **P < 0.05, ***P < 0.01.
bZ-tests for proportions applied to compare percentage of clients in each facility type in lowest economic quintile in franchise (Reference category) to government, private and NGO. Results shown as *P < 0.10, **P < 0.05, ***P < 0.01.
ct-tests applied to compare total quality score in franchise (Reference category) to government, private and NGO. Results shown as *P < 0.10, **P < 0.05, ***P < 0.01.
In Figures 2 and 3, a radar diagram represents each type of facility. Different types of facilities are plotted together in order to ease comparison. On each axis, 1 represents the mean value for all facilities.
Figure 2.
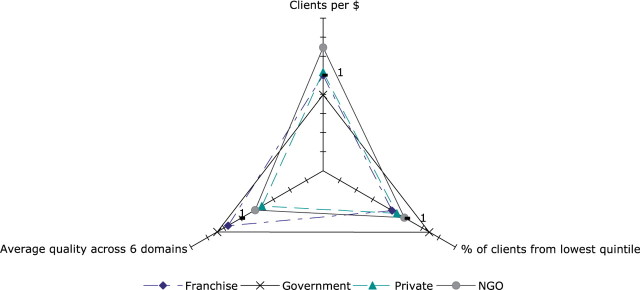
Radar graph for evaluating family planning services in Pakistan
Figure 3.
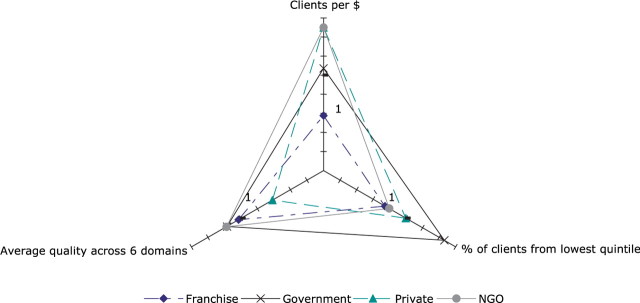
Radar graph for evaluating family planning services in Ethiopia
In Pakistan, the highest quality for family planning provision (Figure 2, leftward axis) is obtained by government and franchise facilities. Pakistani NGO facilities are the most efficient and able to serve the most clients per dollar. Government and NGO facilities are the most equitable, with greater percentages of their clients being drawn from the poor compared with private or franchise facilities. Private non-franchised facilities provide poorer service quality than all other facility types.
In Ethiopia, private facilities again demonstrate the poorest quality (Figure 3, leftward axis), but are highly efficient, as are the NGO facilities. Private and NGO facilities’ efficiency is more than double that of the franchise facilities, and better than the government facilities. The highest quality care is attained by NGO and government facilities, while the greatest access for poor clients is provided by government facilities.
As seen in Figures 2 and 3, government provision of family planning services offers a balance of good quality and accessibility by the poor. If government facilities in Pakistan were able to increase their efficiency by seeing more patients per dollar, government would be the superior service provider in our analyses. Similarly, and perhaps more realistically, if NGO service providers in Ethiopia were able to increase their access by the poorest economic group, they would become the superior service provider.
Franchised facilities in Pakistan are not significantly different from other private providers with regard to efficiency or access by the poor, but they are significantly worse than private non-franchised on these two measures in Ethiopia. Quality of care is significantly higher for franchised facilities in comparison with other private providers in both countries.
Discussion
Franchised private facilities are more costly per client served than private non-franchised clinics in Ethiopia, but not in Pakistan. In Ethiopia, franchised private clinics saw fewer patients from the bottom economic quintile compared with non-franchised private clinics, whereas in Pakistan franchised clinics saw the same proportion of patients from the bottom quintile. Some of the difference in cost and access by the poor could be due to selective enrolment of private clinics into franchised arrangements, and some of the difference could be due to differences in the client mix and clinical processes of care induced by franchising. Franchised private clinics had higher quality scores than private non-franchised clinics in both Ethiopia and Pakistan. Franchise agreements often mandate training, and franchisors are subject to inspections from the umbrella entity, which could be an important factor in their high quality scores. Producing higher quality services often comes at a cost (Bishai et al. 2008a). In contrast, private facilities may not be subject to any quality regulation at all, which could explain the low quality score in both Ethiopia and Pakistan. The difference in quality of services provided between private and franchise facilities is particularly notable due to the nature of the input data. The quality score included a customer satisfaction component, as well as a measure of the constellation of services offered to clients, which would penalize the smaller facilities in the sample. In our analyses, client satisfaction scores were not significantly different between facility types, however non-franchised private providers offered fewer family planning methods, other services and less information to clients then all other facility types (see Appendix).
The graphical representation of programme evaluation provides a more comprehensive way to assess multiple features of importance to policy makers. From the perspective of the country ministry of health, this type of representation can assist policy makers in evaluating the performance of family planning service provision platforms nationwide. Depending upon current priorities, officials could promote government and franchised facilities for their high quality service provision. Alternatively they could steer poor clients towards government facilities which are already serving the highest proportion of poor clients, or incentivize non-government facilities to increase access through contracts and other mechanisms. While many venues for services are available, it appears that franchised facilities in both countries in the study are not outperforming alternative approaches to reaching less advantaged clients.
Limitations of the study are the need to draw poverty data from the exit interviews of clients, and not from a population survey. Our measure of the lowest quintile of clients could be improved by comparing client wealth to population wealth levels from a broader sampling frame. The analysis with regard to cost and efficiency is limited by missing data. First, a portion of facilities in both countries were unable to report salary levels for each of their employees, or the value of the physical structure. In order to have a complete dataset, these values were imputed by facility type, resulting in average values which would not have an effect on the conclusions we drew. A second source of missing cost data, however, was the variable costs associated with each facility. Our analysis only accounted for fixed costs of salary and rent, and did not account for items such as supplies, repairs and equipment, which was not included in the survey. The omission of commodity costs could bias a comparison of efficiency across facilities if certain facility types achieved their better quality or access primarily through spending resources on commodities. The lack of detailed data about commodity purchases forces the assumption that labour and capital were the primary expenses at each facility, and that differences in quality and access are achieved and reflected by labour and capital costs.
The results in this paper reconfirm a prior analysis of costs and quality in the Pakistani Green Star data and add tests for statistical significance as well as an analysis for Ethiopia (Bishai et al. 2008b). There are slight numerical differences in the cost and quality results between this paper and the 2008 analysis due to improvements in the way serial measurements on the same facility were handled, but these do not alter the conclusions about cost and quality. The current analysis of access by the poor cannot be compared with the prior paper. In the 2008 analysis, the authors measured access by first identifying all exit interview clients in the poorest quintile across all facility types and asking ‘What proportion of these poorest clients were emerging from NGO, from government, from franchised, and from non-franchised clinics?’ In contrast, the present analysis takes the more appropriate strategy of identifying clients emerging from within each facility type and asking, ‘What proportion of clients at this facility type are in the poorest economic quintile?’ If clients visit clinics at random, then one would expect the answer to always be 20%. Clinics that see more than their expected share of the poorest quintile would have a higher than 20% share of the poor in their clientele.
Based upon local priorities, the policy maker can weight cost, quality and access differentially. As improvements to quality and access often increase costs, such weighting schemes could be used to demonstrate that a facility type is indeed operating in a balanced manner despite being less efficient than competitors. The individual domains of quality could also be weighted to give greater importance to those domains considered more crucial to practitioners in a particular context.
Conclusion
Using the paradigm of a three-legged stool, we posit that balanced achievement of multiple policy objectives is paramount for programme success. Programmes which excel in quality, cost control or access alone, while commendable, do not meet goals of providing high quality access to family planning services to all. Competing priorities, such as improving quality or access at the expense of cost, or curtailing cost at the expense of quality, are decisions policy makers must face on a regular basis. Programme evaluations, however, often look only at one metric, such as quality, or cost per couple year of protection.
We have presented evidence that franchised systems of private family planning providers, with their carrot and stick approach of demanding standards and establishing supply chains, can greatly improve the quality of care in family planning. Depending on the country, the accessibility of franchised private clinics to the poor can be similar to that of non-franchised private clinics (e.g. Pakistan). Thus the quality improvements in the private sector can be delivered to the poor in some settings.
Further research on incentives to improve access within the private sector, through insurance, vouchers or fee waiver programmes, is necessary in this context. A balanced assessment of facility outcomes will be useful for non-specialist policy makers, and a graphical representation on a radar plot may facilitate comparisons.
Funding
Funding support for this study was received from the Bill and Melinda Gates Institute for Population and Reproductive Health at the Johns Hopkins Bloomberg School of Public Health.
Conflict of interest
None declared.
Acknowledgements
The authors wish to acknowledge the generous support of the Bill and Melinda Gates Institute for Population and Reproductive Health for supporting this study, and Dr Amy Tsui and investigators in the Carolina Population Center’s Alternative Business Models project. Jason Gaverick Metheny provided valuable assistance in the analysis of cost data. Helpful comments were received from Dominic Montagu and participants at Gates Institute Summer Institute in Reproductive Health and Development. The standard disclaimer applies.
Appendix
Appendix.
Mean (Standard Deviation) of domains of quality
| Facility type | Abortion training | Methods choice | Information provision | Client satisfaction | Technical competence | Range of services | Total quality (SD) | |
|---|---|---|---|---|---|---|---|---|
| Ethiopia | ||||||||
| Franchise | 1.0 (2.0) | 7.5 (4.2) | 1.3 (2.2) | 3.0 (0.8) | 14.8 (14.0) | 10.4 (4.0) | 37.9 (17) | |
| Government | 0.5 (1.4) | 7.5 (3.4) | 2.6 (2.6) | 3.2 (1.0) | 15.8 (16.7) | 13.4 (3.0) | 43 (19.3) | |
| Private | 0.3 (1.2) | 5.0 (3.0) | 0.1 (0.5) | 3.2 (1.0) | 10.5 (15.0) | 3.6 (3.7) | 22.8 (16.3) | |
| NGO | 0.8 (1.6) | 8.0 (5.0) | 2.9 (3.0) | 3.0 (0.8) | 18.1 (14.1) | 10.4 (5.2) | 43.2 (20.1) | |
| Pakistan | ||||||||
| Franchise | 0.5 (1.2) | 10.0 (7.5) | 1.6 (2.6) | 2.6 (0.5) | 8.7 (4.9) | 23.5 (11.3) | ||
| Government | 0.5 (1.1) | 8.8 (5.2) | 3.1 (3.0) | 2.7 (0.6) | 11.0 (3.2) | 26.1 (8.3) | ||
| Private | 0.2 (0.7) | 5.2 (6.5) | 0.8 (1.9) | 2.6 (0.5) | 6.1 (3.9) | 15.1 (9.4) | ||
| NGO | 0.3 (1.0) | 7.1 (7.4) | 0.8 (2.2) | 2.7 (0.6) | 5.9 (4.5) | 16.8 (10.1) | ||
References
- Arends-Kuenning M, Kessy FL. The impact of demand factors, quality of care and access to facilities on contraceptive use in Tanzania. Journal of Biosocial Science. 2007;39:1–26. doi: 10.1017/S0021932005001045. [DOI] [PubMed] [Google Scholar]
- Arrow KJ. Uncertainty and the welfare economics of medical care. American Economic Review. 1963;53:941–73. [Google Scholar]
- Ashford L. Unmet Need for Family Planning: Recent Trends and their Implications for Programs. Washington, DC: Population Reference Bureau; 2003. [Google Scholar]
- Barberis M, Harvey PD. Costs of family planning programmes in fourteen developing countries by method of service delivery. Journal of Biosocial Science. 1997;29:219–33. doi: 10.1017/s0021932097002198. [DOI] [PubMed] [Google Scholar]
- Bertrand JT, Magnani RJ, Knowles JC. Handbook of Indicators for Family Planning Program Evaluation. Chapel Hill, NC: University of North Carolina at Chapel Hill, Carolina Population Center, Evaluation Project; 1994. [Google Scholar]
- Bhushan I. Understanding Unmet Need. Baltimore, MD: Johns Hopkins University School of Public Health, Center for Communication Programs; 1997. [Google Scholar]
- Bishai D, Mirchandani G, Pariyo G, Burnham G, Black R. The cost of quality improvements due to integrated management of childhood illness (IMCI) in Uganda. Health Economics. 2008a;17:5–19. doi: 10.1002/hec.1231. [DOI] [PubMed] [Google Scholar]
- Bishai D, Shah NM, Walker DG, Brieger WR, Peters DH. Social franchising to improve quality and access in private health care in developing countries. Harvard Health Policy Review. 2008b;9:184–97. [Google Scholar]
- Blanc AK, Curtis SL, Croft TN. Monitoring contraceptive continuation: links to fertility outcomes and quality of care. Studies in Family Planning. 2002;33:127–40. doi: 10.1111/j.1728-4465.2002.00127.x. [DOI] [PubMed] [Google Scholar]
- Bruce J. Fundamental elements of the quality of care: a simple framework. Studies in Family Planning. 1990;21:61–91. [PubMed] [Google Scholar]
- Bruce J. Quality of care: a brief history and a look ahead. Planned Parenthood Challenges / International Planned Parenthood Federation. 1994;((2)):2–5. [PubMed] [Google Scholar]
- Cakir HV, Fabricant SJ, Kircalioglu FN. Comparative costs of family planning services and hospital-based maternity care in Turkey. Studies in Family Planning. 1996;27:269–76. [PubMed] [Google Scholar]
- Devi L. Encyclopaedia of Social Change. India: Anmol Publications Pvt Ltd; 1996. [Google Scholar]
- Donabedian A. The quality of care. How can it be assessed? Journal of the American Medical Association. 1988;260:1743–8. doi: 10.1001/jama.260.12.1743. [DOI] [PubMed] [Google Scholar]
- Filmer D, Pritchett LH. Estimating wealth effects without expenditure data—or tears: an application to educational enrollments in states of India. Demography. 2001;38:115–32. doi: 10.1353/dem.2001.0003. [DOI] [PubMed] [Google Scholar]
- Gakidou E, Vayena E. Use of modern contraception by the poor is falling behind. PLoS Medicine. 2007;4:381–8. doi: 10.1371/journal.pmed.0040031. [DOI] [PMC free article] [PubMed] [Google Scholar]
- Gillespie D, Ahmed S, Tsui A, Radloff S. Unwanted fertility among the poor: an inequity? Bulletin of the World Health Organization. 2007;85:100–7. doi: 10.2471/BLT.06.033829. [DOI] [PMC free article] [PubMed] [Google Scholar]
- Kaplan RS, Norton DP. Using the balanced scorecard as a strategic management system. Harvard Business Review. 1996 (January/February): 75–85. [Google Scholar]
- Koenig MA, Hossain MB, Whittaker M. The influence of quality of care upon contraceptive use in rural Bangladesh. Studies in Family Planning. 1997;28:278–89. [PubMed] [Google Scholar]
- Levin A, Rahman MA, Quayyum Z, Routh S, Barkat-e-Kuda The demand for child curative care in two rural thanas of Bangladesh: effect of income and women’s employment. International Journal of Health Planning and Management. 2001;16:179–94. doi: 10.1002/hpm.630. [DOI] [PubMed] [Google Scholar]
- Matheny G. Family planning programs: getting the most for the money. International Family Planning Perspectives. 2004;30:134–8. doi: 10.1363/3013404. [DOI] [PubMed] [Google Scholar]
- Mensch B, Arends-Kuenning M, Jain A. The impact of the quality of family planning services on contraceptive use in Peru. Studies in Family Planning. 1996;27:59–75. [PubMed] [Google Scholar]
- Mroz T, Bollen KA, Speizer IS, Mancini DJ. Quality, accessibility and contraceptive use in rural Tanzania. Demography. 1999;36:23–40. [PubMed] [Google Scholar]
- Peters D, Noor AA, Singh LP, et al. A balanced scorecard for health services in Afghanistan. Bulletin of the World Health Organization. 2007;85:146–51. doi: 10.2471/BLT.06.033746. [DOI] [PMC free article] [PubMed] [Google Scholar]
- Population Reference Bureau. 2002 World Population Data Sheet. Washington, DC: Population Reference Bureau; 2002. Online at: www.prb.org/pdf/WorldPopulationDS02_Eng.pdf. [Google Scholar]
- Ross J. The question of access. Studies in Family Planning. 1995;26:241–2. discussion 243–4. [PubMed] [Google Scholar]
- Routh S, Barkat-e-Khuda An economic appraisal of alternative strategies for the delivery of MCH-FP services in urban Dhaka, Bangladesh. International Journal of Health Planning and Management. 2000;15:115–32. doi: 10.1002/1099-1751(200004/06)15:2<115::AID-HPM586>3.0.CO;2-6. [DOI] [PubMed] [Google Scholar]
- Schuler SR, Bates LM, Islam MK. Paying for reproductive health services in Bangladesh: intersections between cost, quality and culture. Health Policy and Planning. 2002;17:273–80. doi: 10.1093/heapol/17.3.273. [DOI] [PubMed] [Google Scholar]
- Sedgh G, Hussain R, Bankole A, Singh S. Women with an Unmet Need for Contraception in Developing Countries and Their Reasons for Not Using a Method. New York: Guttmacher Institute; 2007. [Google Scholar]
- Stephenson R, Tsui AO, Sulzbach S, et al. Franchising reproductive health services. Health Services Research. 2004;39:2053–80. doi: 10.1111/j.1475-6773.2004.00332.x. [DOI] [PMC free article] [PubMed] [Google Scholar]
- Strobino D, Koenig M, Grason HA. Approaches and Indicators for Measuring Quality in Region VIII Family Planning Programming. Baltimore, MD: Women’s and Children’s Health Policy Center, Johns Hopkins School of Public Health; 2000. [Google Scholar]
- Westoff CF. New Estimates of Unmet Need and the Demand for Family Planning. 2006. DHS Comparative Reports No. 14. Calverton, MD: Macro International Inc. [Google Scholar]