Abstract
A monaural binary time-frequency (T-F) masking technique is proposed for suppressing reverberation. The mask is estimated for each T-F unit by extracting a variance-based feature from the reverberant signal and comparing it against an adaptive threshold. Performance of the estimated binary mask is evaluated in three moderate to relatively high reverberant conditions (T60 = 0.3, 0.6, and 0.8 s) using intelligibility listening tests with cochlear implant users. Results indicate that the proposed T-F masking technique yields significant improvements in intelligibility of reverberant speech even in relatively high reverberant conditions (T60 = 0.8 s). The improvement is hypothesized to result from the recovery of the vowel/consonant boundaries, which are severely smeared in reverberation.
INTRODUCTION
Reflections and diffractions of sounds from the walls and objects in an acoustic enclosure are called reverberation. A distant microphone collects, in addition to direct sound, the early and late reflections arriving after the direct sound. The early and late reflections fill the gaps in the temporal envelope of speech and reduce envelope modulation depth (Assmann and Summerfield, 2004). Although speech intelligibility is not affected much by reverberation for normal hearing (NH) listeners, it is degraded significantly for hearing impaired, cochlear implant (CI) users, and elderly people (Nabelek and Letowski, 1988; Kokkinakis et al., 2011; Nabelek and Letowski, 1985). Reverberation also poses a detrimental impact on the performance of automatic speech recognition (ASR) (Palomäki et al., 2004), and speaker identification (SID) systems (Sadjadi and Hansen, 2011). Suppressing reverberation is a challenging task because of its non-stationary nature and being correlated with speech.
Several speech dereverberation techniques have been proposed, some of which consist of multiple stages treating early and late reverberations differently (Wu and Wang, 2006; Furuya and Kataoka, 2007). Inverse filtering is one of the commonly used techniques for speech dereverberation which removes the reverberation by passing the reverberant signal through a finite impulse response (FIR) filter (Miyoshi and Kaneda, 1988). The main drawbacks of these techniques are (1) the room impulse response (RIR) should be known in advance or needs to be blindly estimated, (2) the RIRs should be minimum phase to be invertible. With the use of multiple microphones, an exact inverse of the RIR can be obtained assuming there are no common zeros among the RIRs. Several “blind” multichannel dereverberation algorithms have also been proposed, such as beamforming (Habets et al., 2010), and blind deconvolution techniques (Furuya and Kataoka, 2007). Although less effective, single microphone dereverberation algorithms are usually more practical and desirable. A few examples of such algorithms are spectral subtraction (Lebart et al., 2001), and excitation source information based (Yegnarayana and Murthy, 2000) techniques. However, these techniques are still far from perfect, and some do not result in acceptable performance in practice.
In this study, an alternative dereverberation algorithm based on binary time-frequency (T-F) masking is proposed. Binary masking refers to algorithms that decompose the signal into T-F units and select those units satisfying a given criterion (e.g., SNR > 0 dB, for noise suppression), while discarding the rest by applying a binary mask to the units of the decomposed signal, i.e., the mask for a given T-F unit is set to 0 if it does not satisfy a given criterion or is set to 1 if it satisfies the criterion (Wang and Brown, 2006). Binary masks have been widely used for different speech enhancement as well as sound separation applications resulting in gains in intelligibility and quality of the processed noisy speech (Wang and Brown, 2006; Kim et al., 2009; Li and Loizou, 2008). Use of the binary masks for dereverberation, which was only evaluated by a few studies, is attractive as it does not rely on the inversion of the RIR. Palomäki et al. (2004) introduced a reverberant (a priori) binary mask primarily for ASR applications. Mandel et al. (2010) evaluated a number of oracle reverberant (binary and soft) masks using source-separation algorithms and human listeners. All masks were constructed based on several combinations of the ratio of the target direct signal energy to either the target late-reverberant signal energy and/or the masker (direct-path and) late-reverberant energy. The masks, however, were based on the decomposition of the reverberant signal to its direct-path, early echo and late reflection components, i.e., they assumed access to the RIR which is unknown in practice.
The ideal reverberant mask (IRM) proposed by Kokkinakis et al. (2011), has previously been shown to result in substantial intelligibility gains for both CI users and NH listeners (Kokkinakis et al., 2011; Hazrati and Loizou, 2012). Motivated by the intelligibility gains obtained by applying IRM to reverberant speech, a blind (non-ideal) T-F masking technique is proposed for improving the intelligibility of reverberant speech. A nonparametric and unsupervised method of automatic threshold selection (Otsu, 1979), which was originally used for image segmentation, is adopted as the local criterion in decision making for each T-F unit. A feature based on the ratio of signal variances is computed for each T-F unit and the local criterion is constructed using this feature. Intelligibility listening tests are used to assess the performance of the proposed dereverberation algorithm.
The NH listeners generally perform well even in extremely reverberant conditions, while on the other hand, the intelligibility of reverberant speech drops significantly in hearing-impaired listeners and CI users even at moderately reverberant conditions. Therefore, in the current study CI listeners are tested to evaluate the proposed dereverberation algorithm in terms of intelligibility improvement. The results from IRM are also presented as an upper level for intelligibility assessments.
BINARY MASKING OF REVERBERANT SPEECH
In the implementation of binary reverberant masking algorithms described in this section, a total of 64 fourth order Gammatone filters are used to decompose the signal bandwidth of 50 to 8000 Hz (half of sampling frequency) into quasi-logarithmically spaced bands with center frequencies equally spaced on the equivalent rectangular bandwidth (ERB) scale. The bandpass filtered signals are divided into 20-ms frames with a 50% overlap between adjacent frames.
Blind reverberant mask
Algorithm overview
The block diagram of the proposed dereverberation algorithm is shown in Fig. 1. As depicted in the figure, the proposed algorithm consists of four stages. The first stage provides time-frequency representation of the speech signal by passing it through a set of bandpass filters and blocking the bandpass filtered outputs to short time overlapping frames, where each short time frame at each frequency bin corresponds to a T-F unit. In order to make decisions for classifying the T-F units as speech or (late) reverberation dominant, features are extracted in the second stage for all T-F units. After passing the features to the next stage, the threshold value for each unit is computed, the T-F units are classified as speech or reverberation dominant, and their corresponding mask value is set to 1 or 0 accordingly. This binary mask provides an estimate of the IRM (ideal case) and is applied to the T-F representation of the reverberant signal in the last stage. The binary-masked bandpass filtered reverberant speech signals are summed across different frequency bins to re-synthesize the dereverberated speech.
Figure 1.

Block diagram of the proposed binary mask estimation technique for dereverberation.
Feature extraction
The input reverberant speech, r(n), is decomposed into T-F units by passing it through a J-channel (here, J is set to 64) Gammatone filterbank, with quasi-logarithmically spaced center frequencies, and applying short-time frame blocking. This T-F decomposed signal is denoted by r(t, j) where t and j represent time frame and frequency band indices, respectively. In order to reliably classify the T-F units, the peaks and valleys in each band need to be identified. This is accomplished via the use of a discriminative feature computed as the ratio of the variance of the signal raised to a power and the variance of the absolute value of the signal. Accordingly, the feature is computed as follows:
| (1) |
where , and is the absolute value of the L (frame size) dimensional reverberant vector in frame t, and frequency band j. The parameter α in Eq. 1 is set to 2.1 experimentally.
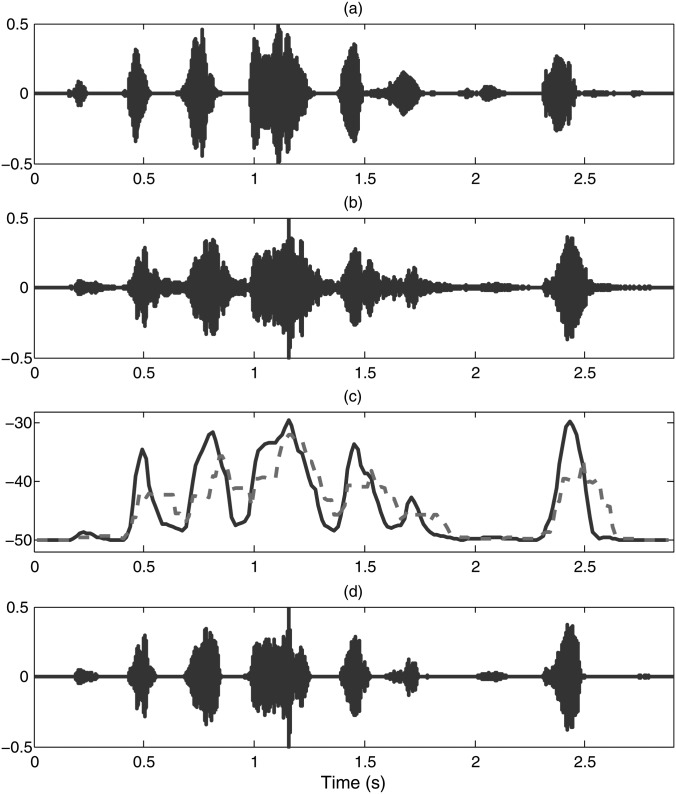
The feature is smoothed across time using a 3-point median filter. Figure 2c shows features extracted from a bandpass filtered reverberant signal (fc = 0.5 kHz). As can be seen, the peaks/valleys of the features are aligned with speech presence/absence in anechoic quiet condition [compare panels in Figs. 2a, 2c]. Therefore, an adaptive threshold (dashed line) is needed to make accurate decision on whether the short-time frame is speech or reverberation dominant.
Figure 2.
(Color online) Band-pass filtered (fc = 0.5 kHz) waveforms of the IEEE sentence: “The stitch will serve but needs to be shortened,” for (a) clean, (b) reverberant (T60 = 0.6 s), and (d) BRM-processed reverberant signals. Panel (c) shows the instantaneous threshold (dashed line) and the features (solid line).
The rationale behind the use of such feature is its similarity to the fourth moment of speech which is known as kurtosis. Kurtosis has been found to reduce as the reverberation increases or in other words, the kurtosis of reverberant speech is lower than that of the anechoic speech (Gillespie et al., 2001; Wu and Wang, 2006). Motivated by this fact, the above proposed feature was found to behave in a similar manner to kurtosis of speech and its use as the input to the histogram-based threshold estimation stage resulted in a reliable threshold estimation.
Binary mask estimation
In order to make decision on the features extracted using 1, as to whether they are reverberation-dominant or speech-dominant, they are compared against a threshold. Here, a nonparametric and unsupervised method for automatic threshold estimation (previously used for image segmentation) is adopted (Otsu, 1979). The input to this histogram-based threshold estimation technique at time frame t and frequency band j is the following feature vector containing features of Lp previous and Lf future frames:
| (2) |
Here, features from 10 previous and 2 future frames are used for the histogram calculation. If we define the global intensity mean, mG, the cumulative mean, m(tr), and the cumulative sum, Ps(tr) as follows:
| (3) |
| (4) |
| (5) |
where pi denotes the normalized histogram of the feature vector [Eq. 2], the between-class variance with distinct intensity level index, tr, can be expressed as
| (6) |
which is used to find the optimum threshold level tr* in the following manner:
| (7) |
where Tr is the total number of distinct levels of the histogram of the input feature vector (fhist).
If the long-term windowed feature vector contains only silence, the algorithm will compute inaccurate threshold levels resulting in incorrect decisions. Therefore, a minimum threshold level (tr0) is considered to discriminate silence from speech. Use of the long-term windowed feature vectors along with tr0 results in a robust and effective adaptive threshold level estimation. In the T-F classification stage, if the feature value for a T-F unit is greater than the adaptive threshold of that specific T-F unit, the frame is classified as reverberation-free, otherwise it is considered as reverberation-dominant. Frames classified as reverberation-free are retained, while reverberation-dominant frames are zeroed out. This forms a binary blind reverberant mask (BRM) which is defined as
| (8) |
where fM(t,j) is the feature extracted in Eq. 1. The enhanced signal [Fig. 2d] is obtained after applying the binary mask, estimated based on comparing features and threshold levels [Fig. 2c], to the reverberant signal [Fig. 2b]. Note that this technique removes the reverberation-dominant T-F units resulting in restoration of the word/syllable boundaries [see Fig. 2d]. Our hypothesis is that having access to the clear location of those boundaries is very important for good speech understanding in reverberant environments.
Ideal reverberant mask
In IRM estimation, both reverberant and clean signals are decomposed into T-F units as described in Sec. 2A2. The speech-to-reverberant ratio (SRR) features which are the ratio of the short-time energy of the clean signal to that of the reverberant signal are computed at each T-F unit and the IRM for that unit is obtained by comparing its SRR value with a preset threshold (T′) (Kokkinakis et al., 2011) as
| (9) |
The IRM is implemented and evaluated in this study for comparative purposes, as it provides the upper bound in performance. The threshold used in Eq. (15) is set to −8 dB.
EXPERIMENT: EVALUATION OF THE PROPOSED BLIND REVERBERANT MASK
Methods
Subjects
A total of six CI listeners with Nucleus devices participated in this study. All participants were native speakers of American English with postlingual deafness, who received no benefit from hearing aids preoperatively. The participants used their CI devices routinely and had a minimum of 1 year experience with their CIs. Biographical data for the subjects is detailed in Table TABLE I.. All subjects were paid for their participation in this research study.
TABLE I.
Biographical data of the CI users tested.
| Subjects | Age | Gender | Years implanted (L/R) | Number of active electrodes | CI processor | Etiology of hearing loss |
|---|---|---|---|---|---|---|
| S1 | 58 | F | 2/- | 22 | N5 | Unknown |
| S2 | 65 | F | 3/3 | 22 | N5 | Unknown |
| S3 | 65 | M | 3/- | 21 | Freedom | Unknown |
| S4 | 78 | M | 7/7 | 21 | Freedom | Hereditary |
| S5 | 59 | M | 1/1 | 22 | N5 | Meniere's disease |
| S6 | 62 | F | 2/2 | 22 | N5 | Unknown |
Research processor
Four of the subjects tested were using the Nucleus 5 and two were using the Nucleus Freedom speech processor on a daily basis. Subjects were tested using a personal digital assistant (PDA)-based cochlear implant research platform (Ali et al., 2011). The signals were streamed off-line via the PDA platform and sent directly to the subject's cochlear implant. The PDA processor was programmed for individual subjects using their threshold and comfortable loudness levels, and coding strategy parameters. The volume of the speech processor was also adjusted to a comfortable loudness prior to initial testing. Institutional review board (IRB) approval and informed consent were obtained from all participants before testing commenced.
Stimuli
IEEE sentences (IEEE, 1969) were used as the speech stimuli for testing. There are 72 list of sentences in IEEE database, where each list contains 10 phonetically balanced sentences and each sentence is composed of approximately 7−12 words. The root-mean-square (RMS) value of all sentences was equalized to the same value corresponding to approximately 65 dBA.
Simulated reverberant conditions
The reverberant stimuli are generated by convolving the clean signals with real RIRs recorded in a 10.06 m × 6.65 m × 3.4 m (length × width × height) room (Neuman et al., 2010). The reverberation time of the room is varied from 0.8 to 0.6, and 0.3 s by adding absorptive panels to the walls and floor carpeting. The direct-to-reverberant ratios (DRR) of the RIRs are 1.5, −1.8, and −3.0 dB for T60 = 0.3, 0.6, and 0.8 s, respectively. The distance between the single-source signal and the microphone is 5.5 m, which is beyond the critical distance. All stimuli were presented to the listener through the PDA in a double-walled sound attenuated booth (Acoustic Systems, Inc.). Prior to testing, each subject participated in a short practice session to gain familiarity with the listening task. During the practice session, the subjects were allowed to adjust the volume to their comfortable level.
Procedure
Subjects participated in a total of ten conditions, three unprocessed reverberant, three IRM processed, and three BRM processed reverberant conditions corresponding to T60 = 0.3, 0.6, and 0.8 s, and anechoic quiet condition which was used as a control condition. Two IEEE lists (20 sentences) were used per condition.
Each subject completed all ten conditions in a single session. Participants were given a 15 min break every 60 min during the test session. Following initial instructions, each user participated in a brief practice session to gain familiarity with the listening task. None of the lists were repeated across different conditions. The order of the test conditions was randomized across subjects to minimize order effects. During testing, each sentence was presented twice and the participants were instructed to repeat as many of the words as they could identify. The responses of each individual were collected, and scored off-line based on the number of words correctly identified. All words were scored. The percent correct scores for each condition were calculated by dividing the number of words correctly identified by the total number of words in the particular sentence lists.
Results and discussion
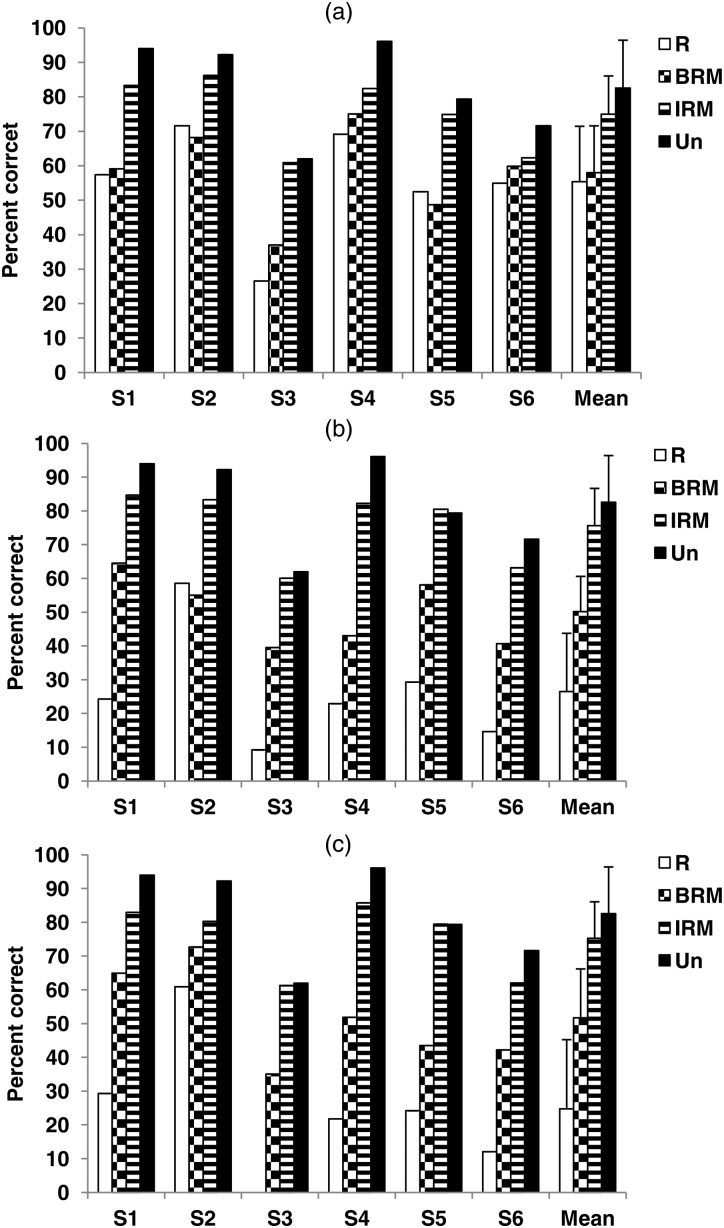
The six CI listeners were tested to evaluate the intelligibility of the reverberant signals processed by the proposed BRM algorithm. Figure 3 shows the individual as well as the averaged intelligibility scores of the CI users, in terms of the mean percentage of words identified correctly. The results obtained from the proposed BRM are compared against those obtained by testing the subjects with the unprocessed reverberant stimuli in three moderate to relatively high reverberant conditions (T60 = 0.3, 0.6, and 0.8 s). Scores obtained from the IRM-processing (Kokkinakis et al., 2011) are also given for comparison to provide the upper bound in performance. The average intelligibility score obtained in anechoic quiet condition was 82.6% for the six tested CI listeners. With the proposed BRM, the intelligibility of the reverberant speech improved from 26.5% and 24.7% to 50.2% and 51.7% in T60 = 0.6 and 0.8 s, respectively. For T60 = 0.3 s a small improvement from 55.4% to 58.3% was observed.
Figure 3.
Individual as well as average intelligibility scores of six CI users in (a) T60 = 0.3 s, (b) T60 = 0.6 s, and (c) T60 = 0.8 s. “R,” “BRM,” “IRM,” and “Un” stand for reverberant signals, BRM-processed, IRM-processed, and unprocesed signals, respectively. Error bars indicate standard deviations.
An analysis of variance (ANOVA) (with repeated measures) confirmed a significant effect (F[2,10] = 78.92, p < 0.05) of reverberation time and a significant effect of processing (F[2,10] = 113.27, p < 0.05) on speech intelligibility. Least significant difference (LSD) post hoc comparisons were run to assess significant differences in scores obtained between different processing methods. Results indicated that performance improved significantly (p < 0.05) relative to the reverberant (unprocessed) conditions with both IRM and BRM processing techniques except for the BRM processing in T60 = 0.3 s. This is due to the fact that the proposed BRM algorithm primarily suppresses overlap-masking effect; hence in small reverberation times, where the self-masking is dominant, the BRM has limited or no impact.
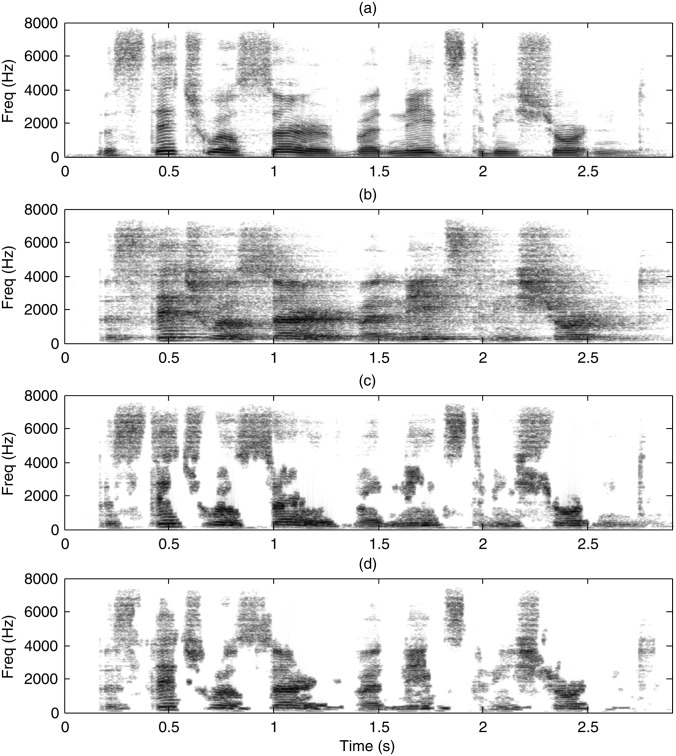
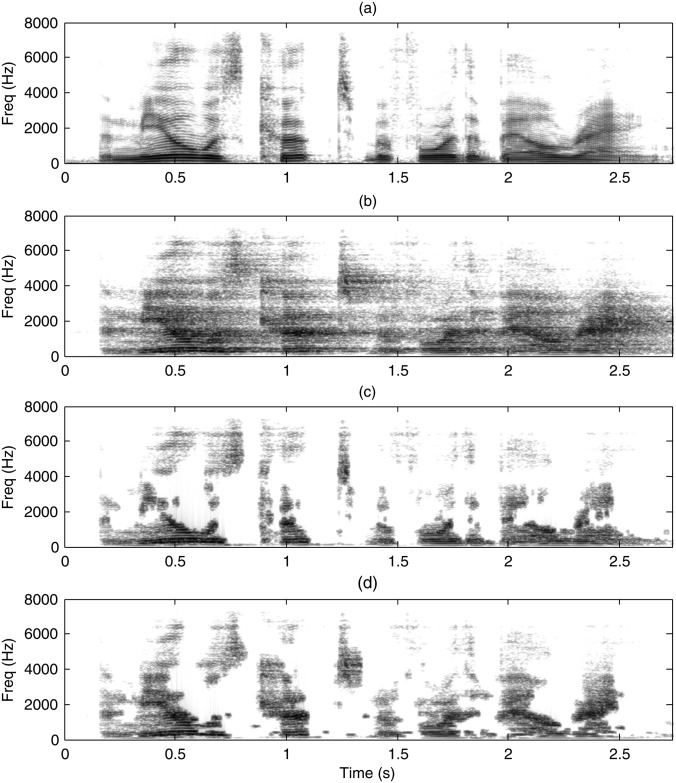
Spectrograms of speech are used here in order to visually assess the effectiveness of the proposed reverberant mask in reverberation suppression. Spectrograms of anechoic clean signal, reverberant, IRM, and BRM processed signals of two IEEE sentences in T60 = 0.6 and 0.8 s are plotted in Figs. 45.
Figure 4.
Speech spectrograms of the sentence: “The stitch will serve but needs to be shortened,” for (a) clean, (b) reverberant (T60 = 0.6 s), (c) IRM-processed, and (d) BRM-processed reverberant signals.
Figure 5.
Speech spectrograms of the sentence: “The meal was cooked before the bell rang,” for (a) clean, (b) reverberant (T60 = 0.8 s), (c) IRM-processed, and (d) BRM-processed reverberant signals.
As seen from the figures, reverberation is suppressed to a great extent with the proposed BRM algorithm. The reverberation energy that previously filled the gaps and smeared the phoneme onsets is greatly removed and the speech syllables are recovered [compare panels (b) and (d)]. Moreover, the proposed BRM provides a good estimate of the IRM [comparing panels (c) and (d)].
DISCUSSSION
As results indicate, even with moderate amounts of reverberation (T60 = 0.3 s), intelligibility scores drop (relative to the anechoic conditions) by 27.2% for CI users. After applying the BRM to the reverberant signals, the subjective intelligibility scores improved by 2.9%, 23.7%, and 27.0% absolute percentage points in T60 = 0.3, 0.6, and 0.8 s conditions, respectively. These improvements are found to be statistically significant (p < 0.05) at T60 = 0.6 and 0.8 s. Although the IRM algorithm produces higher intelligibility gains, the BRM method still provides significant intelligibility improvements.
Blind nature of the BRM strategy (no use of either the anechoic speech or RIR information) is the major reason of obtaining lower scores by applying BRM strategy to the reverberant signals (compared to the IRM-processed reverberant signals).1
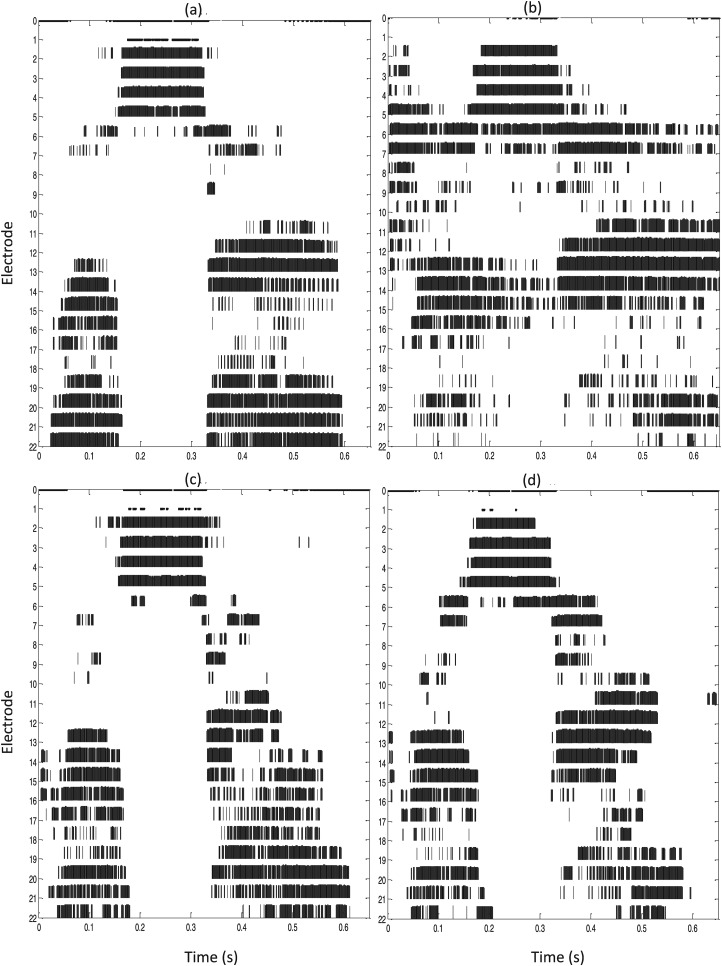
This intelligibility improvement is hypothesized to be due to the recovery of the vowel/consonant boundaries obscured by reverberation and the gaps between vowels and consonants filled with reverberant energy [see Fig. 4b and Fig. 5b]. This is evident in unvoiced segments of speech, and consequently causes a decrease in intelligibility (Kokkinakis et al., 2011). As shown in panels (c) of Figs. 45, after applying the IRM to the reverberant signal, the vowel/consonant boundaries and gaps previously filled with reverberant energy are recovered, resulting in improved intelligibility. Comparing the spectrogram of the BRM-processed reverberant speech [panel (d)] with that of the IRM-processed reverberant signal [panel (c)], it is evident that the vowel/consonant boundaries and gaps are restored to a great extent. This is more evident in Fig. 6 which illustrates example stimulus output patterns (electrodograms) of a shorter segment (two words, t = 0.65 s to t = 1.3 s) with the ACE speech coding strategy in the Nucleus 24 device. In all panels shown, the vertical axes represent the electrode position corresponding to a specific frequency, while the horizontal axes show time progression. Temporal envelope smearing is evident in Fig. 6b. As shown in Fig. 6b, temporal smearing blurs the vowel and consonant boundaries which are normally present in the anechoic stimuli plotted in Fig. 6a. Applying IRM or BRM to the reverberant stimuli removes the overlap masking effect of reverberation and results in a channel selection pattern closer to that of anechoic stimuli. This is evident by comparing Figs. 6c, 6d with Fig. 6b. However, comparing the channels selected from the BRM-processed signal to those selected from IRM-processed signals, it is clear that the BRM makes mistakes in low frequency regions (high electrode numbers in Fig. 6) which is one of the main reasons for the intelligibility gap between IRM-processed and BRM-processed signals.
Figure 6.
Stimulus output patterns (electrodograms) of the words: “will serve” from the IEEE sentence “The stitch will serve but needs to be shortened,” for (a)clean, (b) reverberant (T60 = 0.6 s), (c) IRM-processed, and (d) BRM-processed reverberant signals.
The effectiveness of the proposed BRM in the time domain is also demonstrated in Fig. 2. The figure shows bandpass filtered signal of the same IEEE sentence (as in Fig. 3) at fc = 0.5 kHz for anechoic, reverberant (T60 = 0.6 s), and BRM-processed signals along with the estimated feature and threshold values for the same frequency band. Comparing the BRM-processed [panel 2d] with the anechoic and reverberant signals [panels 2a, 2d], we observe that the proposed BRM technique restores the vowel/consonant boundaries.
It is worth mentioning that no explicit enhancement technique is applied to the reverberant signals here, and the intelligibility gains are solely from eliminating highly reverberant T-F units.
CONCLUSIONS
The present study proposed a binary blind reverberant masking (BRM) strategy for improving intelligibility of reverberant speech for CI listeners. This technique uses the proposed feature [Eq. 1] along with a nonparametric and unsupervised threshold estimation method to classify the T-F units to reverberation-dominant or reverberation-free units. Reverberation was suppressed by retaining only the units that were classified as reverberation-free. Performance of the proposed technique was assessed through listening tests conducted with six CI listeners. Listening tests indicated significant improvements in intelligibility in relatively high reverberant conditions (T60 = 0.6 and 0.8 s). This improvement was attributed to the recovery of the vowel/consonant boundaries, which are often blurred in reverberation owing to the late reflections.
ACKNOWLEDGMENTS
This work was supported by Grant R01 DC010494 awarded from the National Institute of Deafness and other Communication Disorders (NIDCD) of the National Institutes of Health (NIH). The authors would like to thank the cochlear implant users for their time and dedication, and also Dr. Neuman of the NYU Langone Medical Center for providing the RIRs used in this study.
Footnotes
The IRM compares the energy of the reverberant speech with that of the anechoic speech and determines whether to retain or discard a T-F unit. In this way the T-F units masked by reverberation are identified and discarded, however the BRM strategy tries to determine the reverberation-dominant T-F units by comparing a feature which is similar to the kurtosis of speech by an adaptively varying threshold obtained applying an unsupervised histogram-based technique to the estimated feature vector of the neighboring frames of a specific T-F unit (in a specific channel).
References
- Ali, H., Lobo, A. P., and Loizou, P. C. (2011). “ A PDA platform for offline processing and streaming of stimuli for cochlear implant research,” in Proceedings International Conference of the IEEE Engineering in Medicine and Biology Society, Boston, MA, pp. 1045–1048. [DOI] [PubMed] [Google Scholar]
- Assmann, P. F., and Summerfield, Q. (2004). “ The perception of speech under adverse acoustic conditions,” in Speech Processing in the Auditory System, edited by Greenberg S., Ainsworth W. A., Popper A. N., and Fay R. R. (Springer, New York: ), pp. 231–308. [Google Scholar]
- Furuya, K., and Kataoka, A. (2007). “ Robust speech dereverberation using multichannel blind deconvolution with spectral subtraction,” IEEE Trans. Audio Speech Lang. Process. 15, 1579–1591. 10.1109/TASL.2007.898456 [DOI] [Google Scholar]
- Gillespie, B. W., Malvar, H. S., and Florencio, D. A. F. (2001). “ Speech dereverberation via maximum-kurtosis subband adaptive filtering,” in Proceedings of the IEEE International Conference on Acoustics, Speech, and Signal Processing, Salt Lake City, UT, pp. 3701–3704. [Google Scholar]
- Habets, E. A. P., Benesty, J., Cohen, I., Gannot, S., and Dmochowski, J. (2010). “ New insights into the mvdr beamformer in room acoustics,” IEEE Trans. Audio Speech Lang. Process. 18, 158–170. 10.1109/TASL.2009.2024731 [DOI] [Google Scholar]
- Hazrati, O., and Loizou, P. C. (2012). “ Tackling the combined effects of reverberation and masking noise using ideal channel selection,” J. Speech Hear. Res. 55, 500−510. 10.1044/1092-4388(2011/11-0073) [DOI] [PMC free article] [PubMed] [Google Scholar]
- IEEE (1969). “IEEE recommended practice for speech quality measurements,” IEEE Trans. Audio Electroacoust. AU-17, 225–246. [Google Scholar]
- Kim, G., Lu, Y., Hu, Y., and Loizou, P. C. (2009). “ An algorithm that improves speech intelligibility in noise for normal-hearing listeners,” J. Acoust. Soc. Am. 126, 1486–1494. 10.1121/1.3184603 [DOI] [PMC free article] [PubMed] [Google Scholar]
- Kokkinakis, K., Hazrati, O., and Loizou, P. C. (2011). “ A channel-selection criterion for suppressing reverberation in cochlear implants,” J. Acoust. Soc. Am. 129, 3221–3232. 10.1121/1.3559683 [DOI] [PMC free article] [PubMed] [Google Scholar]
- Lebart, K., Boucher, J. M., and Denbigh, P. N. (2001). “ A new method based on spectral subtraction for speech dereverberation,” Acta Acoust. 87, 359–366. [Google Scholar]
- Li, N., and Loizou, P. C. (2008). “ Factors influencing intelligibility of ideal binary-masked speech: Implications for noise reduction,” J. Acoust. Soc. Am. 123, 1673–1682. 10.1121/1.2832617 [DOI] [PMC free article] [PubMed] [Google Scholar]
- Mandel, M. I., Bressler, S., Shinn-Cunningham, B., and Ellis, D. P. W. (2010). “ Evaluating source separation algorithms with reverberant speech,” IEEE Trans. Audio Speech Lang. Process. 18, 1872–1883. 10.1109/TASL.2010.2052252 [DOI] [Google Scholar]
- Miyoshi, M., and Kaneda, Y. (1988). “ Inverse filtering of room acoustics,” IEEE Trans. Acoust Speech Signal. Process. 36, 145–152. 10.1109/29.1509 [DOI] [Google Scholar]
- Nabelek, A. K., and, Letowski, T. R. (1985). “ Vowel confusions of hearing-impaired listeners under reverberant and non-reverberant conditions,” J. Speech Hear. Disord. 50, 126–131. [DOI] [PubMed] [Google Scholar]
- Nabelek, A. K., and Letowski, T. R. (1988). “ Similarities of vowels in nonreverberant and reverberant fields,” J. Acoust. Soc. Am. 83, 1891–1899. 10.1121/1.396473 [DOI] [PubMed] [Google Scholar]
- Neuman, A. C., Wroblewski, M., Hajicek, J., and Rubinstein, A. (2010). “ Combined effects of noise and reverberation on speech recognition performance of normal-hearing children and adults,” Ear Hear. 31, 336–344. 10.1097/AUD.0b013e3181d3d514 [DOI] [PubMed] [Google Scholar]
- Otsu, N. (1979). “ A threshold selection method from gray-level histograms,” IEEE Trans. Syst., Man, Cybern. 9, 62–66. 10.1109/TSMC.1979.4310076 [DOI] [Google Scholar]
- Palomäki, K. J., Brown, G. J., and Parker, J. P. (2004). “ Techniques for handling convolutional distortion with ‘missing data’ automatic speech recognition,” Speech Commun. 43, 123–142. 10.1016/j.specom.2004.02.005 [DOI] [Google Scholar]
- Sadjadi, S. O., and Hansen, J. H. L. (2011). “ Hilbert envelope based features for robust speaker identification under reverberant mismatched conditions,” in Proceedings of the IEEE International Conference on Acoustics, Speech, and Signal Processing, Prague, Czech Republic, pp. 5449–5451. [Google Scholar]
- Wang, D. L., and Brown, G. J. (2006). “ Fundamentals of computational auditory scene analysis,” in Computational Auditory Scene Analysis: Principles, Algorithms, and Applications, edited by Wang D. L., and Brown G. J. (Wiley, New York: ), pp. 1–44. [Google Scholar]
- Wu, M., and Wang, D. L. (2006). “ A two-stage algorithm for one-microphone reverberant speech enhancement,” IEEE Trans. Audio Speech Lang. Process. 14, 774–784. 10.1109/TASL.2006.872616 [DOI] [Google Scholar]
- Yegnanarayana, B., and Murthy, P. S. (2000). “ Enhancement of reverberant speech using LP residual signal,” IEEE Trans. Speech Audio. Process. 8, 267–281. 10.1109/89.841209 [DOI] [Google Scholar]


