

Abstract
AKT is a critical signaling node downstream of PI3K, which is often activated in cancer. We analyzed the state of activation of AKT in 80 human non-small cell lung cancer cell lines under serum starvation conditions. We identified 13 lines which showed persistent AKT activation in the absence of serum. In 12 of the 13 lines, AKT activation could be attributed to loss of PTEN, activating mutation in EGFR or PIK3CA, or amplification of ERBB2. HCC2429 was the only cell line that had no alterations in those genes, but had high phospho-AKT(Ser473) levels under serum starvation conditions. However, the activation of AKT in HCC2429 was PI3K- and mTORC2-dependent based upon use of specific inhibitors. Kinome tyrosine phosphorylation profiling showed that both Notch and SRC were highly activated in this cell line. Despite the activation of Notch, AKT activation and cell survival were not affected by Notch inhibitors DAPT or Compound E. In contrast, SRC inhibitors PP2 and dasatinib both significantly decreased pAKT(Ser473) levels and reduced cell survival by inducing apoptosis. Further, a combination of SRC and mTOR inhibition synergistically blocked activation of AKT and induced apoptosis. Over-expression of SRC has been identified previously in human lung cancers, and these results suggest that a combination of SRC and mTOR inhibitors may have unique therapeutic benefit for a subset of lung cancers with these molecular features.
Keywords: lung cancer, AKT, mTOR, SRC, rapamycin, Torin1
Introduction
Lung cancer is the leading cause of cancer-related deaths in both the USA and worldwide with a 5-year survival rate of only 15% (1). Lung cancer consists of several pathologic subtypes, including adenocarcinoma, squamous cell carcinoma, small cell carcinoma, and large cell carcinoma. Those types not including small cell carcinoma are often grouped together as non-small cell lung carcinoma (NSCLC). Cancer genome sequencing efforts have identified many recurrent mutations that appear to contribute to human lung cancer development (2, 3). In adenocarcinoma, several proto-oncogenes, including KRAS and EGFR, are known to be mutated at significant frequency (3–5). Mutation of tumor suppressors including TP53, CDKN2A, PTEN, NF1, and LKB1 are also common in lung adenocarcinoma (3, 6).
The PI3K/AKT/mTOR pathway, which plays multiple roles in cell growth, proliferation, and survival, is frequently deregulated in cancer. The most common mechanism of activation of this pathway in cancer is due to loss or reduced expression of PTEN in multiple cancer types (7, 8). However, several other activating mechanisms/mutations are known, including PIK3CA and AKT1 mutation, and activation of upstream tyrosine kinases including EGFR (3).
PI3K consists of a regulatory p85 subunit and a catalytic p110 subunit, which phosphorylates lipid inositides at the 3′ position (9). PI3K activation results in the generation primarily of the second messenger phosphatidylinositol (3,4,5)-trisphosphate (PIP3). PIP3 in turn recruits both AKT and PDK1 to the membrane, where PDK1 phosphorylates AKT at the T308 site. AKT is also phosphorylated at S473 by mTOR Complex 2 (mTORC2) as a secondary and more strongly activating phosphorylation event (10). AKT is a serine/threonine kinase that is a central regulator of cell proliferation, survival, and metabolism by phosphorylating multiple protein substrates including TSC2, FOXO proteins, eNOS, BAD and IKKα(11, 12). Phosphorylation of TSC2 by AKT inactivates its Rheb GTPase activity, leading to activation of mTOR Complex 1 (mTORC1) (13, 14). mTORC1 phosphorylates a number of downstream proteins including the S6 kinases and eIF4E binding proteins (4EBPs)(15). Together these effects lead to ribosome and protein biogenesis, cell size increase, and preparation for cell division and growth. mTORC1 phosphorylation of S6kinase and Grb10 also lead to negative feedback to diminish both PI3K and AKT activation(16 –19).
The critical role of S473-phosphorylation of AKT in its activation and the possibility that constitutive AKT might represent a major therapeutic target in a subset of NSCLC led us to pursue the following studies. We examined the frequency of constitutive activation of AKT in a large series of NSCLC cell lines, using pAKT(S473) as an indicator of AKT activation. We found that AKT activation in serum-deprived conditions is not common among lung cancer cell lines, and correlates with activating mutation in either EGFR or PIK3CA, loss of PTEN, or amplification of ERBB2. However, one NSCLC line with persistent AKT activation had none of these findings, and was examined in detail.
Materials and Methods
Reagents
Wortmannin and LY294002 were purchased from Biomol Research Laboratories (Plymouth Meeting, PA). Torin1/2and Afatinib were kindly provided by Nathanael S. Gray and Pasi A. Jänne respectively (Dana Farber Cancer Institute, MA). PP242, DAPT and PP2 were obtained from EMD Chemical (Gibbstown, NJ). Compound E was purchased from AXXORA, LLC (San Diego, CA). Dasatinib, Lapatinib and Rapamycin were obtained from LC laboratories (Woburn, MA). MK-2206 was from Selleck (Houston, TX). Cell culture media RPMI-1640 was from Cellgro (Manassas, VA) and supplements were from Invitrogen (Carlsbad, CA).
Cell culture
Eighty NSCLC cell lines were used in this study, as described previously (20). These were obtained from Matthew Meyerson 5 years ago, who fingerprinted them by SNP arrays to establish that they were unique. Fresh stocks of these cell lines were used repeatedly to avoid accumulation of clonal mutations. All cell lines were maintained in standard media as described. HCC2429, HCC15, HCC1833 and H3255 cells were maintained in RPMI-1640 supplemented with 10% FBS and 1% penicillin-streptomycin-amphotericin B (PSA), in an incubator at 37°C in 5% CO2. For serum starvation, cells were cultured in the absence of serum for 24 h.
Immunoblotting
Cells were harvested in lysis buffer consisting of 50 mM Tris-HCl (pH 7.5), 150 mM NaCl, 1% Triton X-100, 1 mM EDTA, 1 mM EGTA and a cocktail of protease inhibitors (Sigma-Aldrich). Cell lysates were clarified by centrifugation for 5 min and the protein concentration of the supernatants was determined using a modified Bradford assay (Bio-Rad, Hercules, CA). For immunoblotting, 20 μg of protein was loaded in each lane, and was separated by SDS-PAGE on 4–12% gradient gels (Invitrogen, Carlsbad, California), transferred to PVDF membranes and detected by immunoblotting with the following primary antibodies: TSC1, pAKT(S473), AKT, AKT1, AKT2, ERK, pERK(T202/Y204) GAPDH, pS6(S240/244), S6, PTEN, pSRC(Y416), SRC and cleaved caspase 3 (Cell Signaling Technology); TSC2 (Santa Cruz Biotechnology, Santa Cruz, CA); Hes1 (Chemicon, Temecula, CA). Goat anti-mouse and anti-rabbit secondary antibodies (Santa Cruz Biotechnology, Santa Cruz, CA) conjugated to horseradish peroxidase were used at a 1:3,000 dilution and immunoreactive bands were detected by chemiluminescence (SuperSignal, Pierce, Rockford, IL) and exposure to film (Denville Scientific, South Plainfield, NJ)
Immunoprecipitation
For immunoprecipitation experiments, 500 μg of clarified cell lysate were pre-absorbed with 50 μl of protein A/G Sepharose (GE Healthcare, Piscataway, NJ) for 1 h at 4°C, and then incubated overnight at 4°C with 1 μg of antibody. Immune complexes were precipitated with 50 μl of Protein A/G Sepharose for 1 h and then washed three times with lysis buffer. Immunoprecipitated proteins were eluted in Laemmli sample buffer, separated by SDS-PAGE, and immunoblotted as outlined above. For the interaction between mTOR and Raptor or Rictor, CHAPS lysis buffer (40mM HEPES (pH 7.5), 120mM NaCl, 1mM EDTA, 10mM Sodium Pyrophosphate, 10mM β-Glycerophosphate, 0.5mM Sodium orthovanadate, 0.3% 3-[(3-Cholamidopropyl)dimethylammonio]-l-propanesulfonate (CHAPS)) was used for cell lysis and immunoprecipitation buffers.
Cell viability assay
Cells were plated in sterile 96-well plates and cultured overnight. Compounds were then added in serial dilutions. Cellular viability was determined after 48 h using Vybrant® MTT Cell Proliferation Assay Kit (Invitrogen). Plates were measured on a THERMOmax microplate reader (Molecular Devices). All measurements were performed in triplicate. Cell viability is expressed as per cent of that seen in vehicle-treated control wells, and standard errors for measurements were determined.
Statistical analysis
Quantitative data are reported as the mean ± standard error of the mean (SEM) from at least three independent experiments. The means for various treatment groups were compared using analysis of variance (ANOVA) and Dunnett’s post-hoc test.
Kinome tyrosine kinase phosphorylation profiling
Luminex immunosandwich assays were performed as previously described (21)with the following modifications. Antibodies were conjugated to Luminex MagPlex microspheres (Luminex). Assays were carried out in 384-well ThermoMatrix square bottom plates (Thermo) in conjunction with a 96-well (CyBio) and a 384-well (BioMek) liquid handler. The data were acquired with a FlexMap 3D instrument (Luminex) according to the manufacturer’s instructions. The raw data were normalized by subtracting sample and antibody backgrounds. A normalized value over 10 was considered positive. Marker selection and heatmap generation were performed with GENE-E software (http://www.broadinstitute.org/cancer/software/GENE-E/).
Mutations
We performed Oncomap mutation analysis by mass spectrometry on the HCC2429 cell line, performing 1047 assays interrogating 983 unique mutations in 115 genes (22).
Ethics statement
All procedures were carried out in accordance with the Guide for the Humane Use and Care of Laboratory Animals, and the study was approved by the Animal Care and Use Committee of Children’s Hospital, Boston.
In vivo tumorigenicity
HCC2429 cells (2.5 × 10⁶) suspended in 50% Matrigel(BD Bioscience) were injected s.c. into both flanks of Scid (C.B -17) mice. When tumors were palpable (≥5 mm diameter), the mice were randomized to treatment with placebo, Dasatinib (5mg/kg), Torin2 (10mg/kg) or Dasatinib (5mg/kg) + Torin2 (10mg/kg) by oral gavage in a volume of 0.1ml for 5 days a week. The tumor size was measured three times per week with a caliper. Tumor volume was calculated with the formula: volume = (length) × (width)2/2. Relative tumor volume was calculated for each mouse for each tumor using this formula, based on tumor volume on the first day of treatment. Mice were sacrificed 12, 14, 17, and 17 days after initiation of treatment for vehicle, Dasatanib, Torin2, and combined treatment mice, respectively, as the endpoint of the therapeutic trial. A separate set of mice were used to generate tumor xenografts, and treated for 3 days only to assess biochemical effects of treatment.
Immunohistochemistry
After paraffin removal and hydration, eight micrometer paraffin sections were treated with Target Retrieval Solution pH 6.1 (Dako, Carpinteria, CA), blocked with 3% H2O2 in methanol to quench endogenous peroxidase, and then put in 5% normal goat serum in 0.1% Triton X in PBS. After slides were rinsed three times, sections were incubated with primary antibodies overnight at 4°C, washed, and incubated with secondary antibody conjugated with horseradish peroxidase (HRP). DAB Chromogen solution (Envision+System Dako) was then applied to generate a color reaction. Slides were then counterstained with hematoxylin (Dako). Antibodies used for staining were: anti-pSRC(Y416) (1:100, Cell Signaling Technology), anti-pAKT(S473) (1:100, Cell Signaling Technology), anti-pS6(S235/236)(1:100, Cell Signaling Technology).
Results
Constitutive activation of AKT in lung cancer cell lines
To elucidate the frequency and mechanisms of constitutive AKT activation in human lung cancer, we analyzed 80NSCLC cell lines (Supplemental Table 1) that we have studied previously (20). Immunoblot analysis identified 13 cell lines in which phospho-AKT at Ser473 (pAKT(S473)) levels were high in serum starved conditions indicating constitutive activation of AKT (Figure 1A–D). These cell lines had been subject to genomic characterization previously, including analysis for mutations in KRAS, EGFR, PIK3CA, PTEN and LKB1 (4) (Table 1). Six of the 13 lines with elevated pAKT(S473) levels during starvation had no expression of PTEN by immunoblotting, likely due to PTEN gene mutations, deletion, or methylation silencing (Figure 1). Three of the 13 lines had KRAS mutation, 1 had a PIK3CA mutation, 5 had EGFR mutations (Table 1) and two had HER2 amplification (Table 1, Supplemental Figure 1). One or two of these three mutations were identified in 12 of the 13 lines with constitutive AKT activation. A single line, HCC2429, had no mutations in any of these three genes. To confirm that HCC2429 had none of the common mutations in these genes, we assessed the OncoMap panel of 983 mutations in 115 genes (22), and again found no mutations of any kind. HCC2429 was established from a 34 year old, non-smoking woman, and was found to have a t(15;19)(q11;p13) translocation involving the Notch3 gene, leading to overexpression of Notch3 (23). Thus, our analysis focused on understanding the mechanism of constitutive AKT activation in HCC2429.
Figure 1. Lung cancer cell lines with high pAKT(S473) under serum starvation conditions.

A–D. Immunoblots are shown for 19 lung cancer cell lines after 24 h of serum starvation (−) or 30 min after serum addback after serum starvation (+), for multiple components of the AKT-mTOR signaling pathway. Thirteen cell lines show constitutive, high levels of pAKT(S473) during serum starvation. Six can be seen to be null (H1650, H1781, H157, HCC2935 and HCC461) or markedly reduced (H2444) in PTEN expression. Four cell lines are controls and show normal regulation of pAKT(S473) levels.
Table 1.
Histology, mutation status, and PTEN expression of 13 NSCLC lung cancer cell lines with high pAKT(S473) under serum starvation conditions.
| Histology | PTEN Mutation | PIK3CA Mutation | KRAS Mutation | EGFR Mutation | Other | PTEN Expression* | |
|---|---|---|---|---|---|---|---|
| Calu-3 | Adenocarcinoma | WT | WT | WT | WT | HER2 CN gain (50) | |
| H157 | Squamous | G251C (38) | WT | G12R (4) | WT | LKB1 LOH (51) | None |
| H820 | Adenocarcinoma | N/A | WT | WT | E746_T751del, I ins; T790M (4) | ||
| H1650 | Adenocarcinoma, Bronchoalveolar | N/A | WT | WT | E746_A750del (4) | None | |
| H1781 | Bronchoalveolar | N/A | WT | WT | WT | HER2_G776ins V (4) | None |
| H1819 | Adenocarcinoma | WT | WT | WT | WT | HER2 CN gain (50) | |
| H2444 | NSCLC | N/A | WT | G12V (4) | WT | None | |
| H3255 | Adenocarcinoma | N/A | WT | WT | L858R (4) | ||
| HCC461 | Adenocarcinoma | N/A | WT | G12D (4) | WT | None | |
| HCC2429 | NSCLC | N/A | WT | WT | WT | ||
| HCC2450 | Squamous | N/A | H1047R (4) | WT | WT | ||
| HCC2935 | Adenocarcinoma | N/A | WT | WT | E746_A750del, T751A (4) | None | |
| PC9 | Adenocarcinoma | WT | WT | WT | E746_A750del (4) |
Numbers in parentheses are reference citations. CN, copy number. N/A, not available. WT, wild type.
Observations made here (Figure 1).
AKT activation in HCC2429 is dependent on both PI3K and mTORC2
To dissect the mechanism of AKT activation in HCC2429 cells, we pursued several experimental approaches. We examined whether all three AKT isoforms were activated. HCC2429 cells expressed only two AKT isoforms, AKT1 and AKT2. Immunoprecipitation-immunoblotting experiments demonstrated that each of AKT1 and AKT2 were phosphorylated at the S473 site, suggesting that AKT activation was due to upstream effects that were not isoform specific (Figure 2AB). PI3K inhibitors LY294002 and Wortmannin completely eliminated and significantly reduced pAKT(S473)levels, respectively, independent of serum treatment, suggesting AKT activation was downstream of PI3K (Figure 2CD). These data suggest that PI3K activity was required for the activation of AKT seen in HCC2429. These observations are consistent with the current model of AKT activation in which 3-phosphoinositide levels regulate T308 phosphorylation by PDK1, which is followed by S473 phosphorylation (10, 11).
Figure 2. Both AKT1 and AKT2are activated in HCC2429 cells, effects of PI3K inhibitors.

A, B. HCC2429 cells were serum starved for 24 h or grown in regular conditions followed by immunoprecipitation with either AKT1 (A) or AKT2 (B) antibodies. Both whole cell lysates (WCL) and protein immunoprecipitates (IP) were analyzed by immunoblotting. Note that pAKT(S473) is present in IPs done for either AKT1 or AKT2.
C, D. HCC2429 cells were serum starved for 24 h or grown in regular conditions in the presence of PI3K inhibitors LY294002 (LY) or Wortmannin (Wort) for indicated time and doses. Immunoblots are shown. Note that LY294002 treatment for 24 hours caused significant cell death of serum-starved HCC2429 cells, leading to reduced protein loading in that lane (C, lane 6).
Since mTORC2 is known to be the proximate kinase which phosphorylates AKT at the S473 site (10), we examined the effects of mTORC2 inhibitors on AKT phosphorylation in HCC2429 cells. Both PP242 and Torin1, ATP-competitive inhibitors of mTOR kinase activity which inhibit both mTORC1 and mTORC2 (24, 25), completely eliminated pAKT(S473) levels in HCC2429 cells (Figure 3A). In contrast, rapamycin had more complex effects on pAKT(S473) levels (Figure 3B). pAKT(S473) was reduced slightly after 1 hour of treatment in the absence of serum, when mTORC1 inhibition of pS6(S240/244) levels was already complete. Greater reduction in pAKT(S473)levels was seen with 24 h of rapamycin treatment both with and without serum (Figure 3B). Immunoprecipitation experiments demonstrated that Raptor binding to mTOR, in mTORC1, was eliminated by an hour of rapamycin treatment at 50nM; while in contrast Rictor binding to mTOR, in mTORC2, required greater than an hour of rapamycin treatment to be significantly reduced, similar to previous observations (26). Thus, phosphorylation and activation of AKT at S473 is due to mTORC2 activity, and can be reduced by both ATP-competitive inhibitors of mTOR and long-term treatment with rapamycin.
Figure 3. AKT activation in HCC2429 is mTORC2 dependent.

A. HCC2429 cells were treated with mTOR inhibitor PP242 (2.5uM) or Torin1 (250nM) for 24 h in the presence or absence of serum, and analyzed by immunoblotting.
B. HCC2429 cells were treated with rapamycin for either 1 h or 24 h with the indicated doses in the presence or absence of serum, and analyzed by immunoblotting.
C. HCC2429 cells were treated with rapamycin for the indicated times and doses in the presence or absence of serum for 24 h followed by immunoprecipitation (IP) with mTOR antibody, and analysis by immunoblotting.
Tyrosine kinase profiling indicates that SRC and Notch pathways are highly active in HCC2429 cells
The finding that activation of AKT was PI3K-and mTORC2 -dependent in the absence of PI3KCA or AKT mutation suggested that upstream kinase activation was driving PI3K in HCC2429 cells. To screen for kinases activating AKT, we performed bead-based profiling of tyrosine kinase phosphorylation (see Methods)(21). The relative phosphorylation level of each kinase included in this assay is shown in Figure 4. Control cells that were tested in the assay included H3255 cells, which have an EGFR activating mutation, and H3255 lysates showed high values for EGFR and downstream kinases, as expected. Both Notch1 and SRC family kinases, including SRC and YES1, were highly phosphorylated in HCC2429 cells, independent of rapamycin treatment, and were enhanced to a small extent by the absence of serum (Figure 4, Supplemental Table 2). This suggested that the Notch and SRC pathways were activated in HCC2429 cells and the possibility that they contributed to the activation of AKT. As noted above, Notch3 activation was identified in HCC2429 when they were first isolated (23), so that Notch pathway activation was expected. The Notch pathway has been implicated both upstream and downstream of mTOR in previous studies (27, 28). Since rapamycin treatment had little effect on phosphorylation of these proteins in HCC2429, it seems that these phosphorylation events were independent of mTORC1 in these cells. Although several other tyrosine kinases showed some increase in phosphorylation in this assay, including HCK, ABL1, and SYK, they were not examined further because the magnitude of the change was much less than that seen for Notch1, SRC, PTK6, and YES1 (Supplemental Table 2).
Figure 4. Tyrosine kinase phosphorylation profiling of HCC2429 cells shows active SRC and Notch pathways.
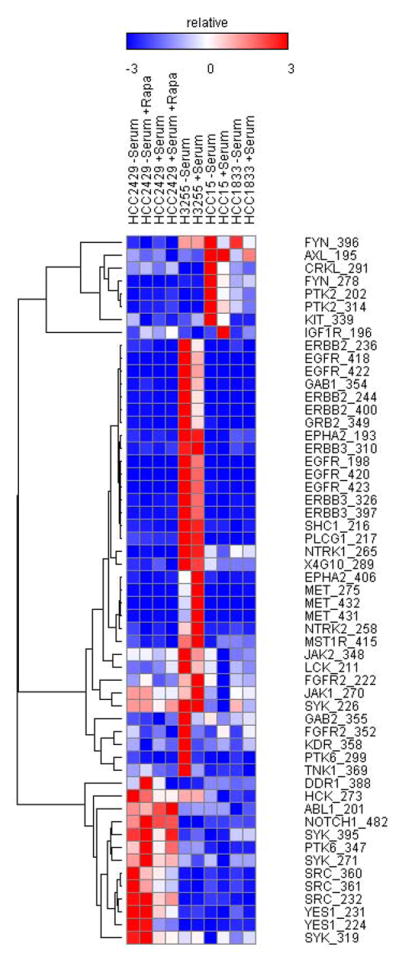
A heat map is shown for cell lysates analyzed by Luminex immunosandwich assays for phosphorylation of tyrosine kinases. Normalized results are shown with the color scale indicating relative increase or decrease in phospho-protein levels relative to controls, and expressed as the multiple of the standard deviation of the row. HCC2429, H3255, HCC15 and HCC1833 cell lines were serum starved for 24 h or maintained in regular growth media. Some HCC2429 cell preparations were also treated with rapamycin (10nM) for 24 h, as indicated.
AKT activation in HCC2429 is SRC family dependent but not Notch dependent
We then investigated whether Notch -or SRC -dependent signaling was leading to activation of PI3K-AKT pathway in HCC2429 cells. Two specific γ-secretase inhibitors, compound E(comp E) and DAPT (29), were applied to HCC2429 cells, and had no effect on levels of pAKT(S473) (Figure 5A and B). Indeed, at some doses, these compounds led to an increase in pAKT(S473) levels. Confirmation of activity of these drugs is indicated by the reduction in levels of ‘hairy and enhancer-of-split 1’ (Hes1), which is a known transcriptional target of Notch signaling (23). Furthermore, treatment with DAPT or Comp E had little or no growth inhibition effect in any of the HCC15, HCC2429, and H3255 lines (Figure 5C). These results suggested that although Notch pathway is highly active in HCC2429 cells, it is not the activator of PI3K -AKT pathway and its inhibition has no effect on cell survival.
Figure 5. AKT activation in HCC2429 is SRC- but not Notch-dependent.

A. HCC2429 cells were treated with Rapamycin (20nM) alone or together with Notch inhibitor DAPT (15uM) for 24 h in the presence or absence of serum, and cell lysates were analyzed by immunoblotting. Note that HES1 is not seen in cells treated with DAPT. pAKT(S473) shows no major change in response to DAPT.
B. HCC2429 cells were treated with Notch inhibitor Compound E at the indicated doses for 24 h in the presence or absence of serum. Note that HES1 levels are absent in cells treated with Compound E but there is no effect on pAKT(S473) levels.
C. Cells were treated with Notch inhibitor DAPT or Compound E for 48 h at the indicated doses. Cell numbers were determined by the MTT assay and normalized to untreated cells.
D–E. HCC2429 cells were treated with SRC inhibitor PP2 or Dasatinib at the indicated doses for 24 h in the absence (D) or presence (E) of serum.
F. Cells were treated with SRC inhibitor PP2 or Dasatinib for 48 h at the indicated doses. Cell numbers were determined by the MTT assay and normalized to untreated cells.
SRC tyrosine family kinases are key regulators of cellular proliferation, survival, motility and invasiveness (30). Of all of the SRC-family kinases including SRC, FYN, YES, LCK, and LYN; SRC is the one that is most often implicated in cancer. SRC can activate the PI3K-AKT pathway which is important for survival and proliferation (31). To examine the role of SRC signaling in both the elevation of pAKT(S473) levels and cell growth, we used both PP2(32), a selective inhibitor of SRC family kinases, and dasatinib, a multi-BCR/ABL and SRC family tyrosine kinase inhibitor (33). Both PP2 and dasatinib markedly reduced pAKT(S473) levels in the absence of serum in HCC2429 cells (Figure. 5D). However, the effects of these inhibitors on pAKT(S473) were less dramatic in serum (Figure. 5E), consistent with some activation of AKT by serum by a mechanism independent of SRC. Both drugs also eliminated pSRC-Y416 levels and induced cell death as shown by an increase in cleaved caspase-3 in the absence of serum. Cell growth assays showed that both drugs significantly reduced cell growth after 48 hours of treatment (Figure 5F), although many cells survived.
Note that the H3255 lung cancer cell line was even more sensitive to SRC inhibitor treatment than HCC2429 cells (Figure 5F). H3255 cells have the EGFR L858R activating mutation, and similar to other EGFR and ERBB2 mutant cell lines show constitutive phosphorylation of ERK1/2 (Supplemental Figure 2A). They also show high level phosphorylation of SRC, like HCC2429 cells, and marked response to dasatinib treatment with loss of pSRC, pAKT, and pERK (Supplemental Figure 2B). Similar observations have been made previously on SRC activation and inhibitor sensitivity in EGFR mutant lung cancer cell lines (34). These results are consistent with the apoptotic effect of EGFR inhibitor Lapatinib or Gefitinib on EGFR-dependent H3255 lung cancer cells (Supplemental Figure 3B). However, EGFR inhibitors had no effects on either pAKT levels (Supplemental Figure 3A) or cell viability (Supplemental Figure 3B) in HCC2429 cells, suggesting that SRC inhibitors reduced pAKT levels and cell survival independent of EGFR in HCC2429 cells.
To summarize, our data indicate that activation of the PI3K -AKT pathway in HCC2429 cells was SRC-but not Notch -dependent, and that SRC inhibition reduced growth of these cells.
SRC and mTOR inhibition in HCC2429 synergistically inactivate AKT and reduce cell survival
Although SRC overexpression and activation commonly occur in NSCLC, SRC inhibitors alone have had relatively poor results in NSCLC clinical trials (35). Cell lines with EGFR mutations are particularly sensitive to SRC inhibition in vitro (36). For these reasons, as well as the partial growth inhibition seen with dasatinib, we explored combination treatment for the HCC2429 line. We chose to combine the SRC inhibitors with Torin1, since it is a specific catalytic site inhibitor of mTORC2 (25)and reduces AKT phosphorylation substantially (Figure 3).
At lower doses, PP2, Dasatinib, and Torin1 alone only partially decreased pAKT(S473) levels. However, the combination of Torin1 with either PP2 or Dasatinib completely eliminated pAKT(S473) levels in HCC2429 cells (Figure 6A). Concordant with the pAKT(S473) effect, the combination treatments caused a more striking reduction in cell numbers than either drug alone in HCC2429 cells (as well as H3255 cells) (Figure 6B and C). Combination treatment also induced apoptosis more strongly than individual drugs, as indicated by increased cleaved caspase 3 (Figure 6A). In contrast, there was no synergy among these drugs for the HCC15 cells, although Torin1 had some effect. Since mTOR kinase inhibitors are still in early phase clinical trials, we also examined whether rapamycin or everolimus, FDA-approved compounds, might have similar effects on the growth of HCC2429 cells. Indeed, both of these mTORC1 inhibitors had similar effects in reducing viability of HCC2429 cells when applied in combination with Dasatinib (Supplemental Figure 4).
Figure 6. SRC inhibitors and Torin1 synergistically inactivate AKT and reduce cell survival.
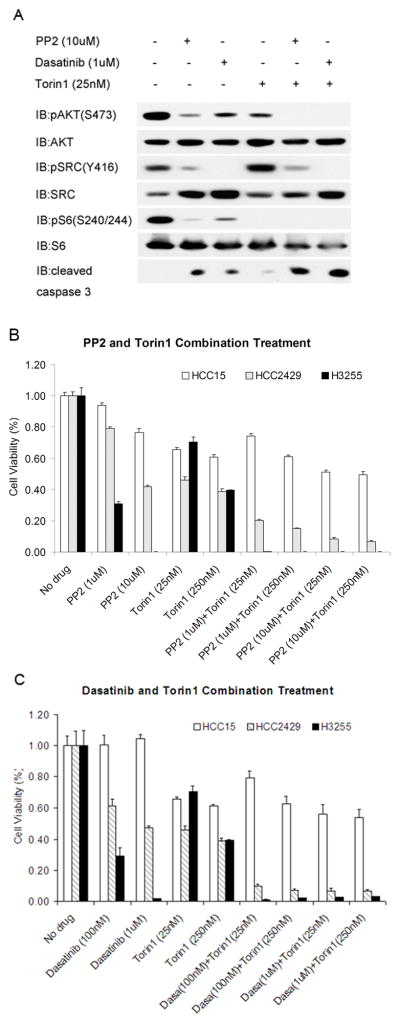
A. HCC2429 cells were treated with SRC inhibitors PP2 (10uM), Dasatinib (1uM), and mTOR inhibitor Torin1 (25nM), or combinations of these drugs for 24 h in the absence of serum, and analyzed by immunoblotting.
B–C. HCC2429, HCC15, and H3255 cells were treated with SRC inhibitor PP2 (B) or Dasatinib (C) together with mTOR inhibitor Torin1 for 48 h at the indicated doses. Cell numbers were determined by the MTT assay and normalized to untreated cells.
We then examined the benefit of these drugs in vivo using HCC2429 xenografts. Although each of Dasatanib and Torin2 delayed tumor growth in this system, combination treatment with the two drugs had a greater effect (Figure 7A –D). To confirm that these drugs were hitting their intended molecular targets in these mice, immunohistochemistry staining was performed. Levels of pSRC(Y416) were marked reduced in HCC2429 tumors from mice treated with Dasatinib, and were not changed in mice treated with Torin2. Levels of pAKT(S473) and pS6(S235/236) were somewhat decreased in mice treated with either Dasatinib or Torin2 alone, but were more strongly reduced in mice treated with a combination of both drugs (Figure 7E). Thus, combination treatment with SRC and mTOR inhibitors synergistically reduced HCC2429 tumor cell growth in vivo.
Figure 7. Synergistic effects of Dasatinib and mTOR inhibitors on HCC2429 xenografts.

HCC2429 cells were injected into both flanks of Scid (C.B-17) mice to generate tumors. When tumors were palpable, mice were treated with Placebo, Dasatinib (5mg/kg), Torin2 (10mg/kg) or Dasatinib(5mg/kg) + Torin2 (10mg/kg) by oral gavage 5 days a week. N = 3 – 5 mice per treatment group. Mice were sacrificed 12, 14, 17, and 17 days after initiation of treatment for vehicle, Dasatanib, Torin2, and combined treatment mice, respectively.
A. Representative HCC2429 xenograft tumors.
B. Relative tumor volume during treatment.
C. Tumor weight at the end of treatment.
D. Tumor volume at the end of treatment.
E. IHC staining for pSRC(Y416), pAKT(S473), and pS6(S240/244)after 3 days of treatment, in a separate set of Scid mice.
Discussion
Here we report the analysis of AKT phosphorylation and activation in 80 NSCLC cell lines. We found persistent elevated levels of pAKT(S473), the site of phosphorylation by mTORC2, during serum starvation, in 13 cell lines. Previous studies have shown that phosphorylation of AKT at the S473 site correlates with AKT kinase activity in in vitro studies, including in lung cancer cell lines (37). We found AKT activation without serum in the minority of cell lines studied, 13 of 80 (16%) in marked contrast to an earlier report (16 of 17 (94%)) (37). We suspect that this difference may be attributed to our more stringent serum deprivation (24 hours vs. overnight) and the complete lack of serum (0% vs. 0.1%) in comparison to the previous study (37). The cell lines examined in our study were also different from those studied previously.
Twelve of the 13 cell lines had genetic findings that explained their constitutive activation of AKT: either activating mutation in EGFR or PIK3CA, amplification and activation of ERBB2, or complete loss of expression of PTEN. These observations are consistent with extensive previous studies on the effects of these various genetic lesions on this pathway (38). These genetic effects are also targeted by compounds currently in use or development for clinical application to treatment of patients whose tumors have these defects.
Thus, we focused on the mechanism of activation of AKT in the HCC2429 cell line, for which there was neither genetic nor other evidence of activating mutation in EGFR, PIK3CA, or AKT, and in which the expression of PTEN was abundant. Tyrosine kinase activity profiling led to the identification of activation of Notch and SRC pathways in HCC2429 cells. While Notch inhibition had little effect on pAKT(S473) levels or on growth or survival of these cells, SRC inhibition with dasatinib or PP242 led to significant growth inhibition. Furthermore, combined treatment with either of those compounds and any of four different mTOR inhibitors, both rapalogues or ATP-competitive mTOR kinase inhibitors, led to synergistic reduction in pAKT(S473) levels, growth inhibition, and cell death (Figure 6, Supplemental Figure 4). Furthermore the combination of Torin2 and dasatanib led to synergistic reduction in tumor growth in vivo (Figure 7).
The HCC2429 cell line was originally derived from a 34-year-old non-smoking woman with adenocarcinoma of the lung (23), and has been subject to extensive studies. It was originally described as having a t(15;19) translocation which activated theNotch3 gene. Subsequent studies indicated that knock down of Notch 3 by siRNA led to a decrease in AKT activation in HCC2429 cells (23). In contrast, we found that although there was activation of the Notch pathway in these cells, assessed by expression of Hes1, inhibition of the Notch pathway by DAPT or Compound E had no effect on pAKT levels in either the absence or the presence of serum (Figure 5). The relationship between the Notch pathway and the AKT-mTOR singaling cascade has been studied with conflicting conclusions about whether Notch is upstream or downstream to AKT-mTOR (27, 28, 39). However, in the HCC2429 cells, our findings suggest that the Notch pathway is parallel to PI3K-AKT-mTOR.
The non-receptor protein tyrosine kinase SRC plays a crucial role in signal transduction pathways involved in cell division, motility, adhesion, and survival in both normal and cancer cells(30, 40). Overexpression of the SRC protein and an increase in its specific activity have been observed in numerous cancer types (41). In NSCLC, 123 of 370 (33%) of biopsy samples showed expression of pSRC (Y416) by immunohistochemical analysis (34).
SRC can be activated by receptor tyrosine kinases including the EGFR receptor. SRC can also be activated by interaction with viral proteins, although there is no evidence for this occurrence in human cancer. There is only one naturally occurring activating mutation of SRC that has been identified (Q531*), despite large scale human genome sequencing projects. This mutation results in truncation and deregulated activation of the SRC protein, but is rare, being seen in only 1% of all colorectal cancer and never reported in other common malignancies (42).
SRC can activate the PI3K-AKT, MAPK, and JAK-STAT signaling pathways that are critical for cell cycle progression, survival, and proliferation (31). How SRC is activated in HCC2429 cells requires further investigation. Although SRC can activate the MAPK pathway, there was no detectable phospho-ERK1/2 in HCC2429 cells under serum starvation conditions (Supplemental Figure 2A), suggesting that PI3K-AKT is the major pathway downstream of SRC which contributes to tumorigenesis in this cell line.
Dasatinib is an oral multi-BCR/ABL and SRC family tyrosine kinase inhibitor approved for use in patients with chronic myelogenous leukemia after imatinib treatment and for Philadelphia chromosome-positive acute lymphoblastic leukemia. It is being evaluated for use in numerous other cancers, including advanced lung cancer. However, a recent phase II clinical trial found that dasatinib as a single agent had modest clinical activity (35). Dasatinib arrests cell growth of lung cancer lines expressing wild type or EGFR mutants that are resistant to EGFR inhibition. The combination of SRC inhibitor and EGFR inhibitor synergistically enhanced apoptosis in EGFR-dependent lung cancer cells, but had modest effects in EGFR-independent cells (34). However, dasatinib was shown to have no benefit when added to erlotinib treatment in lung cancer patients with acquired resistance to erlotinib (43).
mTOR is involved in protein synthesis, cell proliferation, and survival in cancer cells, and upstream signaling proteins that activate mTOR are often mutated in lung cancer, including EGFR, KRAS, PI3K, LKB1, PTEN, and AKT (4, 38, 44). Rapalogues, including temsirolimus and everolimus, that are allosteric inhibitors ofmTORC1 through FKBP12 are in current clinical use for treatment of advanced renal cell carcinoma (45). The combination of mTOR inhibitors with other therapeutic agents often has synergistic effects in tumor growth inhibition in experimental models (46, 47). Our findings suggest that mTOR catalytic site inhibitors are potentially better drugs than rapamycin and analogues, through stronger and more direct inhibition of both mTORC1 and mTORC2, as well as dephosphorylation of 4E-BP1 which is not affected by rapamycin (48). Further, our findings suggest that combination treatment including agents targeting kinases can be an effective strategy for lung cancer treatment. Given that SRC activation is common (~33%) in human lung cancer patients (34), a combination of a SRC and an mTOR inhibitor may be of significant benefit for a subset of these patients. Dasatinib has been shown to have a Cmax in the serum of 175nM in humans following a single dose (49), suggesting it could inhibit SRC effectively.
Although the EGFR mutant cell line H3255 showed a dramatic response to dasatinib treatment (Figure 5F), treatment of lung cancer patients with EGFR mutation and acquired resistance to erlotinib with dasatinib showed no benefit (43), suggesting caution in translation of these findings to human subjects.
Supplementary Material
Acknowledgments
We thank Dr. Nathanael S. Gray and Pasi A. Janne (Dana Farber Cancer Institute, MA) for providing mTOR inhibitors Torin1 and Torin2, and HER2 inhibitor Afatinib used in this study. We thank Jian Ma for initial experime nts that led to these studies.
Grant Support
This work was supported by NIH NCI 1P01CA120964.
Footnotes
Conflict of interest. None.
References
- 1.Jemal A, Siegel R, Ward E, Hao Y, Xu J, Murray T, et al. Cancer statistics, 2008. CA Cancer J Clin. 2008;58(2):71–96. doi: 10.3322/CA.2007.0010. [DOI] [PubMed] [Google Scholar]
- 2.Sos ML, Michel K, Zander T, Weiss J, Frommolt P, Peifer M, et al. Predicting drug susceptibility of non-small cell lung cancers based on genetic lesions. J Clin Invest. 2009;119(6):1727–40. doi: 10.1172/JCI37127. [DOI] [PMC free article] [PubMed] [Google Scholar]
- 3.Ding L, Getz G, Wheeler DA, Mardis ER, McLellan MD, Cibulskis K, et al. Somatic mutations affect key pathways in lung adenocarcinoma. Nature. 2008;455(7216):1069–75. doi: 10.1038/nature07423. [DOI] [PMC free article] [PubMed] [Google Scholar]
- 4.Thomas RK, Baker AC, Debiasi RM, Winckler W, Laframboise T, Lin WM, et al. High-throughput oncogene mutation profiling in human cancer. Nat Genet. 2007;39(3):347–51. doi: 10.1038/ng1975. [DOI] [PubMed] [Google Scholar]
- 5.Weir BA, Woo MS, Getz G, Perner S, Ding L, Beroukhim R, et al. Characterizing the cancer genome in lung adenocarcinoma. Nature. 2007;450(7171):893–8. doi: 10.1038/nature06358. [DOI] [PMC free article] [PubMed] [Google Scholar]
- 6.Ji H, Ramsey MR, Hayes DN, Fan C, McNamara K, Kozlowski P, et al. LKB1 modulates lung cancer differentiation and metastasis. Nature. 2007;448(7155):807–10. doi: 10.1038/nature06030. [DOI] [PubMed] [Google Scholar]
- 7.Li J, Yen C, Liaw D, Podsypanina K, Bose S, Wang SI, et al. PTEN, a putative protein tyrosine phosphatase gene mutated in human brain, breast, and prostate cancer. Science. 1997;275(5308):1943–7. doi: 10.1126/science.275.5308.1943. [DOI] [PubMed] [Google Scholar]
- 8.Steck PA, Pershouse MA, Jasser SA, Yung WK, Lin H, Ligon AH, et al. Identification of a candidate tumour suppressor gene, MMAC1, at chromosome 10q23.3 that is mutated in multiple advanced cancers. Nat Genet. 1997;15(4):356–62. doi: 10.1038/ng0497-356. [DOI] [PubMed] [Google Scholar]
- 9.Whitman M, Downes CP, Keeler M, Keller T, Cantley L. Type I phosphatidylinositol kinase makes a novel inositol phospholipid, phosphatidylinositol-3-phosphate. Nature. 1988;332(6165):644–6. doi: 10.1038/332644a0. [DOI] [PubMed] [Google Scholar]
- 10.Sarbassov DD, Guertin DA, Ali SM, Sabatini DM. Phosphorylation and regulation of Akt/PKB by the rictor-mTOR complex. Science. 2005;307(5712):1098–101. doi: 10.1126/science.1106148. [DOI] [PubMed] [Google Scholar]
- 11.Manning BD, Cantley LC. AKT/PKB signaling: navigating downstream. Cell. 2007;129(7):1261–74. doi: 10.1016/j.cell.2007.06.009. [DOI] [PMC free article] [PubMed] [Google Scholar]
- 12.Xu CX, Jin H, Shin JY, Kim JE, Cho MH. Roles of protein kinase B/Akt in lung cancer. Front Biosci (Elite Ed) 2010;2:1472–84. doi: 10.2741/e206. [DOI] [PubMed] [Google Scholar]
- 13.Inoki K, Li Y, Zhu T, Wu J, Guan KL. TSC2 is phosphorylated and inhibited by Akt and suppresses mTOR signalling. Nat Cell Biol. 2002;4(9):648–57. doi: 10.1038/ncb839. [DOI] [PubMed] [Google Scholar]
- 14.Potter CJ, Pedraza LG, Xu T. Akt regulates growth by directly phosphorylating Tsc2. Nat Cell Biol. 2002;4(9):658–65. doi: 10.1038/ncb840. [DOI] [PubMed] [Google Scholar]
- 15.Zoncu R, Efeyan A, Sabatini DM. mTOR: from growth signal integration to cancer, diabetes and ageing. Nat Rev Mol Cell Biol. 2011;12(1):21–35. doi: 10.1038/nrm3025. [DOI] [PMC free article] [PubMed] [Google Scholar]
- 16.Yu Y, Yoon SO, Poulogiannis G, Yang Q, Ma XM, Villen J, et al. Phosphoproteomic analysis identifies Grb10 as an mTORC1 substrate that negatively regulates insulin signaling. Science. 2011;332(6035):1322–6. doi: 10.1126/science.1199484. [DOI] [PMC free article] [PubMed] [Google Scholar]
- 17.Hsu PP, Kang SA, Rameseder J, Zhang Y, Ottina KA, Lim D, et al. The mTOR-regulated phosphoproteome reveals a mechanism of mTORC1-mediated inhibition of growth factor signaling. Science. 2011;332(6035):1317–22. doi: 10.1126/science.1199498. [DOI] [PMC free article] [PubMed] [Google Scholar]
- 18.Harrington LS, Findlay GM, Gray A, Tolkacheva T, Wigfield S, Rebholz H, et al. The TSC1-2 tumor suppressor controls insulin -PI3K signaling via regulation of IRS proteins. J Cell Biol. 2004;166(2):213–23. doi: 10.1083/jcb.200403069. [DOI] [PMC free article] [PubMed] [Google Scholar]
- 19.Zhang H, Bajraszewski N, Wu E, Wang H, Moseman AP, Dabora SL, et al. PDGFRs are critical for PI3K/Akt activation and negatively regulated by mTOR. J Clin Invest. 2007;117(3):730–8. doi: 10.1172/JCI28984. [DOI] [PMC free article] [PubMed] [Google Scholar]
- 20.Liang MC, Ma J, Chen L, Kozlowski P, Qin W, Li D, et al. TSC1 loss synergizes with KRAS activation in lung cancer development in the mouse and confers rapamycin sensitivity. Oncogene. 2010;29(11):1588–97. doi: 10.1038/onc.2009.452. [DOI] [PMC free article] [PubMed] [Google Scholar]
- 21.Du J, Bernasconi P, Clauser KR, Mani DR, Finn SP, Beroukhim R, et al. Bead-based profiling of tyrosine kinase phosphorylation identifies SRC as a potential target for glioblastoma therapy. Nat Biotechnol. 2009;27(1):77–83. doi: 10.1038/nbt.1513. [DOI] [PMC free article] [PubMed] [Google Scholar]
- 22.MacConaill LE, Campbell CD, Kehoe SM, Bass AJ, Hatton C, Niu L, et al. Profiling critical cancer gene mutations in clinical tumor samples. PLoS One. 2009;4(11):e7887. doi: 10.1371/journal.pone.0007887. [DOI] [PMC free article] [PubMed] [Google Scholar]
- 23.Dang TP, Gazdar AF, Virmani AK, Sepetavec T, Hande KR, Minna JD, et al. Chromosome 19 translocation, overexpression of Notch3, and human lung cancer. J Natl Cancer Inst. 2000;92(16):1355–7. doi: 10.1093/jnci/92.16.1355. [DOI] [PubMed] [Google Scholar]
- 24.Feldman ME, Apsel B, Uotila A, Loewith R, Knight ZA, Ruggero D, et al. Active-site inhibitors of mTOR target rapamycin-resistant outputs of mTORC1 and mTORC2. PLoS Biol. 2009;7(2):e38. doi: 10.1371/journal.pbio.1000038. [DOI] [PMC free article] [PubMed] [Google Scholar]
- 25.Thoreen CC, Kang SA, Chang JW, Liu Q, Zhang J, Gao Y, et al. An ATP-competitive mammalian target of rapamycin inhibitor reveals rapamycin-resistant functions of mTORC1. J Biol Chem. 2009;284(12):8023–32. doi: 10.1074/jbc.M900301200. [DOI] [PMC free article] [PubMed] [Google Scholar]
- 26.Sarbassov DD, Ali SM, Sengupta S, Sheen JH, Hsu PP, Bagley AF, et al. Prolonged rapamycin treatment inhibits mTORC2 assembly and Akt/PKB. Mol Cell. 2006;22(2):159–68. doi: 10.1016/j.molcel.2006.03.029. [DOI] [PubMed] [Google Scholar]
- 27.Efferson CL, Winkelmann CT, Ware C, Sullivan T, Giampaoli S, Tammam J, et al. Downregulation of Notch pathway by a gamma-secretase inhibitor attenuates AKT/mammalian target of rapamycin signaling and glucose uptake in an ERBB2 transgenic breast cancer model. Cancer Res. 2010;70(6):2476–84. doi: 10.1158/0008-5472.CAN-09-3114. [DOI] [PubMed] [Google Scholar]
- 28.Ma J, Meng Y, Kwiatkowski DJ, Chen X, Peng H, Sun Q, et al. Mammalian target of rapamycin regulates murine and human cell differentiation through STAT3/p63/Jagged/Notch cascade. J Clin Invest. 2010;120(1):103–14. doi: 10.1172/JCI37964. [DOI] [PMC free article] [PubMed] [Google Scholar]
- 29.Morohashi Y, Kan T, Tominari Y, Fuwa H, Okamura Y, Watanabe N, et al. C -terminal fragment of presenilin is the molecular target of a dipeptidic gamma-secretase-specific inhibitor DAPT (N-[N-(3,5-difluorophenacetyl)-L-alanyl]-S-phenylglycine t-butyl ester) J Biol Chem. 2006;281(21):14670–6. doi: 10.1074/jbc.M513012200. [DOI] [PubMed] [Google Scholar]
- 30.Yeatman TJ. A renaissance for SRC. Nat Rev Cancer. 2004;4(6):470–80. doi: 10.1038/nrc1366. [DOI] [PubMed] [Google Scholar]
- 31.Lu Y, Yu Q, Liu JH, Zhang J, Wang H, Koul D, et al. Src family protein-tyrosine kinases alter the function of PTEN to regulate phosphatidylinositol 3-kinase/AKT cascades. J Biol Chem. 2003;278(41):40057–66. doi: 10.1074/jbc.M303621200. [DOI] [PubMed] [Google Scholar]
- 32.Hanke JH, Gardner JP, Dow RL, Changelian PS, Brissette WH, Weringer EJ, et al. Discovery of a novel, potent, and Src family-selective tyrosine kinase inhibitor. Study of Lck-and FynT -dependent T cell activation. J Biol Chem. 1996;271(2):695–701. doi: 10.1074/jbc.271.2.695. [DOI] [PubMed] [Google Scholar]
- 33.Kantarjian H, Jabbour E, Grimley J, Kirkpatrick P. Dasatinib. Nat Rev Drug Discov. 2006;5(9):717–8. doi: 10.1038/nrd2135. [DOI] [PubMed] [Google Scholar]
- 34.Zhang J, Kalyankrishna S, Wislez M, Thilaganathan N, Saigal B, Wei W, et al. SRC-family kinases are activated in non-small cell lung cancer and promote the survival of epidermal growth factor receptor-dependent cell lines. Am J Pathol. 2007;170(1):366–76. doi: 10.2353/ajpath.2007.060706. [DOI] [PMC free article] [PubMed] [Google Scholar]
- 35.Johnson FM, Bekele BN, Feng L, Wistuba I, Tang XM, Tran HT, et al. Phase II study of dasatinib in patients with advanced non-small-cell lung cancer. J Clin Oncol. 2010;28(30):4609–15. doi: 10.1200/JCO.2010.30.5474. [DOI] [PMC free article] [PubMed] [Google Scholar]
- 36.Song L, Morris M, Bagui T, Lee FY, Jove R, Haura EB. Dasatinib (BMS-354825) selectively induces apoptosis in lung cancer cells dependent on epidermal growth factor receptor signaling for survival. Cancer Res. 2006;66(11):5542–8. doi: 10.1158/0008-5472.CAN-05-4620. [DOI] [PubMed] [Google Scholar]
- 37.Brognard J, Clark AS, Ni Y, Dennis PA. Akt/protein kinase B is constitutively active in non-small cell lung cancer cells and promotes cellular survival and resistance to chemotherapy and radiation. Cancer Res. 2001;61(10):3986–97. [PubMed] [Google Scholar]
- 38.Blanco R, Iwakawa R, Tang M, Kohno T, Angulo B, Pio R, et al. A gene-alteration profile of human lung cancer cell lines. Hum Mutat. 2009;30(8):1199–206. doi: 10.1002/humu.21028. [DOI] [PMC free article] [PubMed] [Google Scholar]
- 39.Chan SM, Weng AP, Tibshirani R, Aster JC, Utz PJ. Notch signals positively regulate activity of the mTOR pathway in T-cell acute lymphoblastic leukemia. Blood. 2007;110(1):278–86. doi: 10.1182/blood-2006-08-039883. [DOI] [PMC free article] [PubMed] [Google Scholar]
- 40.Thomas SM, Brugge JS. Cellular functions regulated by Src family kinases. Annu Rev Cell Dev Biol. 1997;13:513–609. doi: 10.1146/annurev.cellbio.13.1.513. [DOI] [PubMed] [Google Scholar]
- 41.Irby RB, Yeatman TJ. Role of Src expression and activation in human cancer. Oncogene. 2000;19(49):5636–42. doi: 10.1038/sj.onc.1203912. [DOI] [PubMed] [Google Scholar]
- 42.Irby RB, Mao W, Coppola D, Kang J, Loubeau JM, Trudeau W, et al. Activating SRC mutation in a subset of advanced human colon cancers. Nat Genet. 1999;21(2):187–90. doi: 10.1038/5971. [DOI] [PubMed] [Google Scholar]
- 43.Johnson ML, Riely GJ, Rizvi NA, Azzoli CG, Kris MG, Sima CS, et al. Phase II trial of dasatinib for patients with acquired resistance to treatment with the epidermal growth factor receptor tyrosine kinase inhibitors erlotinib or gefitinib. J Thorac Oncol. 2011;6(6):1128–31. doi: 10.1097/JTO.0b013e3182161508. [DOI] [PMC free article] [PubMed] [Google Scholar]
- 44.Courtney KD, Corcoran RB, Engelman JA. The PI3K pathway as drug target in human cancer. J Clin Oncol. 2010;28(6):1075–83. doi: 10.1200/JCO.2009.25.3641. [DOI] [PMC free article] [PubMed] [Google Scholar]
- 45.Ma WW, Adjei AA. Novel agents on the horizon for cancer therapy. CA Cancer J Clin. 2009;59(2):111–37. doi: 10.3322/caac.20003. [DOI] [PubMed] [Google Scholar]
- 46.Wang MY, Lu KV, Zhu S, Dia EQ, Vivanco I, Shackleford GM, et al. Mammalian target of rapamycin inhibition promotes response to epidermal growth factor receptor kinase inhibitors in PTEN-deficient and PTEN-intact glioblastoma cells. Cancer Res. 2006;66(16):7864–9. doi: 10.1158/0008-5472.CAN-04-4392. [DOI] [PubMed] [Google Scholar]
- 47.Jiang BH, Liu LZ. Role of mTOR in anticancer drug resistance: perspectives for improved drug treatment. Drug Resist Updat. 2008;11(3):63–76. doi: 10.1016/j.drup.2008.03.001. [DOI] [PMC free article] [PubMed] [Google Scholar]
- 48.Choo AY, Yoon SO, Kim SG, Roux PP, Blenis J. Rapamycin differentially inhibits S6Ks and 4E-BP1 to mediate cell-type-specific repression of mRNA translation. Proc Natl Acad Sci U S A. 2008;105(45):17414–9. doi: 10.1073/pnas.0809136105. [DOI] [PMC free article] [PubMed] [Google Scholar]
- 49.Furlong MT, Agrawal S, Hawthorne D, Lago M, Unger S, Krueger L, et al. A validated LC-MS/MS assay for the simultaneous determination of the anti-leukemic agent dasatinib and two pharmacologically active metabolites in human plasma: application to a clinical pharmacokinetic study. J Pharm Biomed Anal. 2012;58:130–5. doi: 10.1016/j.jpba.2011.09.008. [DOI] [PubMed] [Google Scholar]
- 50.Engelman JA, Zejnullahu K, Gale CM, Lifshits E, Gonzales AJ, Shimamura T, et al. PF00299804, an irreversible pan-ERBB inhibitor, is effective in lung cancer models with EGFR and ERBB2 mutations that are resistant to gefitinib. Cancer Res. 2007;67(24):11924–32. doi: 10.1158/0008-5472.CAN-07-1885. [DOI] [PubMed] [Google Scholar]
- 51.Zhong D, Guo L, de Aguirre I, Liu X, Lamb N, Sun SY, et al. LKB1 mutation in large cell carcinoma of the lung. Lung Cancer. 2006;53(3):285–94. doi: 10.1016/j.lungcan.2006.05.018. [DOI] [PubMed] [Google Scholar]
Associated Data
This section collects any data citations, data availability statements, or supplementary materials included in this article.