Abstract
The objective of this study was to measure the velocity of the superior surface of human vocal folds during phonation using laser Doppler vibrometry (LDV). A custom-made endoscopic laser beam deflection unit was designed and fabricated. An in vivo clinical experimental procedure was developed to simultaneously collect LDV velocity and video from videolaryngoscopy. The velocity along the direction of the laser beam, i.e., the inferior-superior direction, was captured. The velocity was synchronous with electroglottograph and sound level meter data. The vibration energy of the vocal folds was determined to be significant up to a frequency of 3 kHz. Three characteristic vibrational waveforms were identified which may indicate bifurcations between vibrational modes of the mucosal wave. No relationship was found between the velocity amplitude and phonation frequency or sound pressure level. A correlation was found between the peak-to-peak displacement amplitude and phonation frequency. A sparse map of the velocity amplitudes on the vocal fold surface was obtained.
INTRODUCTION
Essential to studying vocal fold mechanics is the development of methods to measure their vibratory response in vivo to obtain highly detailed kinematic information. The vibratory response of the tissue may be useful to indirectly evaluate, using dynamic models, the viscoelastic properties of the tissue.
A general overview of vocal fold movement is given by Baer.1 On the superior surface, a wave propagates consisting of inferior-superior and medial-lateral displacement components and is called the mucosal wave. This wave is considered as a sign of healthy tissue.2 Studies by Berry and Doellinger show that suture points on the vocal fold surface oscillate in an elliptical pattern and appear to be predominantly due to the mucosal wave.3, 4, 5, 6
Laser Doppler vibrometry (LDV) is a well-established tool for single-point displacement, velocity, or acceleration measurements of a vibrating body.7 This method has been used for non-contact vibration measurements within the automotive, aerospace, biomedical, and acoustics industries.8, 9, 10
For vocal fold velocity measurements, LDV can measure the inferior-superior vibrations and has advantages over standard and high-speed videoendoscopy. It yields online quantitative data, in contrast with qualitative video data that require further image analysis. The high sampling rate that can be achieved with LDV also yields highly time-resolved data at one location. Sampling rates are up to 100 kHz or greater, depending on the data acquisition system used. In comparison, high-speed videoendoscopy has been mostly limited to sampling frequencies up to 4000 Hz.11, 12, 13, 14
LDV has not yet been used for in vivo human vocal fold measurements, but it has been used to obtain data in excised larynges. Kobayashi used LDV to measure the vibration amplitude of excised canine larynges in the framework of a study of unilaterally atrophied larynges.15 The lateral and vertical displacements of normal larynges were compared to those with severed unilateral recurrent laryngeal nerves. The displacement amplitudes of the atrophied vocal folds were larger than those of normal vocal folds.
Other laser-based techniques have been used for vocal fold vibration measurements. Manneberg et al. used laser triangulation to determine the vertical amplitude of human vocal fold vibrations in vivo.16 Several voice types, utterances, amplitudes, and pitches were investigated. The vibration amplitude was found to be ∼1 mm along the inferior-superior direction. Using a method similar to laser triangulation, George et al. utilized laser line triangulation to develop a method called depth-kymography.11 This method added a third dimension, the superior-inferior axis of vibration, to the kymogram imaging technique.17 With this technique, they reported findings of vertical and horizontal vibration amplitudes, opening and closing velocities, and mucosal wave propagation. Luegmair et al. used high-speed imaging and a projected laser grid on the vocal folds to reconstruct the 3D vocal fold surface by triangulation.18 Using this method on an excised porcine larynx and a synthetic silicon vocal fold model, they tracked the time-varying motion of the vocal folds and determined parameters such as the maximum vertical and horizontal amplitude and mucosal wave velocity. Using a laser optoreflectometry technique,19 Garrel et al. investigated the resonance properties of excised porcine vocal folds.20 Vibrations were induced electromagnetically with magnets attached to the vocal folds. Two resonance frequencies were identified when the folds were driven with one magnet. The addition of a second magnet resulted in the identification of only one resonance frequency.
Berry and Doellinger and co-workers investigated the medial-lateral and inferior-superior motion of the vocal folds using image processing methods.3, 4, 5, 6 They used an excised canine hemi-larynx attached to an air flow supply system. Microsutures on the medial surface were tracked using high-speed imaging. The vocal fold oscillations were investigated over a range of phonatory conditions and subglottal pressures. From the velocity data obtained at discrete locations, the mucosal wave motion was synthesized and the mode shapes were measured. It was found that two eigenfunctions were sufficient to capture 98% of the vocal fold vibration energy.3
In a related study, the response of a human larynx was investigated over a range of phonatory conditions.5 Variations in laryngeal tensions were produced by applying external forces to the cartilages. Different glottal airflows were used and the motion of the medial surface and sections of the superior surface was tracked. The first and second eigenfunctions captured most of the vibration dynamics. Dynamic properties such as the fundamental frequency and the mode shapes were affected by airflow, subglottal pressure, anterior-posterior elongation forces, and medial adduction forces.6 Displacements, velocities, and accelerations of the mucosal wave were obtained. These results support earlier findings that the phonatory airflow changed the vocal fold frequency of vibration. Non-linear coupling of the aerodynamic forces can result in eigenmode entrainment, where a shift in the natural frequencies occurs.21, 22
The objective of this study was to develop an LDV method to measure the vocal fold inferior-superior vibration velocity of live human subjects during phonation. This included the design and construction of a custom endoscopic laser beam deflection unit to redirect the laser beam toward the vocal folds. To verify the periodicity, fundamental frequency, and harmonic content of the signal, the velocity signals were recorded online simultaneously with signals from an electroglottograph (EGG) and a sound level meter (SLM).
METHODS
Experimental setup
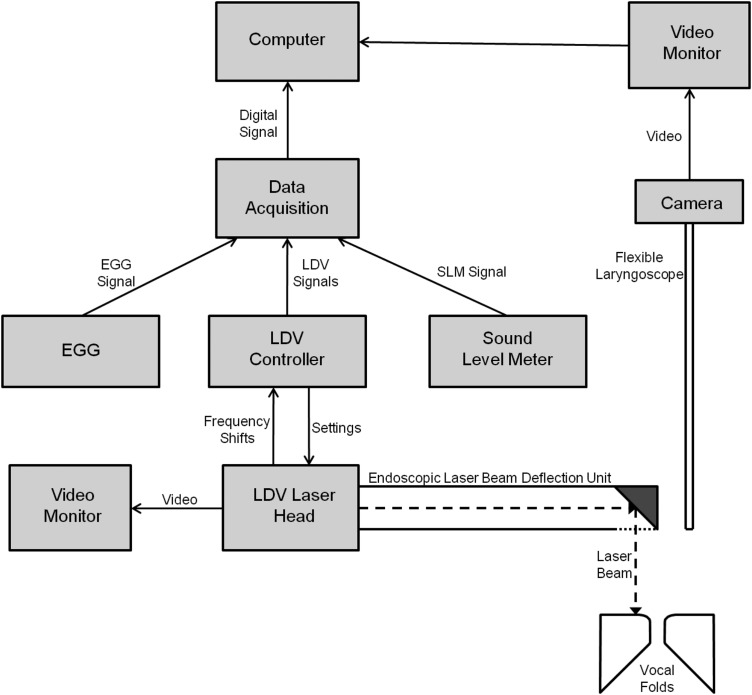
The clinical experiments were performed at the Montreal General Hospital Voice Clinic. A schematic diagram of the experimental setup is shown in Fig. 1. Input devices included a laser Doppler vibrometer [Polytec OFV-5000 controller and Polytec OFV-534 laser head (Waldbronn, Baden-Württemberg, Germany)], an EGG [Glottal Enterprises EG-2 (Syracuse, NY)], and a SLM (RadioShack, Fort Worth, TX). The signals were simultaneously passed to a National Instruments (Austin, TX) data acquisition system (NI cDAQ 9172 chassis with two NI 9215 analog input modules) and recorded with a computer equipped with Labview software. To obtain a displacement signal, the LDV velocity signal was integrated.
Figure 1.
Schematic diagram of the experimental setup. As a subject phonates, the vocal fold velocity is collected by a laser Doppler vibrometer with an ELBDU attachment, the vocal fold contact area is collected by EGG, and the sound pressure level is collected by a SLM. The analog signals of these devices are fed to a data acquisition system to be converted to a digital signal and saved by a computer.
Video was recorded with a Welch Allyn (Skaneateles, NY) RL-150 rhinolaryngoscope at 30 frames per second using a KayPentax (Montvale, NJ) Model 9400 light source. Although the use of stroboscopic light had been investigated, the videos used in this study were recorded using the halogen lamp.
The LDV was calibrated to ensure accuracy of velocity amplitudes. A shaker [Brüel & Kjaer (Nærum, Denmark) Mini-shaker Type 4810] was excited at different frequencies. The response was measured simultaneously with LDV and an accelerometer [PCB Model 352C44 (PCB Piezoelectronics, Depew, NY)], showing a difference of ∼1% in the frequency range of this work. Greater differences were observed at higher frequencies.
The endoscopic laser beam deflection unit
Optical access to the human larynx can be achieved through an endoscope with a mirror at an angle of 45° to 70° with respect to the main axis of the instrument. Similar in function to a rigid laryngeal endoscope, a laser beam deflection device was required to direct the laser at the vocal folds for LDV measurements. The diameter of commercially available units, such as the Polytec model VIB-A-530, is too large for comfortable and safe endoscopy. A custom-made endoscopic laser beam deflection unit (ELBDU) was thus designed (Fig. 2).
Figure 2.

Image of the ELBDU design. The left panel shows a closer view of the 45° mirror and protective window end. The right panel shows the entire laser beam deflection unit, including the connection end that attaches to the LDV laser head.
The design was intended to minimize the mirror-end distance and maximize the maneuverability of the ELBDU in the subject's mouth. A 5-mm square first-surface mirror with a thickness of 2 mm was used. The mirror was held in place by a support that caps the end of a 9.5-mm tube and redirects the laser beam at a 45° angle. The design incorporated a 5 mm B270 optical glass window to seal the end of the ELBDU, protecting the mirror surface from damage such as scratches incurred during the removal of fog or liquid.
To investigate the effect of the ELBDU on the LDV measurements, the transfer function of the ELBDU was determined.23 It was found that the ELBDU did not significantly distort the LDV signal amplitude or phase.
Test subjects
Six volunteer test subjects, five males and one female between 21–28 years of age, were included in the experimental sessions. All subjects were healthy with no known history of voice disorders. High-quality data was obtained for three subjects, all male, each with two clinical measurement sessions. A subject's session yielded between 3–5 phonation data records each. These results are presented in this paper.
Experimental procedure
Clinical procedure
The clinical procedures were similar to those of a normal laryngeal endoscopic examination, in which the subject is examined using either a flexible or rigid endoscope. In the LDV measurements, both types of endoscopes were simultaneously used for video and velocity data acquisition, respectively. A topical anesthetic, lidocaine, was applied to the subject's nasal cavity and throat to reduce discomfort associated with the endoscopes. After the anesthetic had taken effect, the flexible endoscope was introduced into the nose to provide optical access to the vocal folds. The rigid endoscope was then introduced into the mouth to direct the laser beam toward the vocal folds.
The anatomy of each subject was different. The length and location of the larynx differed as well as the vocal fold location within each subject's larynx. In addition, the larynx moved up or down depending on the phonation pitch. Since the vocal folds have minimal light reflectivity, the signal quality was sensitive to the laser focal distance. To maximize the signal quality, the laser focus was adjusted for each subject at the beginning of each clinical session. This was done by adjusting the OFV-534 camera's focus until the vocal folds were clearly seen in the video image. Data acquisition was initiated after the laser beam was in focus and directed at the vocal folds.
Voicing procedure
Several phonation tasks were tested. A baseline was first established by the subject phonating at a comfortable pitch and volume with the voice type /i/. From this baseline, the subject varied the pitch and volume independently. In addition, pitch glides and volume glides were measured.
Subjects had difficulty controlling pitch and volume with the simultaneous introduction of the flexible and rigid endoscopes. Therefore, an audible change in pitch and volume was deemed sufficient. In future experiments, such voicing conditions will be better controlled. Set intervals and ranges of pitch and volume will be established by gender and performed by each subject. The voicing will be monitored with feedback given to ensure the subject is on target.
Analytical methods
Data selection criteria
It was difficult to obtain sufficient backscattered light levels because of the low light reflectivity of the vocal folds. This caused a large portion of the data to be highly corrupted with noise. To avoid using noisy data, a threshold signal-to-noise ratio (SNR) for the data sets was determined. The SNR was evaluated by decomposing the velocity signals into “signal” and “noise” components using a 5 kHz sixth-order Butterworth low-pass filter. The signal and the noise were the root mean square (RMS) values of the data below and above the cut-off frequency, respectively. The 5 kHz cut-off was chosen because the LDV frequency spectra included no significant energy above this frequency. The change of the SNR was determined over time by averaging data windows, creating a sub-sampled data set. By comparing the SNR to the corresponding time domain velocity record, it was established that a SNR value of 5 was appropriate for a good data set. Data records with portions that met the minimum SNR were selected and used for further analysis.
Velocity map
The laser head and target were not fixed in place, causing the laser beam position on the vocal folds to alter. Undesired clinician and subject movement occurred because the laser head was hand-held by the clinician and the subject sat unrestrained. The laser beam position change could affect the measured velocity amplitude. As such, a method to track the laser location and relate it to the velocity was developed to map the velocity profile of the vocal folds.
The map was created by tracking the beam over time and aligning it with the corresponding velocity output. The built-in tools of Adobe (San Jose, CA) After Effects was used to stabilize extraneous movement from the endoscopic video. Specific features in frames were identified and located in subsequent frames. If the feature locations changed, the frame would be translated and/or rotated to match the previous frame. A MATLAB program was developed to determine the coordinates of the laser beam by calculating the centroid of a mass detected by a threshold value of red light. The coordinates of the laser beam were determined for each frame of the video, aligned with the velocity amplitude data in time, and plotted as a color map for visualization. The LDV sampling rate was much greater than the video frame rate. For the purposes of mapping, the velocity reported for each frame was the average velocity amplitude between the current and previous frame.
The resulting velocity map plots average inferior-superior velocities at different locations in space. These velocity amplitudes include the effects of the inferior-superior velocity due to the medial-lateral motion of the folds and the mucosal wave. To visualize and/or quantify the corresponding effect of this motion, high-speed videoendoscopy will be necessary.
RESULTS
LDV, EGG, and SLM measurements
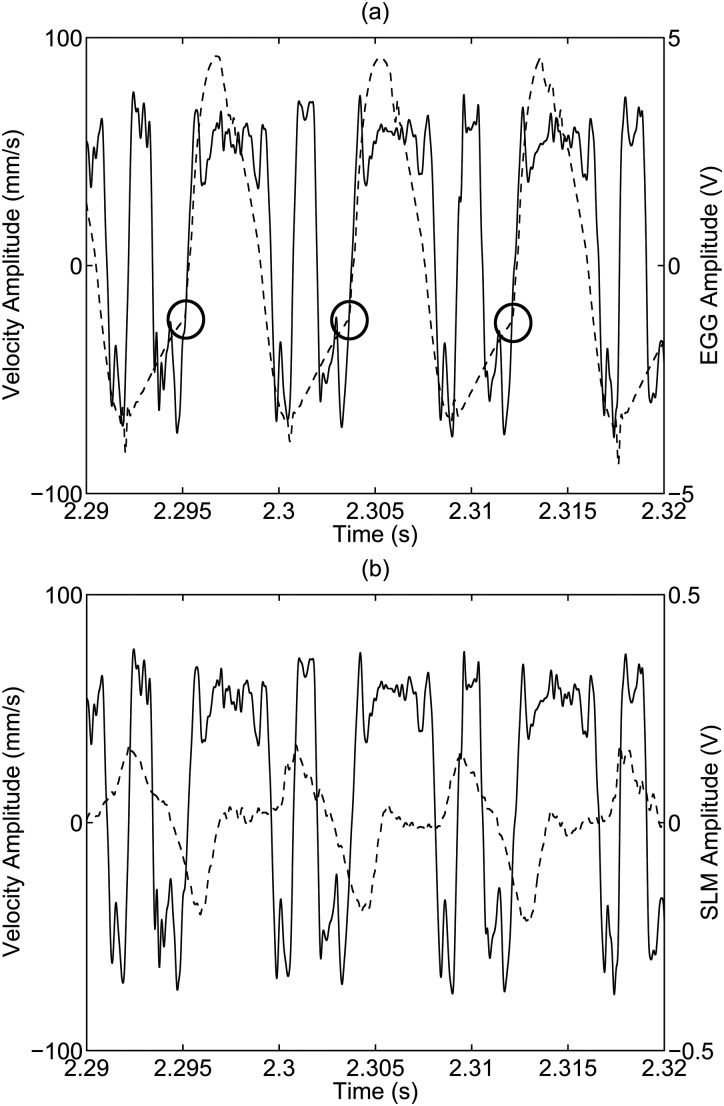
Figure 3 shows the time history of the LDV velocity and EGG signal. A positive velocity indicates that the vocal folds are moving in the superior direction. The time record shown is from Subject 3, Session 1 with a pitch of 115 Hz, a sound pressure level of 61 dB, and an /i/ voice type. The sharp change in the EGG signal slope, indicated with circles, represents when the vocal folds begin to touch in the phonatory cycle. This event occurs at the same location in successive periodic cycles, indicating LDV velocity periodicity and synchrony with the EGG signal.
Figure 3.
LDV signal (solid line) overlaid with (a) EGG signal and (b) SLM signal (dotted lines). The circles indicate a sharp change in the EGG signal slope, which represents when the vocal folds begin to touch in the phonatory cycle.
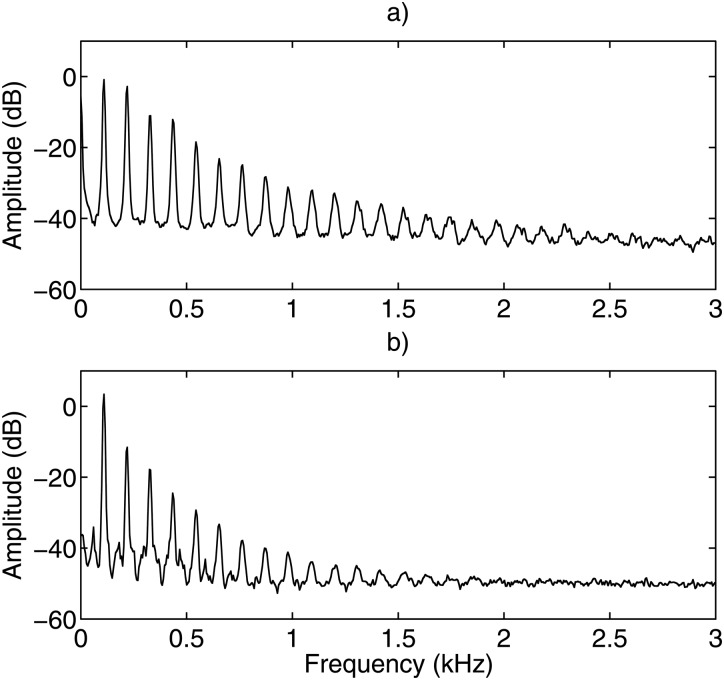
A typical unfiltered frequency spectrum of the velocity signal is shown in Fig. 4a. The spectrum is from Subject 3, Session 1 with a pitch of 110 Hz, a sound pressure level of 66 dB, and an /i/ voice type. Most of the spectral energy is concentrated at frequencies below 3 kHz. This result was consistent for all subjects in all phonation tasks.
Figure 4.
Frequency spectrum of a typical unfiltered signal for the (a) LDV velocity and (b) EGG. It can be seen that the majority of the frequency power is concentrated below 3 kHz.
The spectrum of the velocity was compared with that of the EGG and are seen in Fig. 4b. The fundamental frequency and harmonics peaks were at the same frequencies. The LDV spectrum had greater high-frequency energy than the EGG.
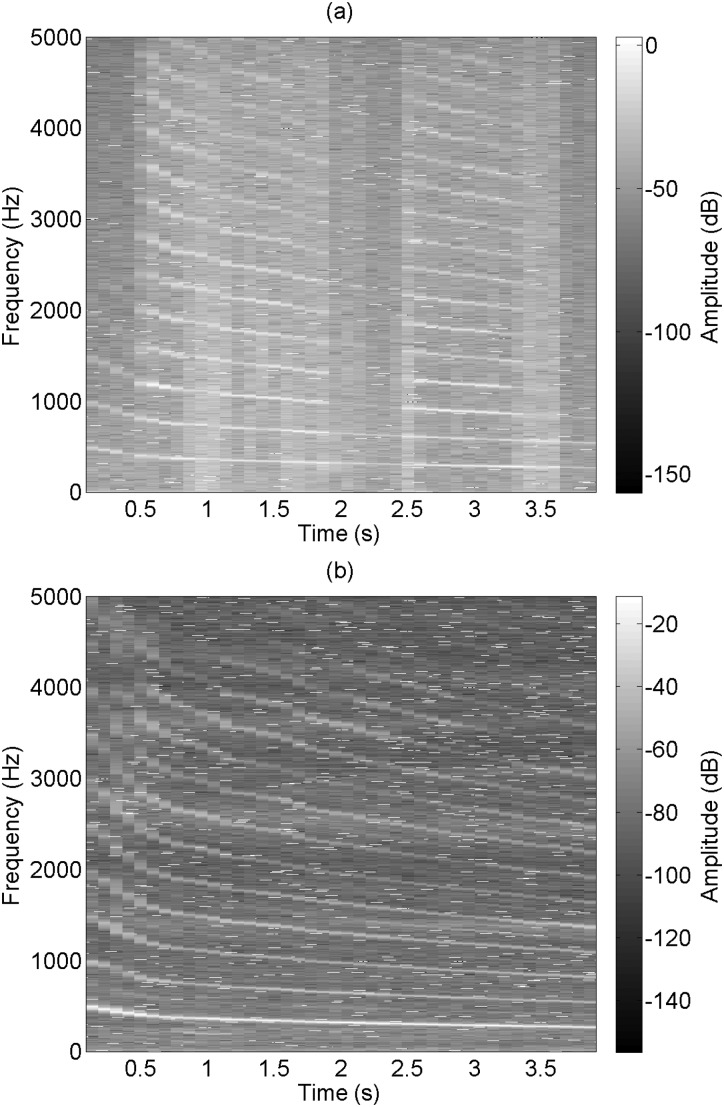
Figure 5 shows one example of a spectrogram obtained during a downward glissando, or pitch glide. The spectrogram is of a velocity signal from Subject 3, Session 1 with a downward pitch glide and an /i/ voice type. The change in fundamental frequency and harmonics are well matched between the LDV and SLM. The LDV had a lower amplitude difference between frequency peaks and valleys because of a lower signal-to-noise ratio.
Figure 5.
A pitch glide as measured by (a) the LDV and (b) the SLM. Frequencies above 5 kHz are not shown.
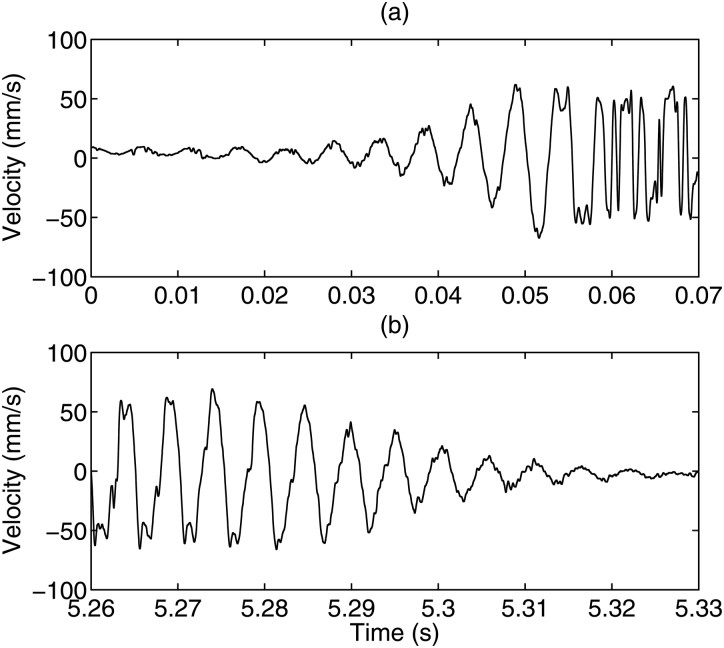
Figure 6 shows velocity data during phonation onset and offset. The phonation onset was from Subject 1, Session 2 with a pitch of 185 Hz, a sound pressure level of 68 dB, and an /i/ voice type. The phonation offset was from the same subject and session with a pitch of 195 Hz, a sound pressure level of 71 dB, and an /i/ voice type. The phonation onset and offset times, defined as the time between 10% and 90% of the steady velocity amplitude, were determined to be ∼40 ms.
Figure 6.
Velocity time record showing (a) phonation onset and (b) phonation offset.
Velocity waveforms
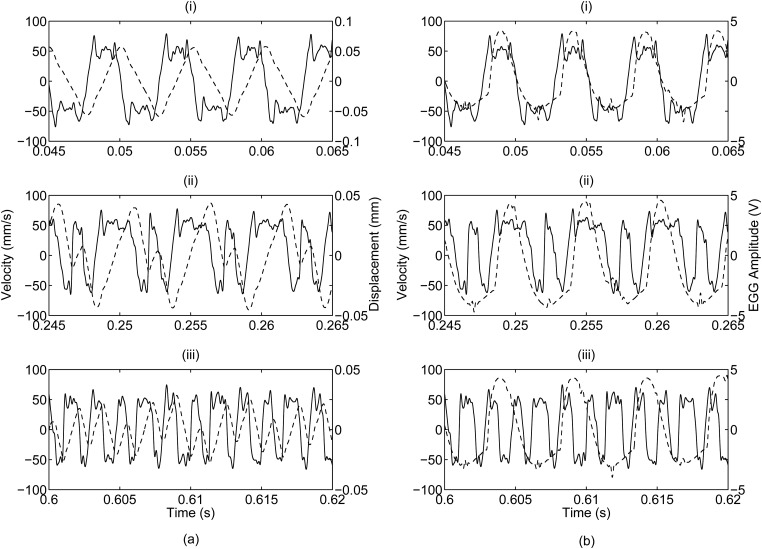
The velocity profile consistently showed three recurring waveforms. These waveforms are shown in Fig. 7 with their corresponding displacement and EGG signals. They appeared in all subjects with no relation to any phonatory conditions. While the phonatory condition was held constant, the velocity profiles randomly shifted between one of these three waveforms.
Figure 7.
Time record representations of three distinct velocity waveforms that were consistently found in the data records. The solid line depicts the velocity profile and the dotted line depicts (a) the displacement profile and (b) the EGG signal. The waveforms, identified as (i) Shape A, (ii) Shape B, and (iii) Shape C, are progressively more complex. The progression of the three shapes is illustrated in Fig. 11.
Table TABLE I. shows the percentage waveform distribution for each subject. Shape A was the most common waveform, with each subject showing it over 55% of the time. It was seen most in Subject 1 with 78% of the phonations exhibiting this waveform. Shape B was the next most common with a moderate showing in each of the subjects ranging between 17%–35%. Shape C was the least common. Subjects 1 and 3 showed this waveform infrequently at 7% or less. It was more common in Subject 2 at 25% of the phonations.
TABLE I.
Statistical distribution of the three velocity waveforms, expressed as the percentage of each subject's recorded phonations.
| Shape A | Shape B | Shape C | |
|---|---|---|---|
| Subject 1 | 78.3 | 17.1 | 4.6 |
| Subject 2 | 55.0 | 19.5 | 25.5 |
| Subject 3 | 58.3 | 34.6 | 7.1 |
| Overall | 63.9 | 23.7 | 12.4 |
Velocity and displacement amplitudes
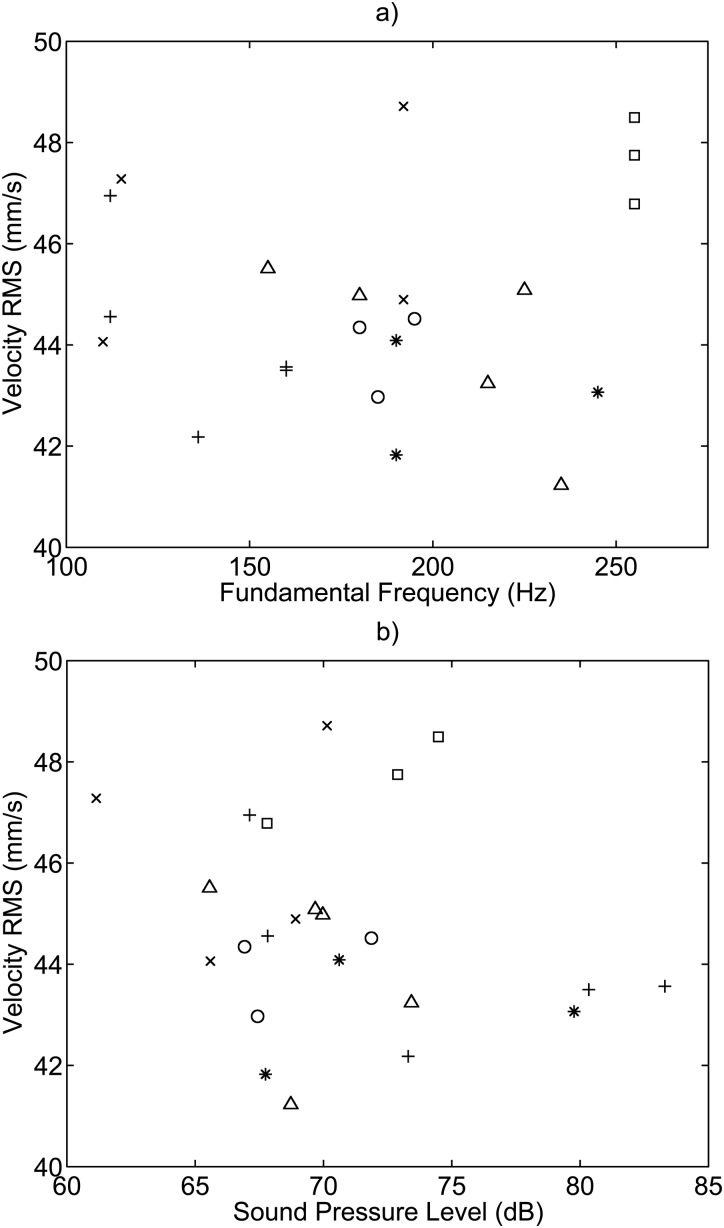
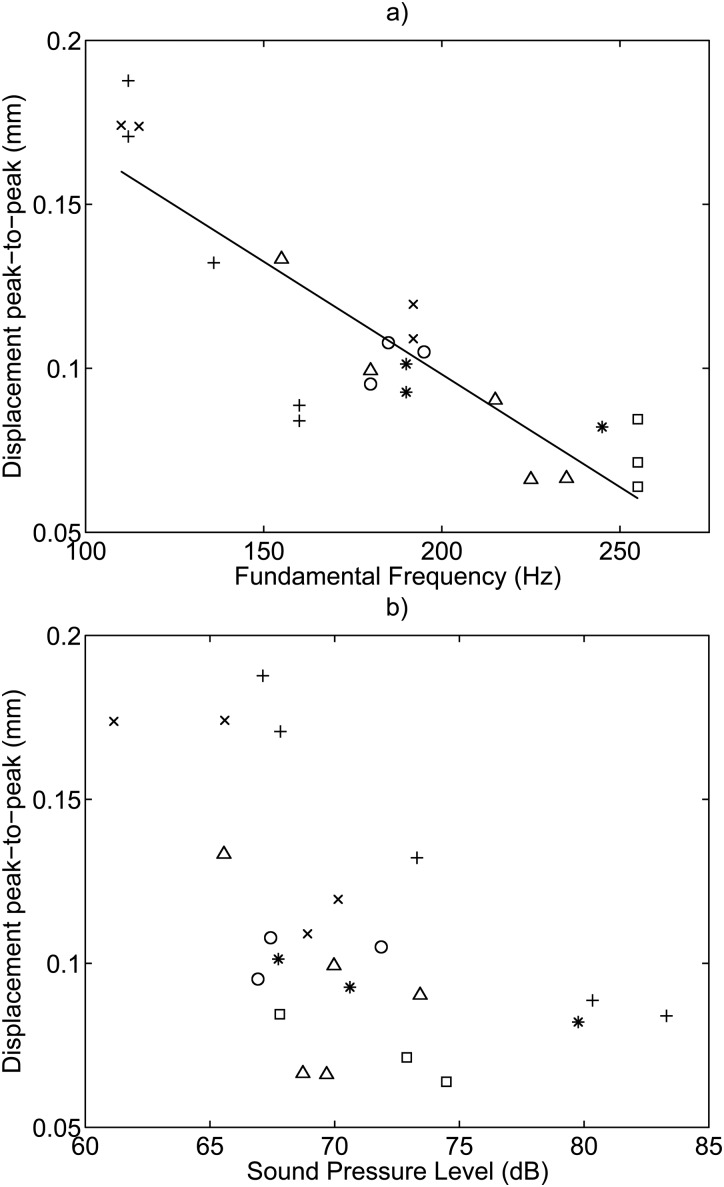
The velocity amplitude taken as the velocity RMS was plotted against phonation frequency and the sound pressure level, and is shown in Fig. 8. No relationship was found between velocity amplitude and fundamental frequency, or velocity amplitude and sound pressure level. The velocity amplitude was measured to be between 40 and 50 mm/s with an average value of 45 mm/s. A relationship was found between the displacement and frequency with an of 0.774, and is shown in Fig. 9 as the peak-to-peak displacement. No relationship was found between displacement amplitude and sound pressure level. The determined velocity and displacement correlation coefficients and degrees of freedom (DOF) for the error can be found in Table TABLE II..
Figure 8.
Velocity amplitude plotted versus (a) fundamental frequency and (b) sound pressure level. No relationship was found between velocity amplitude and fundamental frequency, or velocity amplitude and sound pressure level. The symbols denote: + Subject 1, Session 1; ○ Subject 1, Session 2; ∗ Subject 2, Session 1; △ Subject 2, Session 2; × Subject 3, Session 1; and □ Subject 3, Session 2.
Figure 9.
Displacement peak-to-peak amplitude plotted versus (a) fundamental frequency, and (b) sound pressure level. A correlation was found between displacement and frequency and is indicated by the fitted trend line with an of 0.774. No relationship was found between displacement and sound pressure level. The symbols denote: + Subject 1, Session 1; ○ Subject 1, Session 2; ∗ Subject 2, Session 1; △ Subject 2, Session 2; × Subject 3, Session 1; and □ Subject 3, Session 2.
TABLE II.
Linear regression correlation coefficients for velocity and displacement data. The coefficients define a line of the form y = Ax + B.
| x | y | A | B | DOF for error | |
|---|---|---|---|---|---|
| Fundamental frequency | Velocity | 4.19 mm/s/Hz | 43.99 mm/s | 0.009 | 21 |
| Displacement | −0.687 μm/Hz | 0.236 mm | 0.774 | 21 | |
| Sound pressure level | Velocity | −86.17 mm/s/dB | 50.85 mm/s | 0.046 | 21 |
| Displacement | −3.87 μm/dB | 0.382 mm | 0.290 | 21 |
Velocity map
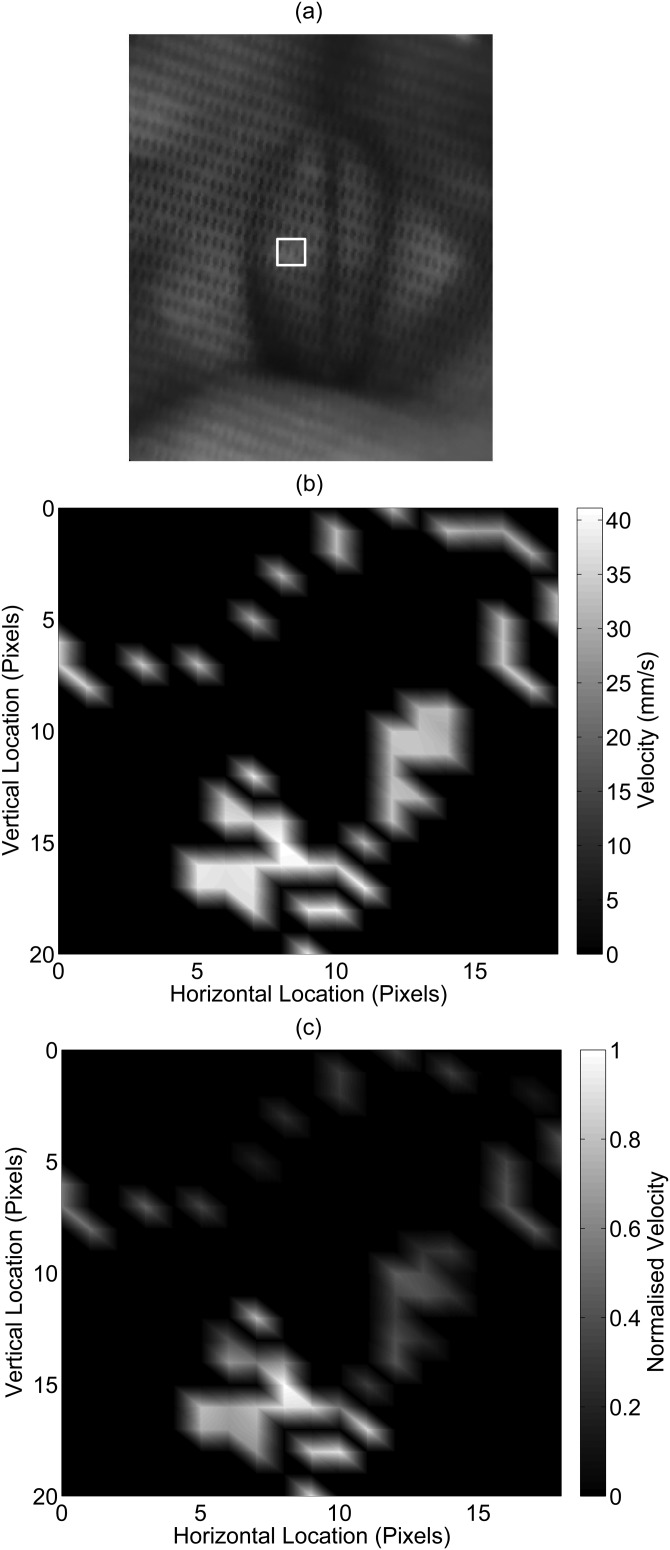
Figure 10 shows an example of a velocity map. The measured velocities were all approximately in the same range. To distinguish the velocities, the velocity profile was normalized, and is seen in Fig. 10c. The range mapped was limited to the medial-lateral and anterior-posterior deviation of the laser beam on the vocal folds. In the example shown, the motion was limited to a small section in the middle of the left vocal fold.
Figure 10.
An example case of a vocal fold velocity map. (a) The highlighted region in the endoscopic image indicates the velocity map boundaries. The velocities are shown as (b) absolute mm/s units and (c) normalized units, where 1 = maximum velocity amplitude and 0 = minimum velocity amplitude. The velocities shown were averaged if a pixel location was measured more than once in the given phonation time record.
DISCUSSION
The results obtained by LDV show that the periodicity of the LDV, EGG, and SLM data match. In the time domain, periodicity was shown with the overlaid LDV and EGG signals. The cycle-to-cycle location of LDV and EGG features remained the same. In the frequency domain, the LDV, EGG, and SLM fundamental frequency and harmonic content were synchronous and accurate.
The frequency spectrum results show that the velocity data did not have any significant frequency power above 3 kHz. This suggests that a minimum of 6 kHz is required for high-speed video to resolve the kinematics of the vocal folds. Knowledge of this expected frequency response allows for more in-depth study of the vocal folds at proper sampling rates.
Interestingly, the velocity spectrum had greater high-frequency energy than the EGG. This could be because the frequency response of the EGG is limited to around 3 kHz. The higher frequency damping could also be due to damping of the measured EGG impedance signal transmitted from the glottis to the neck tissue surrounding the laryngeal prominence or the frequency dependence of impedance.
The phonation onset and offset times are other quantities with which the LDV measurements can be compared. The measured times were in the expected range of times as indicated in the literature.24
This study reports direct velocity measurements of the in vivo human vocal fold superior surface. Previous studies have required the use of image processing and analysis to indirectly measure the velocity and displacement.
Recurring waveforms were observed in the velocity signal showing kinematic features of the vocal folds. The waveforms seemed to occur randomly even as the phonatory condition was held constant. The waveform distributions from Table TABLE I. show that subjects' vocal folds tend to vibrate with certain waveforms. The waveform changes were only detected in the LDV signal with no detectable change in the endoscopic video, sound level meter, or EGG data.
The waveforms were progressively more complex. Figure 11 shows drawings of the three waveforms shown in Fig. 7. Shape A, the most basic waveform, resembles a square wave. This waveform appears to be the base from which the other two waveforms are derived. Shape B appears to be derived from Shape A with the addition of a peak in the middle of the Shape A valley. Shape C appears to be derived from Shape B with the addition of a valley in the middle of the Shape A peak.
Figure 11.

A representation of the three distinct waveforms shown in Fig. 7. The waveforms become progressively more complex, starting with (a) Shape A, the basic wave shape that is similar to a square wave, (b) Shape B, with an additional peak in Shape A's valley, and (c) Shape C, with an additional valley in Shape B's peak.
A simulation by Thomson and Murray has helped identify that the waveforms could represent the inferior-superior kinematic features of the vocal fold mucosal wave.25 A change in waveforms could signify a change in the vocal fold mode of vibration. The velocity of the model was traced at a single spatial location to mimic LDV velocity data. The resulting profile shows peaks at similar locations as Shape B, and is seen in Fig. 12. This suggests that these profiles could represent measurement of the vocal folds' different mode shapes.
Figure 12.
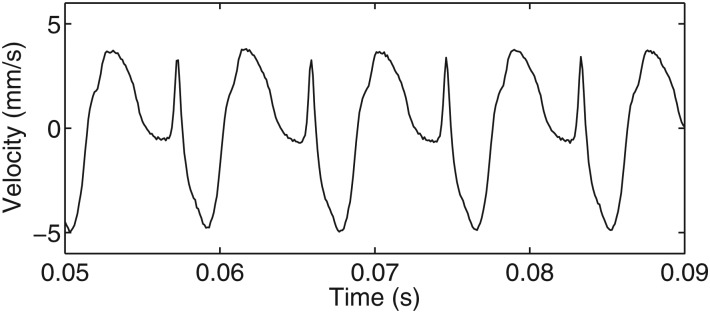
Velocity profile of a mucosal wave model (Ref. 25). This velocity profile shows strong resemblance to the Shape B waveform seen in Figs. 711. The resemblance of the velocity profiles suggests that the waveforms could be different modes of the mucosal wave.
The waveforms' velocity profile and random occurrence could be due to the highly non-linear kinetics of the human vocal fold and the vibrational irregularities and instabilities of voice. It was found that parameters such as tension, stiffness, and phonatory airflow can cause bifurcations and eigenmode synchronization.26, 27, 28, 29, 30 Higher modes could also be stimulated by the dynamics of vocal fold collision and interference of cycle-to-cycle waves due to the change in timing and amplitude from jitter and shimmer. These phenomena may explain the measured mode-switching because of subtle changes in the subject's phonatory conditions.
Further investigation is required to understand the mechanism that causes the waveforms. Simultaneous recording of LDV and high-speed imaging may provide insight on any physical changes that correspond to the waveforms. Current work with this measurement method on excised porcine larynges has shown similar velocity and displacement profiles as those found in the present study.
No relationship was found between the superior surface velocity RMS amplitude and the phonation frequency or sound pressure level. This suggests that the vocal fold velocity amplitude along the inferior-superior direction does not change with either pitch or volume. A relationship was found between the phonation frequency and displacement. As expected, the vertical displacement amplitudes decreased with increasing pitch.
The velocity amplitude results show with high consistency that the superior surface of the vocal folds vibrated on average with a velocity of 45 mm/s. Previously reported velocities of suture points on the vocal folds of an excised human larynx measured the superior surface maximum velocities between 210 and 1340 mm/s.5, 6 The superior surface velocity RMS of synthetic vocal folds reported by Spencer et al. measured at 146.9 mm/s and 132.6 mm/s for LDV and digital image correlation, respectively.31
Peak-to-peak displacement amplitudes were found between 0.064 and 0.188 mm. For the maximum vertical displacement amplitude, reported ranges from several studies are summarized in Table TABLE III.. There is a discrepancy of up to an order of magnitude between the results of this study and those reported previously. A probable explanation is the corresponding location of measurement. With LDV, measurement was along the direction of the beam and at a single location in space, lateral from the vocal fold edge. However, previous studies reported maximum displacements, which were found at the vocal fold edge. Graphical displacement results lateral to the vocal fold edge were reported in some of these studies. They showed that the displacement of the edge is very large compared to those found a few millimeters laterally. In fact, their non-edge vertical displacements were similar to those measured in the present study.
TABLE III.
Maximum vertical displacement values of previous studies.
| Study | Vocal foldexperiment type | Maximum verticaldisplacement (mm) |
|---|---|---|
| Present study | In vivo human | 0.064–0.188 |
| Manneberg et al. (Ref. 16) | In vivo human | 0.5–1.35 |
| Boessenecker et al. (Ref. 6) | Excised human larynx | 0.21±0.05–1.15±0.2 |
| Doellinger and Berry (Ref. 5) | Excised human larynx | 1.29±0.08 |
| Doellinger et al. (Ref. 4) | Excised human larynx | ∼1.75 |
| Luegmair et al. (Ref. 18) | Excised porcine larynx | 1.76–2.75 |
| George et al. (Ref. 11) | Excised porcine larynx | 0.7–2 |
| Kobayashi et al. (Ref. 15) | Excised canine larynx | 0.15–0.35 |
| Spencer et al. (Ref. 31) | Synthetic | 0.95–2.2 |
| Luegmair et al. (Ref. 18) | Synthetic | 0.61–0.81 |
Preliminary velocity mapping results are shown for a very small range of locations lateral from the vocal fold edge. Within the range evaluated, no relationship was found between the location of the laser beam on the vocal folds and velocity amplitude. Further experimentation is needed to resolve the velocity profile of the vocal fold surface, especially in the area near the vocal fold edge. Larger displacement amplitudes are expected in this area.
In this study, only a few cases were ideally suited for the analysis, which required the flexible video endoscope to be very close to the vocal folds for sufficient spatial resolution. In the majority of the videos, this was not the case, causing no visible distinction of laser movement on the vocal folds.
The limitations of this study include the difficulty of measuring a single point in space or on the vocal folds, and low backscattered light intensity.
LDV can only measure a single location in space, and is not capable of tracking any single location on the vocal folds because of their complex vibrational patterns. Velocity measurements of a single point in space were challenging because of extraneous movement during LDV measurements. This limitation inspired the velocity mapping technique. However, without high-speed imaging, the velocity of various locations were averaged together.
The low levels of backscattered light from the vocal folds compromised the data quality, corrupting it with noise. Movement of any kind often reduced the signal strength. Optical enhancements are needed to remedy this problem in the future.
SUMMARY/CONCLUSION
A method of measuring in vivo vocal fold superior surface velocities with LDV was demonstrated, where velocity is directly obtained without the use of image processing. Accurate velocity data for three subjects was obtained, despite noise caused by limited backscattered light. Phonation onset and offset times were measured to be ∼40 ms. The spectral density of the vibrometry signals featured harmonics of the fundamental frequency up to a bandwidth of around 3 kHz. Three distinct velocity waveforms were observed and may indicate bifurcations between vibrational modes of the mucosal wave. No relationship was found between the occurrence of a waveform and the phonatory conditions. The velocity amplitude was found to be between 40 and 50 mm/s for normal phonation between frequencies of 100–260 Hz, sound pressure levels of 60–80 dB, and for an /i/ voicing. The displacement peak-to-peak amplitudes were between 0.064 and 0.188 mm. A trend was found where the displacement decreased with increasing phonation frequency. Within a limited spatial range away from the vocal fold edge, no relationship was found between the laser beam location on the vocal folds and velocity amplitude.
ACKNOWLEDGMENTS
This work was supported by Research Grant Nos. R01 DC 008290 and R01 DC 005788 from the National Institute on Deafness and other Communication Disorders. The authors would like to thank Dr. Nadine Yammine for her contributions in performing the clinical experiments. We thank Kari Ostevik, Hossein Khadivi Heris, Dr. Jonathan Young, and Dr. Sam Daniel for their role in initiating the project. We thank Siavash Kazemirad for his contributions in preparing the manuscript. We are grateful to all our willing and understanding experimental subjects.
References
- Baer T., “ Observation of vocal fold vibration: Measurement of excised larynges,” in Vocal Fold Physiology, edited by Stevens K. and Hirano M. (University of Tokyo Press, Tokyo, 1981), pp. 119–133. [Google Scholar]
- Titze I. R., Principles of Voice Production (Prentice-Hall, Englewood Cliffs, NJ, 1994), Chap. 4, pp 80–111. [Google Scholar]
- Berry D. A., Montequin D. W., and Tayama N., “ High-speed digital imaging of the medial surface of the vocal folds,” J. Acoust. Soc. Am. 110, 2539–2547 (2001). 10.1121/1.1408947 [DOI] [PubMed] [Google Scholar]
- Doellinger M., Tayama N., and Berry D. A., “ Empirical eigenfunctions and medial surface dynamics of a human vocal fold,” Methods Inf. Med. 44, 384–391 (2005). [PubMed] [Google Scholar]
- Doellinger M. and Berry D. A., “ Visualization and quantification of the medial surface dynamics of an excised human vocal fold during phonation,” J. Voice 20, 401–413 (2006). 10.1016/j.jvoice.2005.08.003 [DOI] [PubMed] [Google Scholar]
- Boessenecker A., Berry D. A., Lohscheller J., Eysholdt U., and Doellinger M., “ Mucosal wave properties of a human vocal fold,” Acta Acust. Acust. 93, 815–823 (2007). [Google Scholar]
- Avitabile P., Niezrecki C., Helfrick M., Warren C., and Pingle P., “ Noncontact measurement techniques for model correlation,” J. Sound Vib. 44, 8–13 (2010). [Google Scholar]
- Jones M. E., Gee K. L., and Grimshaw J., “ Vibrational characteristics of Balinese gamelan metallophones,” J. Acoust. Soc. Am. 127, EL197–EL202 (2010). [DOI] [PubMed] [Google Scholar]
- Zucca S., Di Maio D., and Ewins D. J., “ Measuring the performance of underplatform dampers for turbine blades by rotating laser Doppler vibrometer,” Mech. Syst. Signal Process. 32, 269–281 (2012). 10.1016/j.ymssp.2012.05.011 [DOI] [Google Scholar]
- Hubbard J. A., Brockmann J. E., Rivera D., and Moore D. G., “ Experimental study of impulse resuspension with laser Doppler vibrometry. ” Aerosol Sci. Technol. 46, 1303–1312 (2012). 10.1080/02786826.2012.708464 [DOI] [Google Scholar]
- George N. A., de Mul F. F. M., Qiu Q., Rakhorst G., and Schutte H. K., “ Depth-kymography: High-speed calibrated 3D imaging of human vocal fold vibration dynamics,” Phys. Med. Biol. 53, 2667–2675 (2008). 10.1088/0031-9155/53/10/015 [DOI] [PubMed] [Google Scholar]
- Jiang J. J., Zhang Y., Kelly M. P., Bieging E. T., and Hoffman M. R., “ An automatic method to quantify mucosal waves via videokymography,” Laryngoscope 118, 1504–1510 (2008). 10.1097/MLG.0b013e318177096f [DOI] [PMC free article] [PubMed] [Google Scholar]
- Voigt D., Doellinger M., Eysholdt U., Yang A., Guerlek E., and Lohscheller J., “ Objective detection and quantification of mucosal wave propagation,” J. Acoust. Soc. Am. 128, EL347–EL353 (2010). 10.1121/1.3493637 [DOI] [PubMed] [Google Scholar]
- Krausert C. R., Olszewski A. E., Taylor L. N., McMurray J. S., Dailey S. H., and Jiang J. J., “ Mucosal wave measurement and visualization techniques,” J. Voice 25, 395–405 (2011). 10.1016/j.jvoice.2010.02.001 [DOI] [PMC free article] [PubMed] [Google Scholar]
- Kobayashi J., Yumoto E., Hyodo M., and Gyo K., “ Two-dimensional analysis of vocal fold vibration in unilaterally atrophied larynges,” Laryngoscope 110, 440–446 (2000). 10.1097/00005537-200003000-00022 [DOI] [PubMed] [Google Scholar]
- Manneberg G., Hertegard S., and Liljencrantz J., “ Measurement of human vocal fold vibrations with laser triangulation,” Opt. Eng. 40, 2041–2044 (2001). 10.1117/1.1396324 [DOI] [Google Scholar]
- Svec J. G. and Schutte H. K., “ Videokymography: High-speed line scanning of vocal fold vibration,” J. Voice 10, 201–205 (1996). 10.1016/S0892-1997(96)80047-6 [DOI] [PubMed] [Google Scholar]
- Luegmair G., Kniesburges S., Zimmermann M., Sutor A., Eysholdt U., and Dollinger M., “ Optical reconstruction of high-speed surface dynamics in an uncontrollable environment,” IEEE Trans. Med. Imaging 29, 1979–1991 (2010). 10.1109/TMI.2010.2055578 [DOI] [PubMed] [Google Scholar]
- Ouaknine M., Garrel R., and Giovanni A., “ Separate detection of vocal fold vibration by optoreflectometry: A study of biphonation on excised porcine larynges,” Folia Phoniatr. Logop. 55, 28–38 (2003). 10.1159/000068058 [DOI] [PubMed] [Google Scholar]
- Garrel R., Nicollas R., Giovanni A., and Ouaknine M., “ Optoreflectometry determination of the resonance properties of a vocal fold,” J. Voice 21, 517–521 (2007). 10.1016/j.jvoice.2006.05.002 [DOI] [PubMed] [Google Scholar]
- Berry D. A., Herzel H., Titze I. R., and Krischer K., “ Interpretation of biomechanical simulations of normal and chaotic vocal fold oscillations with empirical eigenfunctions,” J. Acoust. Soc. Am. 95, 3595–3604 (1994). 10.1121/1.409875 [DOI] [PubMed] [Google Scholar]
- Fletcher N. H., “ Nonlinearity, complexity, and control in vocal systems,” in Vocal Fold Physiology: Controlling Complexity and Chaos, edited by Davis P. H. and Fletcher N. H. (Singular Publishing Group, San Diego, 1996), pp. 3–16. [Google Scholar]
- Chan A., “ Vocal fold vibration measurements using laser Doppler vibrometry,” Master's thesis, McGill University, 2011. [DOI] [PMC free article] [PubMed] [Google Scholar]
- Mergell P., Herzel H., Wittenberg T., Tigges M., and Eysholdt U., “ Phonation onset: Vocal fold modeling and high-speed glottography,” J. Acoust. Soc. Am. 104, 464–470 (1998). 10.1121/1.423250 [DOI] [PubMed] [Google Scholar]
- Thomson S. L. and Murray P. R., “ Self-oscillating, multi-layer numerical and artificial vocal fold models with thin epithelial and loose cover layers,” in Proceedings of the 7th International Workshop on Models and Analysis of Vocal Emissions for Biomedical Applications, edited by Manfredi C. (Firenze University Press, Firenze, 2011), pp. 57–60. [Google Scholar]
- Berry D. A., Herzel H., Titze I. R., and Story B. H., “ Bifurcations in excised larynx experiments,” J. Voice 10, 129–138 (1996). 10.1016/S0892-1997(96)80039-7 [DOI] [PubMed] [Google Scholar]
- Lucero J. C., “ A theoretical study of the hysteresis phenomenon at vocal fold oscillation onset-offset,” J. Acoust. Soc. Am. 105, 423–431 (1999). 10.1121/1.424572 [DOI] [PubMed] [Google Scholar]
- Mergell P., Herzel H., and Titze I. R., “ Irregular vocal-fold vibration-high-speed observation and modeling,” J. Acoust. Soc. Am. 108, 2996–3002 (2000). 10.1121/1.1314398 [DOI] [PubMed] [Google Scholar]
- Tokuda I. T., Horacek J., Svec J. G., and Herzel H., “ Comparison of biomechanical modeling of register transitions and voice instabilities with excised larynx experiments,” J. Acoust. Soc. Am. 122, 519–531 (2007). 10.1121/1.2741210 [DOI] [PubMed] [Google Scholar]
- Zhang Z. Y., “ Dependence of phonation threshold pressure and frequency on vocal fold geometry and biomechanics,” J. Acoust. Soc. Am. 127, 2554–2562 (2010). 10.1121/1.3308410 [DOI] [PMC free article] [PubMed] [Google Scholar]
- Spencer M., Siegmund T., and Mongeau L., “ Determination of superior surface strains and stresses, and vocal fold contact pressure in a synthetic larynx model using digital image correlation,” J. Acoust. Soc. Am. 123, 1089–1103 (2008). 10.1121/1.2821412 [DOI] [PubMed] [Google Scholar]


